Introduction
For political economy, the manner in which the gross value added created in capitalist society is shared between the two primary social classes, the working class and the capitalist class, is a central topic of study. Capital accumulation is vital for the continuity of capitalism, and its extent reflects the proportions in which the total value created in society is divided among social classes. This process, however, is not linear. While capital accumulation is interrupted from time to time due to the instability, inequality, and crises inherent in capitalism, there are also periods when it accelerates.
Financial markets came to occupy a central place in capitalist economies in the course of the 1980s, 1990s, and early 2000s, and reached gigantic proportions in terms of the number of their participants, the volume of transactions, and the variety of financial products. These markets have come to affect economic activities and economic policies at a profound level. In particular, financial markets have come to act as conduits for massive capital flows, mostly from the “center” to the “periphery” of global capitalism, but also at times from the periphery to the center. Not only direct investments, but also short-term capital movements, the privatization of public enterprises, the opening of sectors such as education and health to private firms, and the commodification of nature have provided new areas of profit for capital. When short-term capital (“hot money”) is transferred to the financial markets of peripheral countries in hopes of realizing speculative gains, the national currency becomes overvalued due to the sudden increase in the foreign exchange supply. As a result, stock markets rise rapidly, and bubbles are formed. Funds provided by financial institutions through borrowing from abroad lead to increased domestic consumption through consumer loans, and false economic growth is achieved without additional employment or real fixed capital investments. As a result of this process, the main channel of accumulation within capitalism has shifted in the direction of financial markets rather than industry. In the heterodox economics literature, this process is called financialization 1 (Epstein 2005, 3; Krippner 2005, 185; Foster 2007, 11). The countries of both the core and periphery have participated in this process, not only through their financial but also their non-financial institutions (Koç 2021a, 28). Even working-class households have become heavily indebted through consumer loans, and have been drawn into financialization (Lapavitsas 2011, 15–50).
While the crises that occurred in the financialization process from the 1980s to 2007 were regional phenomena that at times spilled over onto the international scene, the first global crisis of financialization naturally had its origins in the central country of the financial system, the USA. The 2008/2009 crisis can be seen as a crisis of financialized capitalism (Koç 2020, 253). Severe declines in financial markets, bankruptcies of financial and real sector institutions, increased unemployment in countries experiencing economic and financial crisis, deterioration in income distribution, deepening of class inequalities, and public takeovers of the debts of bankrupt banks all had negative consequences. These problems were to leave their mark on these countries until far into the future. Unfortunately, there was no renouncing of neoliberal policies following the global crisis; no increase in the level of union organization had occurred to advance the social gains of labor and ensure that it received a larger share of added value.
Consequently, the financialization process has seriously affected the socio-economic structure of the countries involved. In the heterodox social science literature, two fundamental propositions are often mentioned regarding financialization as it has developed since the 1980s. The first is an increase in the degree of inequality between labor and capital incomes, with labor incomes decreasing in relative terms. As class inequality has increased, and the socio-political atmosphere created by the neoliberal practices applied by the governments of the countries concerned has become more toxic, the share of union members among total employees has declined radically as a result of pressure on the unions, and the bargaining power of labor has grown weaker (Western 1995, 180–186; Silver 2015, 6–29). In addition, secure employment policies have increasingly been replaced by once-atypical provisions that feature low wages, flexible working based on temporary and precarious employment, contracted personnel, and subcontracting (Bronstein 1991, 291–293). This has heightened class inequality in favor of capital (Koç and Sarıca 2016, 49).
A second proposition is that the finance sector in a broad sense (FIRE – finance, insurance, and real estate) has become predominant over manufacturing industry. According to the OECD average, the ratio of employees in the FIRE sector to those working in manufacturing industry, which in 1970 was 0.11, increased to 0.26 in the early 1990s and to 0.35 in 2016, showing a continuous upward trend (Koç 2021a, 54). The same trend can be observed in the ratio of gross value added in the FIRE sector to gross value added in manufacturing industry. In 1970 the OECD average for this ratio was 0.46; subsequently, it showed a continuous increasing trend until peaking in 2009 at 1.15, after which it decreased slightly to 1.12 in 2016.
The questions that this study seeks to answer are: how did the incomes of labor and capital change in relative terms in OECD countries between 1995 and 2019? How did this change differ in various sub-periods, and which social class did the differences favor? What effects did the change have on manufacturing industry and the finance sector? Answers to these questions are sought in the analysis of the shares of labor and capital in gross value added. Further, the study also discusses how the global financial crisis experienced during the period examined affected the relative incomes of these two social classes.
The subject of the study is thus labor and capital incomes in the manufacturing and finance sectors, and its scope encompasses 31 OECD countries 2 for which data for the 1995–2019 period can be obtained. The study aims to reveal whether the shares in gross value added of the working class and capitalist class diverged after the mid-1990s, the point at which financialization in the OECD countries is assumed to have accelerated. If a divergence exists, the study will attempt to determine how this divergence accords with the state of the manufacturing and finance sectors during the different sub-periods.
The study consists of four parts. After this short introduction, the purpose, importance, scope, and method of the study are explained. In the second part, the variables used in the study and the methods employed in the calculations are introduced, while in the third part the findings obtained are presented and discussed using tables and figures. In the concluding section of the study, a general evaluation is made, ending with some policy recommendations.
Variables and Methods Used in the Study
In the approach employed by Marxist political economy, the wages paid to productive labor are subtracted at the end of the production process from the monetary value created by productive labor, with the remainder constituting surplus value. After various taxes paid to the government are deducted from the surplus value, the remainder then forms the income of capital. In the circulation cycle of capital, after expenses such as interest, insurance and rent are paid to various capital groups from the surplus value, the remainder stays with the entrepreneur as profit. Under the national income accounting method, the concept closest to the surplus value used in the Marxist political economy approach is gross value added, which is widely calculated in today’s capitalist economies. After deducting depreciation and the labor income from the gross value added, the remainder constitutes the share of capital. However, this is not equal to the surplus value employed by Marxist political economy, since surplus value is assumed to be created only by productive labor. Because productive labor and non-productive labor are not distinguished in the statistical data published for today’s economies, it is tricky to calculate surplus value using national income accounting data, and there are few examples of such studies in the literature. 3 Consequently, surplus value analysis in the Marxist sense is not carried out in this study. In the data set for OECD countries used in this study, labor incomes in the manufacturing industry and FIRE sector include both productive and non-productive labor.
There are various discussions on the method used for measuring labor and capital incomes in total value added, and as yet there is no consensus on this issue. In the literature in this field, the “compensation of employees” variable is used as labor income, while the gross operating surplus and the mixed-income variable are used as capital income (Jayadev 2007, 4–5; Harrison 2005, 13; Artner 2017, 151–169; Koç 2020, 253; 2021b, 430). However, a number of authors argue that some of the mixed income included in the capital income figure provided in the OECD database should be included in labor income. In the literature, different methods of calculation are suggested in this regard (Guerriero 2019, 2–6; Gomme and Rupert 2004, 2–4; Harrison 2005, 13–14; Jayadev 2007, 3–5; Krueger 1999, 1–4; La Cava 2019, 17–21). In this study, labor income equals the share of employee compensation in gross value added (GVA), and capital income equals the share of gross operating surplus and mixed income in value added.
In national accounts, total factor income (gross value added) is equal to gross domestic product (GDP) plus subsidies (Sub) minus taxes on production and imports (TPI). Since the sum of these net taxes is relatively small as a share of GDP, total factor income and GDP are very similar, both in their levels and overall trends. Labor income (ComEmp) includes employers’ social contributions, such as wages and salaries paid in cash and kind, and payments to pensions and pension funds. Capital income generally refers to gross operating surplus (GOS) and gross mixed income (GMI). This income is obtained as the portion of gross output that exceeds production costs before depreciation. GOS is income from production by companies, while mixed income is income from production by unincorporated businesses (La Cava 2019, 17–21).
Here, gross value added is shown by Equations (1) and (2). Labor incomes (ComEmp) are shown in Equation (3), and capital incomes (GOSandGMI) in Equation (4). Equations (5) and (6) show the percentage shares of labor (L) and capital incomes (C) in gross value added.
Here GVA is gross value added; ComEmp is labor income; L is the share of labor income in GVA (%); GOSandGMI is gross operating surplus and mixed income (capital income); C is the share of operating surplus and mixed income in GVA (%); TPI is production and import duties; and Sub (subsidies) represents consumption of fixed capital (depreciation).
All analyses consist of three dimensions, and each dimension has three layers. The first dimension is the sectoral dimension, consisting of manufacturing industry (M) and the financial sector in a broad sense. The latter sector, called FIRE, consists of finance, insurance, and real estate. The second dimension is the class dimension, consisting of labor and capital. The third is the periodic dimension. On the basis of the political economy approach, the years between 1995 and 2019 are divided into two sub-periods, in addition to the whole period. While the years between 1995 and 2007, when financialization accelerated, constitute the first sub-period, the years during and after the global financial crisis, between 2008 and 2019, make up the second sub-period. Thus, our study consists of the periods 1995–2007, 2008–2019, and 1995–2019. The figures for the development of labor and capital incomes in the manufacturing and finance sectors during the period from 1995 to 2019 and during the two sub-periods are compared based on the OECD average.
The first layer contains the levelized values of the variables. Since the labor and capital incomes of the OECD countries in the data set are given in the national currency of each country, the index values of all variables have been established with the base year of 1995 as 100. For each sector and sub-period, the trend of the ratio of capital incomes to labor incomes (C/L) is analyzed on the basis of levelized values, and the development of the C/L ratio according to countries is also examined. Again on the basis of the levelized values in the first layer, the capital incomes in the FIRE sector are compared with those in the manufacturing sector. The process is repeated for the labor incomes, and the two sectors are compared.
The second layer shows the share of the variables in GVA. Here, the general trend for the shares of labor and capital in GVA is examined for each sector. The relative increases in the share of labor and capital incomes in GVA during the different sub-periods are compared by calculating the scale of the increases in each period.
The third layer includes the annual percentage changes in the variables. On the basis of levelized values, the annual percentage changes in the variables, the average values for the variables during the different periods, and the scale of the increase in each variable during the various periods are examined. The annual percentage changes of the shares of labor and capital in GVA are also compared for the different sectors and sub-periods.
Analysis according to Levelized Values
General Trend Analysis
Using general trend analysis, it is possible to understand the long-term behavior of the variables involved here. It can be determined whether a variable shows a statistically significant trend, and if this is the case, whether the trend is in the direction of an increase or decrease. The use of trend analysis also allows comparisons of more than one variable to be made for the same period. As well as determining the direction of the trends, it is also possible to compare the magnitude of the slope; if, for example, two variables have a positive slope, one may increase relatively more than the other.
This study aims to reveal the long-term trend of labor and capital incomes in the manufacturing and FIRE sectors, and the existence of a differentiation between them. For these purposes, a general trend analysis of labor and capital variables is made for the two sectors. The long-term trends of the capital income indices for the manufacturing and FIRE sectors, with 1995 as a base, are shown in Figure 1. Between 1995 and 2019, both variables have a statistically significant and increasing linear trend. However, looking at the development of capital incomes in the FIRE sector and manufacturing industry, it can be seen that the FIRE sector has a higher upward trend (FIRE: 14.6 and M: 11.1). It can therefore be said that capital incomes increased relatively more in the FIRE sector compared to manufacturing industry.
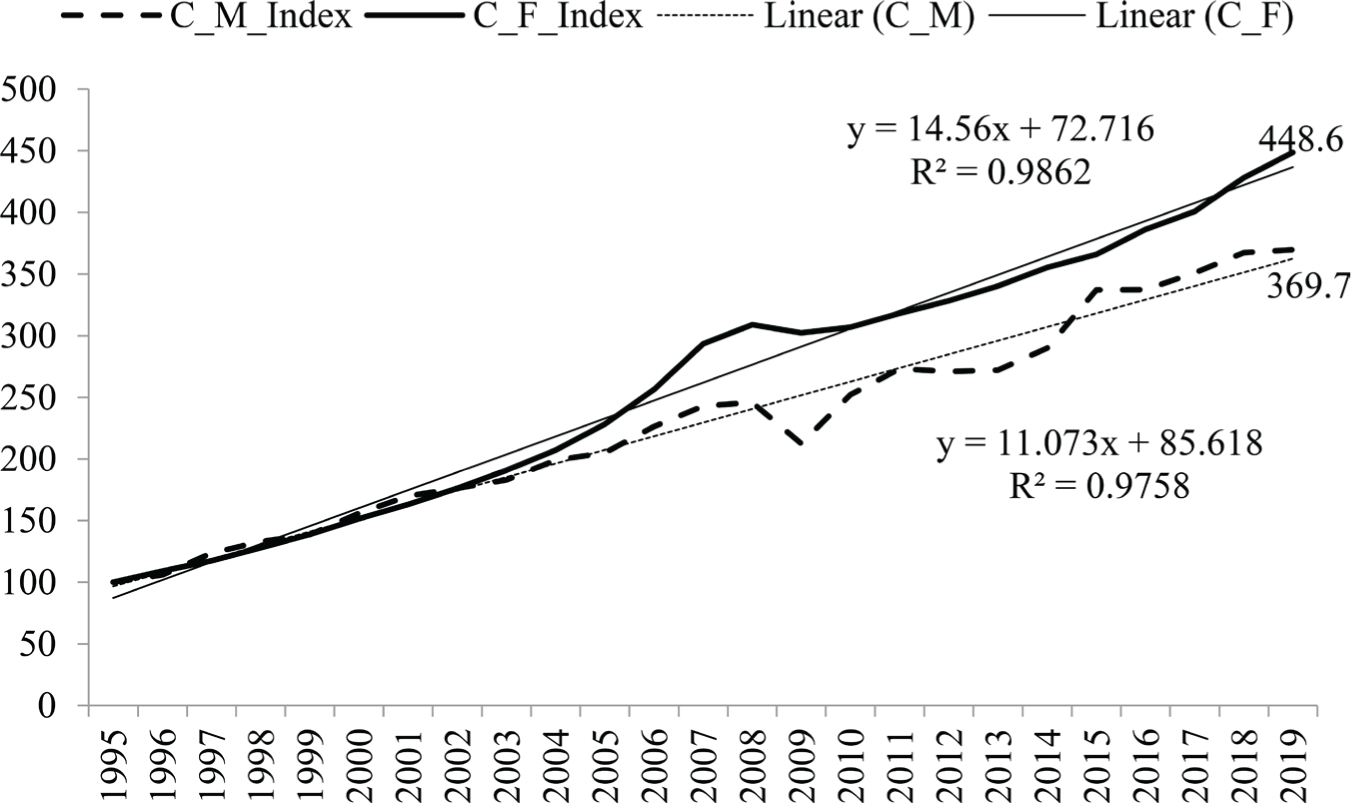
Capital Revenues in the Manufacturing and FIRE Sectors (1995 = 100)
Source: Raw data were obtained from www.oecd.org. The figure was created by the author.
In Figure 2, the labor income index for the manufacturing and FIRE sectors is shown with the base year of 1995. Between 1995 and 2019, both variables display a statistically significant and increasing linear trend. The upward trend of labor incomes in the FIRE sector, however, is greater than in manufacturing industry (FIRE: 12.3 and M: 7.4). The fact that both capital and labor incomes have increased more in the FIRE sector than in manufacturing industry confirms that it is the FIRE sector that has become dominant in the financialization period.
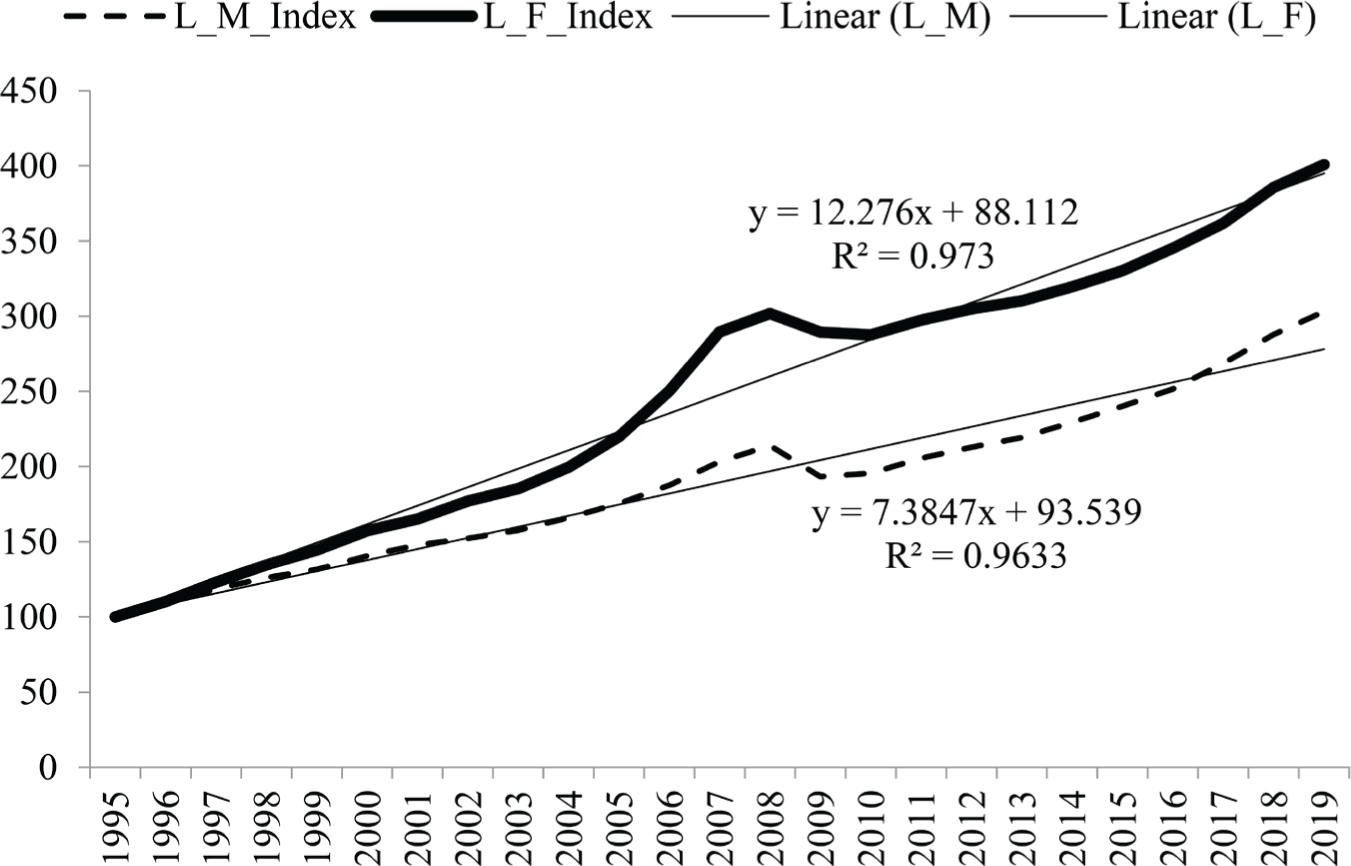
Labor Revenues in the Manufacturing and FIRE Sectors (1995 = 100)
Source: Raw data were obtained from www.oecd.org. The figure was created by the author.
An increase in the capital/labor ratio indicates that capital incomes are increasing more than labor incomes. Conversely, a decrease in this ratio means that labor incomes are rising in relative terms compared to capital incomes. Figure 3 shows the ratio of capital incomes to labor incomes as rising in the manufacturing and FIRE sectors compared to the base year of 1995. Between 1995 and 2019, this ratio showed a statistically significant and increasing linear trend in both sectors. From these results, it can be seen that capital incomes increased more than labor incomes in both the manufacturing and FIRE sectors between 1995 and 2019. When these two sectors are compared, however, it emerges that while the increasing trend in the manufacturing sector is 1.27, in the FIRE sector it is 1.04. From the general trend analysis, it can thus be seen that in manufacturing industry between 1995 and 2019, income distribution in terms of class came increasingly to favor capital.
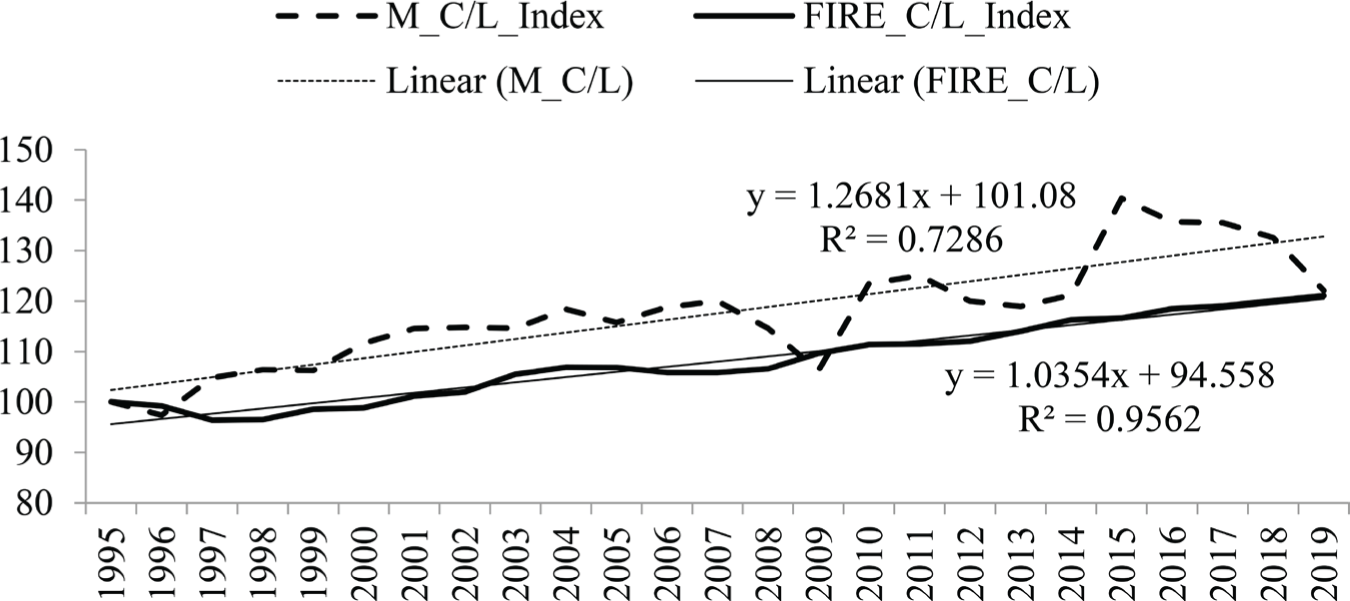
Capital/Labor Ratios of the Manufacturing and FIRE Sectors: 1995–2019 (1995 = 100)
Source: Raw data were obtained from www.oecd.org. The figure was created by the author.
Model Estimate
A semi-logarithmic growth model was created in order to calculate the long-term average growth rate of the C/L variable; this shows the relative change in capital incomes compared to labor incomes. The general form of the model is shown in Equation (7). Here, the dependent variable is the logarithmic value of C/L, while α is the constant coefficient, β is the coefficient of the time variable, and ε is the error term. In the first model, represented by Equation (8), the dependent variable represents the finance sector (LRCL_F), and the dependent variable, expressed by Equation (9), represents manufacturing industry (LRCL_M). The time variable used in the models was also employed in three different forms. The time variable represents the 1995–2019 period, the Time1 variable represents the 1995–2007 sub-period, and the Time2 variable represents the 2008–2019 sub-period. The model estimation results using the least squares method are shown in Table 1.
Regression Results of the Semi-Logarithmic Growth Model

Notes: *stands for Jarque–Bera Test Prob. Since its value is greater than 0.05, the error term has a normal distribution.
stands for Breusch–Godfrey LM Test Prob. Since the value is greater than 0.05, there is no serial correlation between the error terms.
stands for Breusch–Pagan–Godfrey Test Prob. Since its value is greater than 0.05, the error term has homoscedasticity.
According to the calculation made from OECD data 4 , when the annual rate of increase of the C/L ratio in the FIRE sector is analyzed based on the various periods, the highest average increase is seen to have come after the global crisis (1.13%). The average rate of growth for the 1995–2019 period as a whole was 0.81%. The annual average rate of change in the C/L ratio for the manufacturing industry (0.41%) also continued to increase after the global crisis. Thus, capital incomes increased more rapidly than labor incomes in both sectors after the global crisis. However, the degree of inequality between capital and labor in the years from 2008 to 2019 increased to a greater extent in the FIRE sector.
Figure 4 shows capital/labor ratios in the manufacturing and FIRE sectors between 1995 and 2007. It can be concluded that during this sub-period the capital/labor ratios in both sectors showed a positive and statistically significant trend, and that the sharing of income between capital and labor came increasingly to favor capital. When the shifts in favor of capital in the two sectors are compared, the increase can be seen to have been greater in manufacturing industry compared to the FIRE sector (FIRE: 0.87 and M: 1.80).
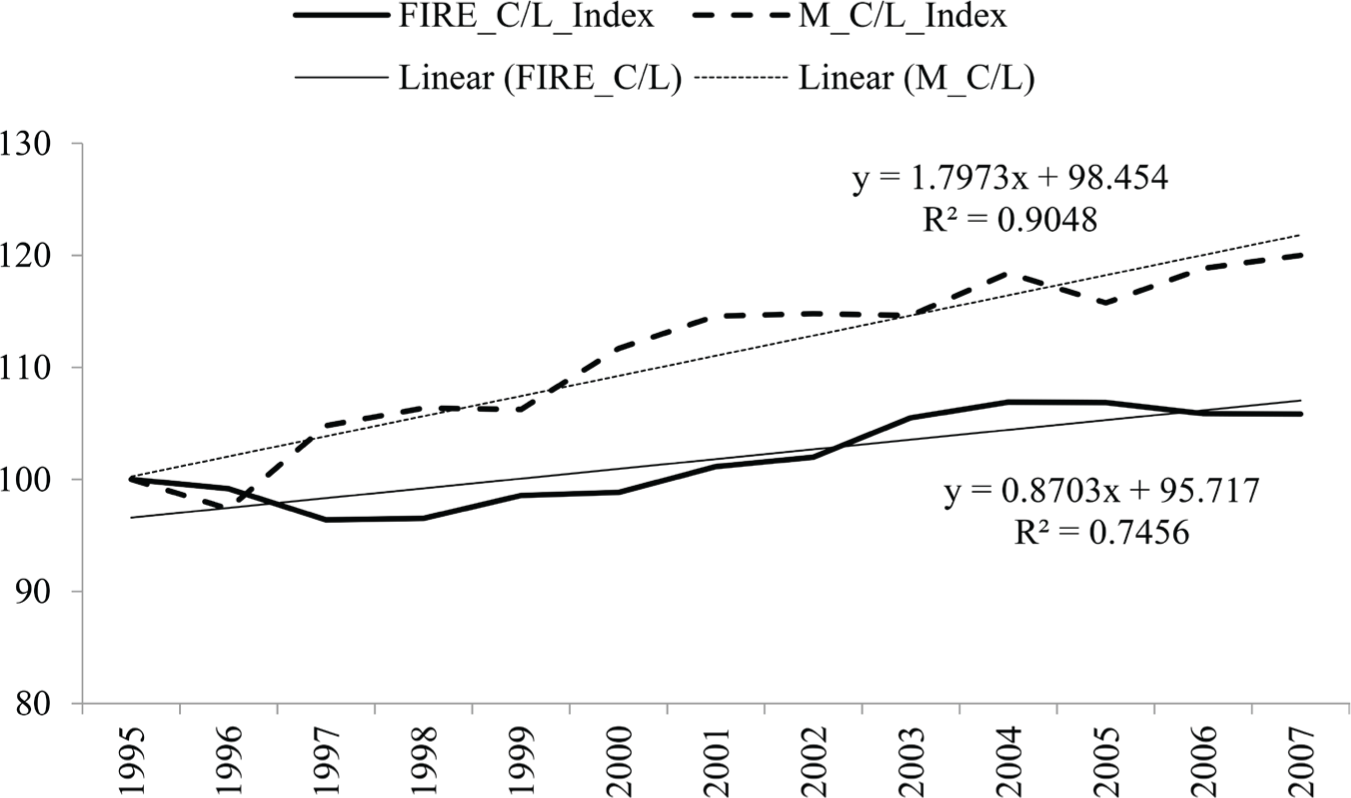
Capital/Labor Ratios in the Manufacturing and FIRE Sectors: 1995–2007 (1995 = 100)
Source: Raw data were obtained from www.oecd.org. The figure was created by the author.
The capital/labor ratios in the manufacturing and FIRE sectors between 2008 and 2019 are shown in Figure 5. In this sub-period, the relative increase in capital incomes relative to labor incomes was higher in manufacturing industry than in the FIRE sector (FIRE: 1.25 and M: 1.82).
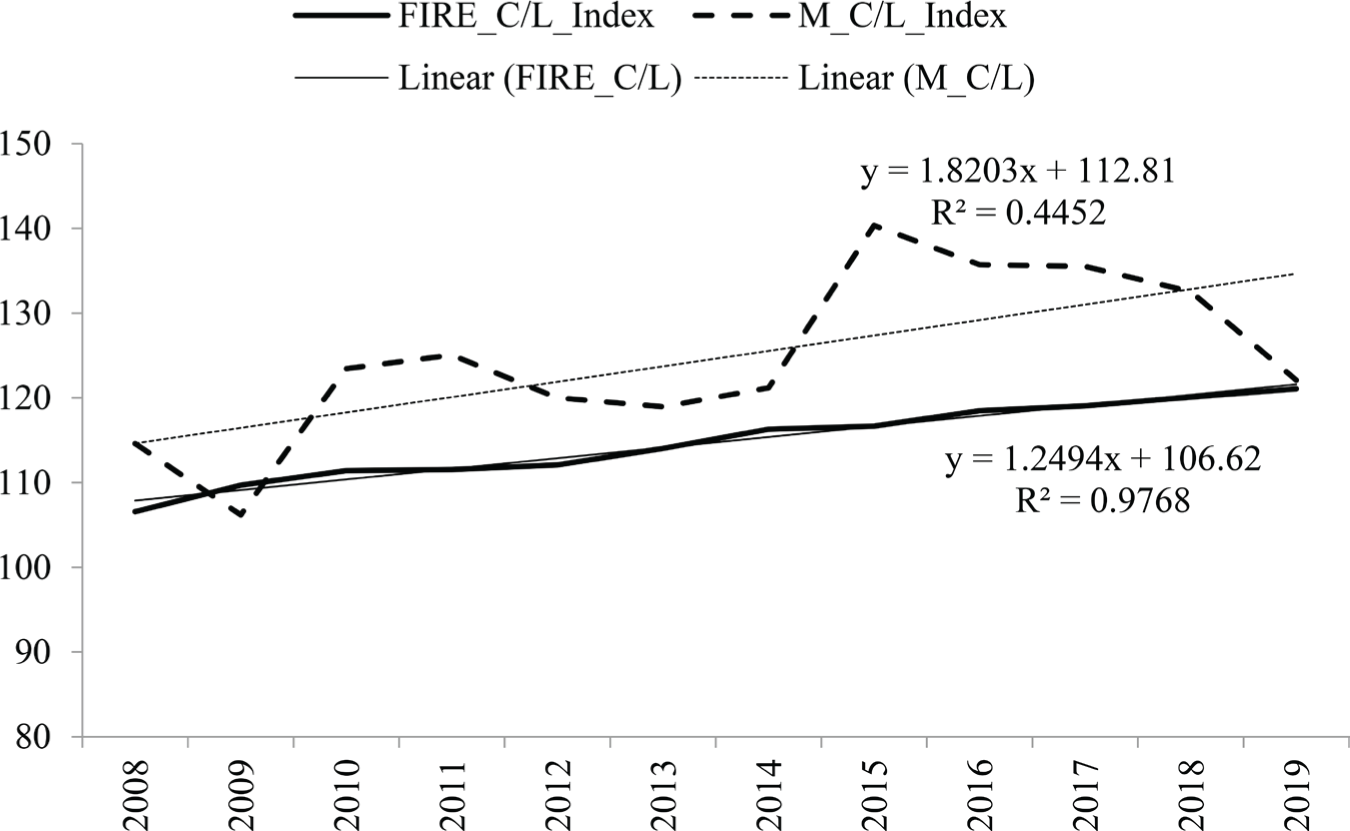
Capital/Labor Ratios in the Manufacturing and FIRE Sectors: 2008–2019 (1995 = 100)
Source: Raw data were obtained from www.oecd.org. The figure was created by the author.
During the global crisis of 2008/2009, both variables were affected, though in different fashion. While capital incomes in manufacturing industry decreased by 12.4%, in the FIRE sector it increased by 3.1%. While labor incomes in manufacturing industry declined by 4.4%, the decrease in the FIRE sector was only 0.5%. In manufacturing industry during the global crisis, the ratio of capital incomes to labor incomes grew less unfavorable to labor, declining by a factor of 11.8%. In the FIRE sector, by contrast, this ratio increased by 3.6%.
In Figure 6, the ratio of capital incomes to labor incomes by country is shown for both sectors. The thick line figure shows the C/L ratio in the FIRE sector, and the thin line figure shows the C/L ratio in manufacturing industry. An increase in this ratio indicates a relative increase in capital incomes compared to labor incomes, and a decrease indicates a shift in favor of labor. The countries where the C/L ratio in both sectors showed an increasing trend between 1995 and 2016 are AUT, BEL, CZE, DEU, ESP, FIN, FRA, HUN, ITA, and PRT, as well as the OECD. Of these, the fastest-growing were ESP, ITA, PRT, and the OECD. This ratio showed a decreasing trend between 1995 and 2016 only in Sweden. During the 2008/2009 global crisis, the ratio decreased to varying degrees in two-thirds of the 32 countries in the data set. The countries where this ratio dropped in a V shape were EST, GBR, JPN, LTU, LUX, LVD, NZL, NOR, and the USA.
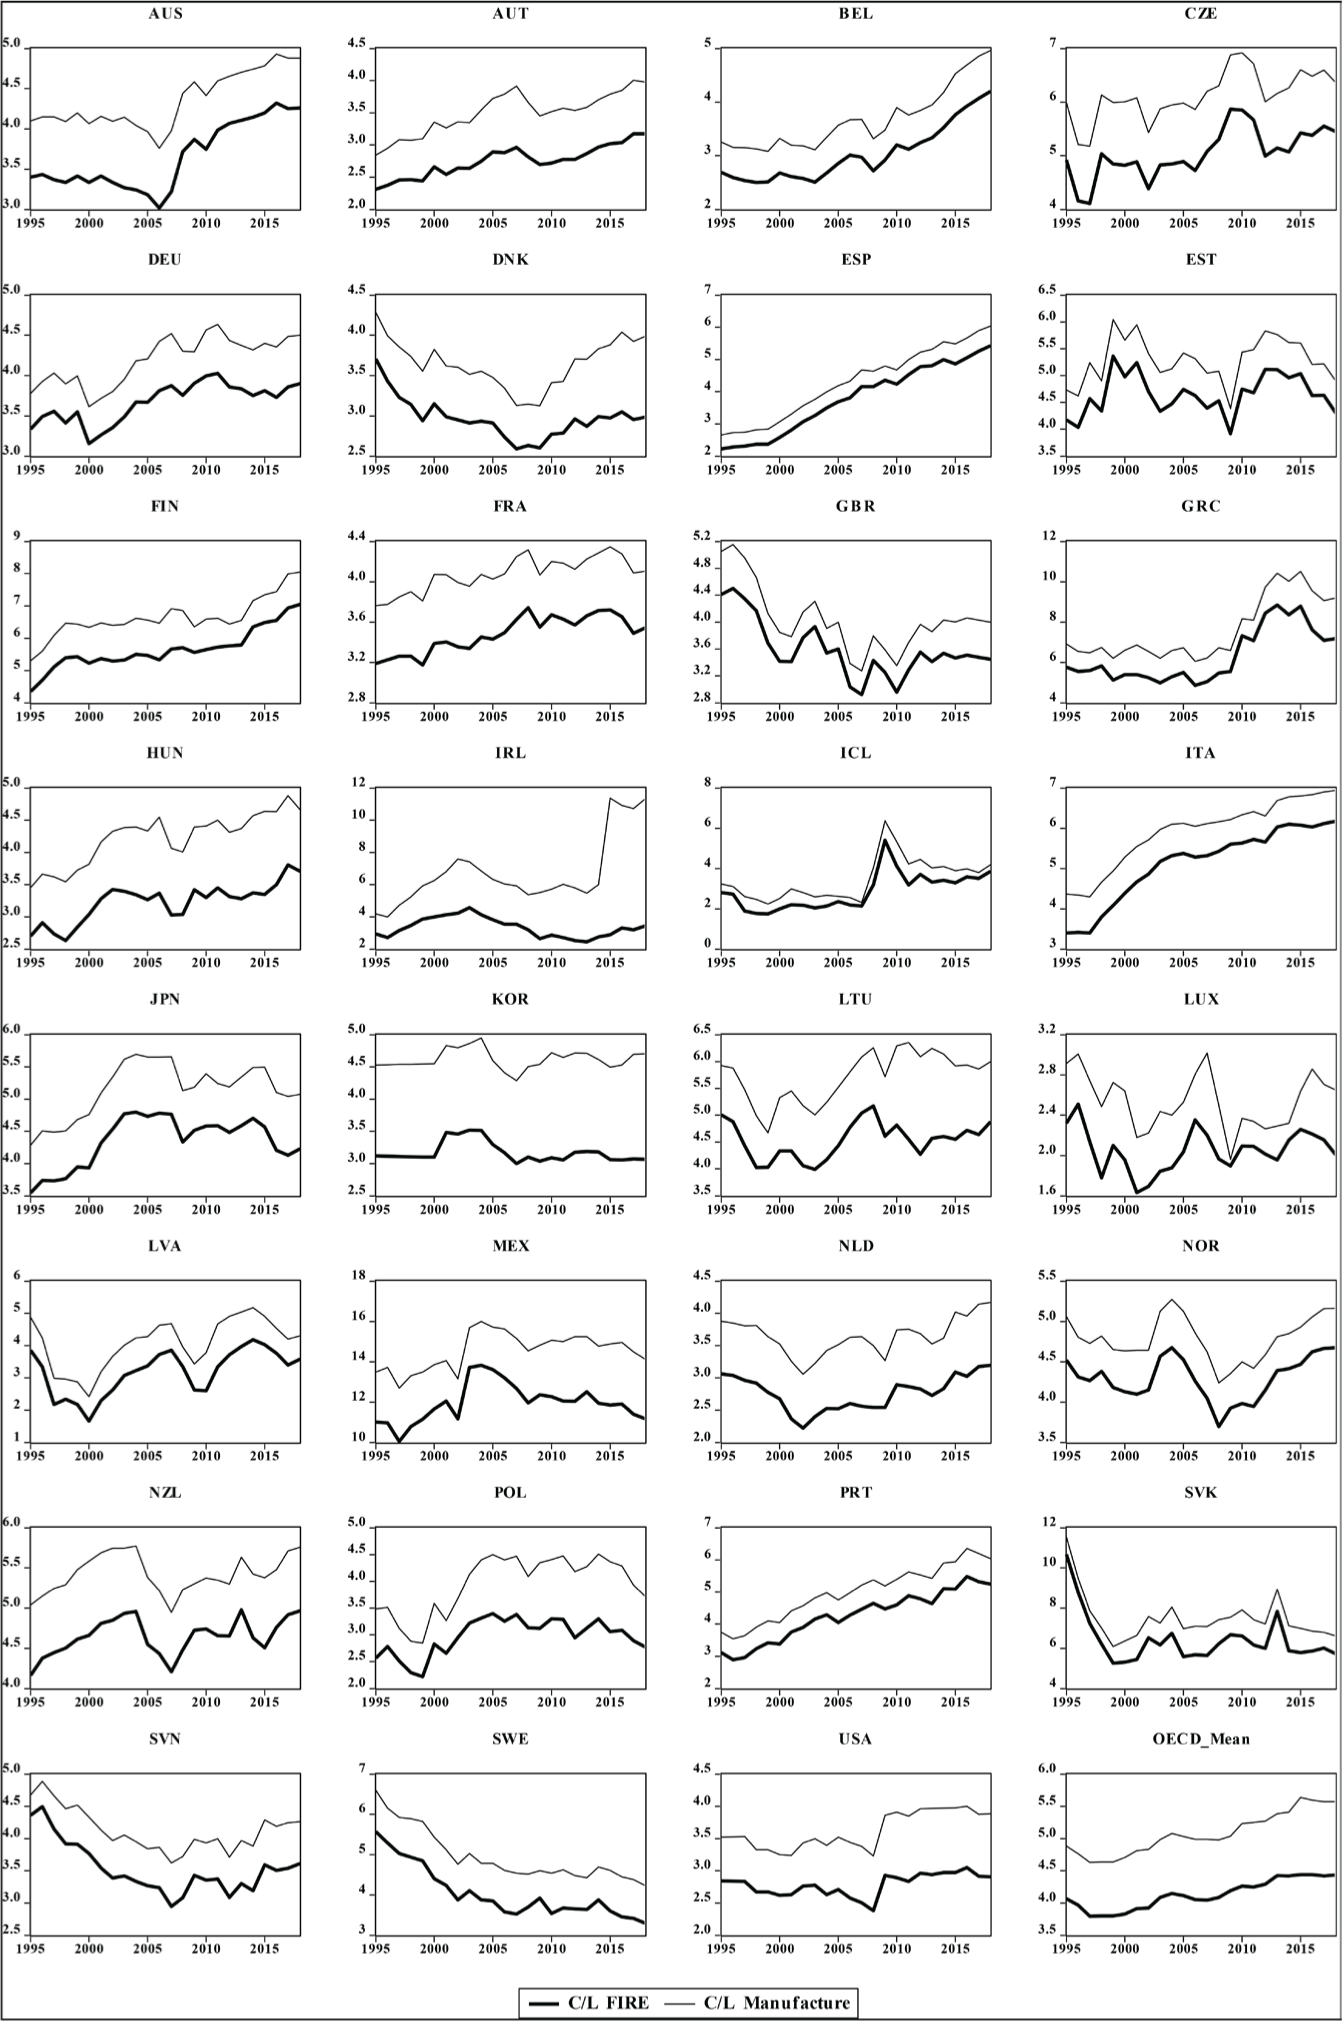
Capital/Labor Ratios (C/L) in Manufacturing and FIRE Sectors by Country
Source: Raw data were obtained from www.oecd.org. The figures were created by the author.
Periodic Percentage Change in Labor and Capital Incomes by Sectors
Since the original data are based on the countries’ national currencies, each country’s percentage change in labor from 1995–2007 was calculated. Then the OECD average of this was found. The 2007–2019 period and the 1995–2019 period are calculated similarly. Percentage changes in labor and capital incomes in sectors by periods are shown in Table 2. While labor incomes in the manufacturing industry increased by 103% in the 1995–2007 period, they only increased by 31% in the 2008–2019 sub-period after the global crisis; between 1995 and 2019, which covered the entire period, increased by 203%. Capital incomes increased by 143%, 126%, and 62%. The ratio of capital income to labor income increased by 20% in the 1995–2007 period, 18% in the 2008–2019 period, and 22% in 1995–2019. In the FIRE sector, labor incomes were 190% in the 1995–2007 period; while they increased by 30% in the 2008–2019 period and 301% in the 1995–2019 period, capital incomes increased more than labor incomes in all three periods. The percentage change of capital income in each period is 194%, 44% and 349%, respectively. The ratio of capital incomes to labor incomes (C/L) increased by 6% in 1995–2007, 13% between 2008 and 2019, and 21% in 1995–2019 in the FIRE sector. The highest labor and capital income increase was from 1995–2019. When evaluated in terms of the ratio of capital incomes to labor incomes, the fact that this ratio has increased in both sectors in three periods shows that the inequality between capital incomes and labor incomes has grown even more.
Periodic Percentage Change in Labor and Capital Incomes by Sectors

Source: Raw data were obtained from www.oecd.org. The table was drawn up from calculations by the author.
Rate of Dominance of the FIRE Sector over Manufacturing Industry
The relative change in labor incomes between these two sectors was calculated by taking labor incomes in the FIRE sector as a proportion of those in manufacturing industry. The same method was applied to capital incomes. The increase in the rate over time points once again to the dominance of the FIRE sector over manufacturing industry.
The ratio of capital incomes in the FIRE sector to capital incomes in manufacturing industry is shown in Figure 7. While this ratio was observed to increase gradually between 1995 and 2009, it decreased gradually after the global crisis. Figure 7 also shows the ratio of labor incomes in the FIRE sector to labor incomes in manufacturing industry. The chart shows that the trend in capital incomes was valid for labor incomes as well. Thus while capital and labor incomes experienced greater increases in the FIRE sector between 1995 and 2009, the ratios compared to manufacturing industry declined after the 2009 global crisis. Although the margins in these cases were smaller, the FIRE sector still remained highly favored. It can therefore be seen that in all three periods the FIRE sector was at the forefront in the areas both of labor and capital.
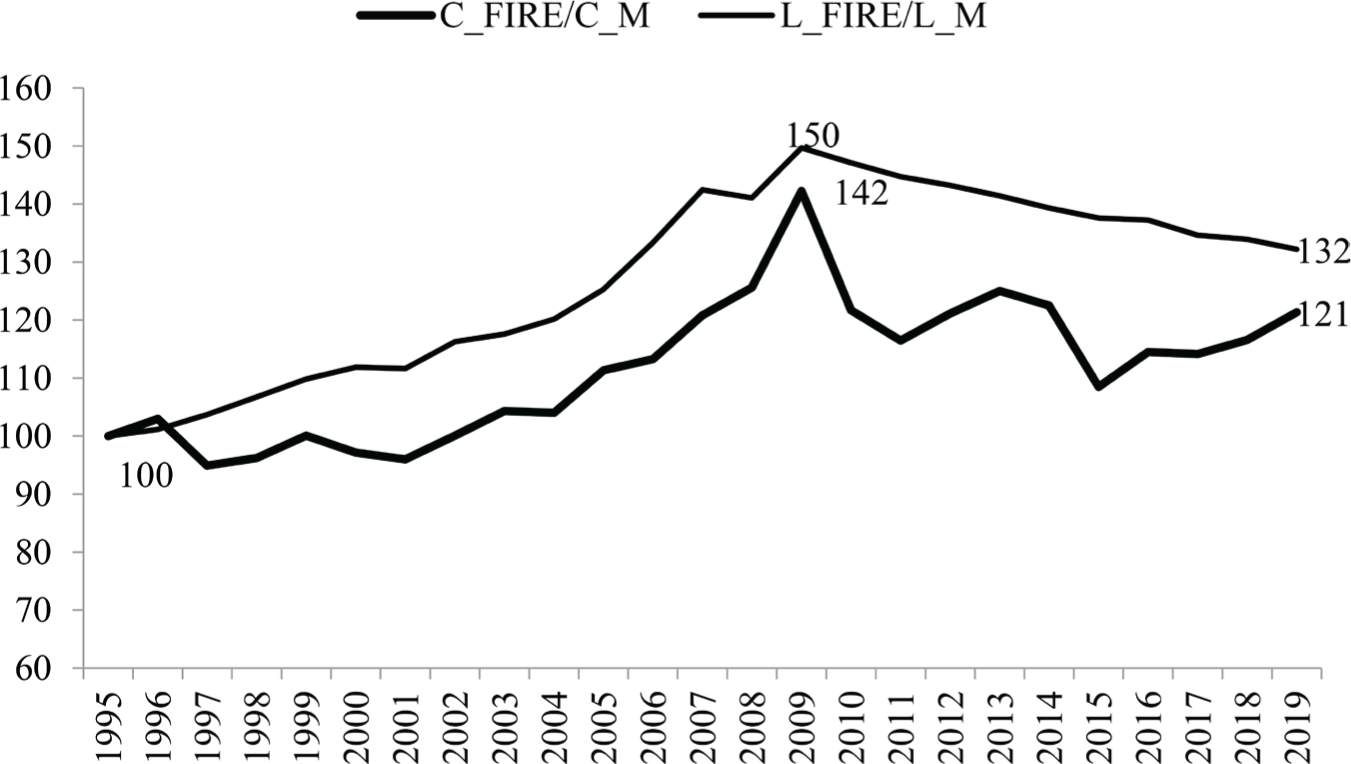
Ratio of FIRE Sector to Manufacturing Industry for Capital and Labor Revenues
Source: Raw data were obtained from www.oecd.org. The figure was created by the author.
Figure 8 shows the ratio of the FIRE sector to manufacturing industry for capital and labor incomes by country. An increase in this ratio shows that in relative terms, capital incomes in the FIRE sector experienced greater rises than in manufacturing industry. Meanwhile, a decrease in this ratio shows that capital incomes in manufacturing industry increased by a relatively greater amount. Where labor incomes are concerned, an increase in the corresponding ratio shows that labor incomes in the FIRE sector increased more than in manufacturing industry. When Figure 8 is examined, the countries where this ratio for labor and capital incomes tended to increase between 1995 and 2016 are seen to be AUS, BEL, NZL, ITA, LVA, PRT, SVK, and the USA, as well as for the OECD. Those that showed a decreasing trend were KOR, POL, SVK and DEU. The countries where the ratio concerned increased until the global crisis, and then declined, are DNK, ESP, FRA, GBR, GRC, ITA, JPN, MEX, and PRT. After the global crisis period, the ones that showed increases were LTU, ICL, LVA, NOR, and the USA. During the global crisis, this ratio formed an inverted V (funnel) image in most countries.
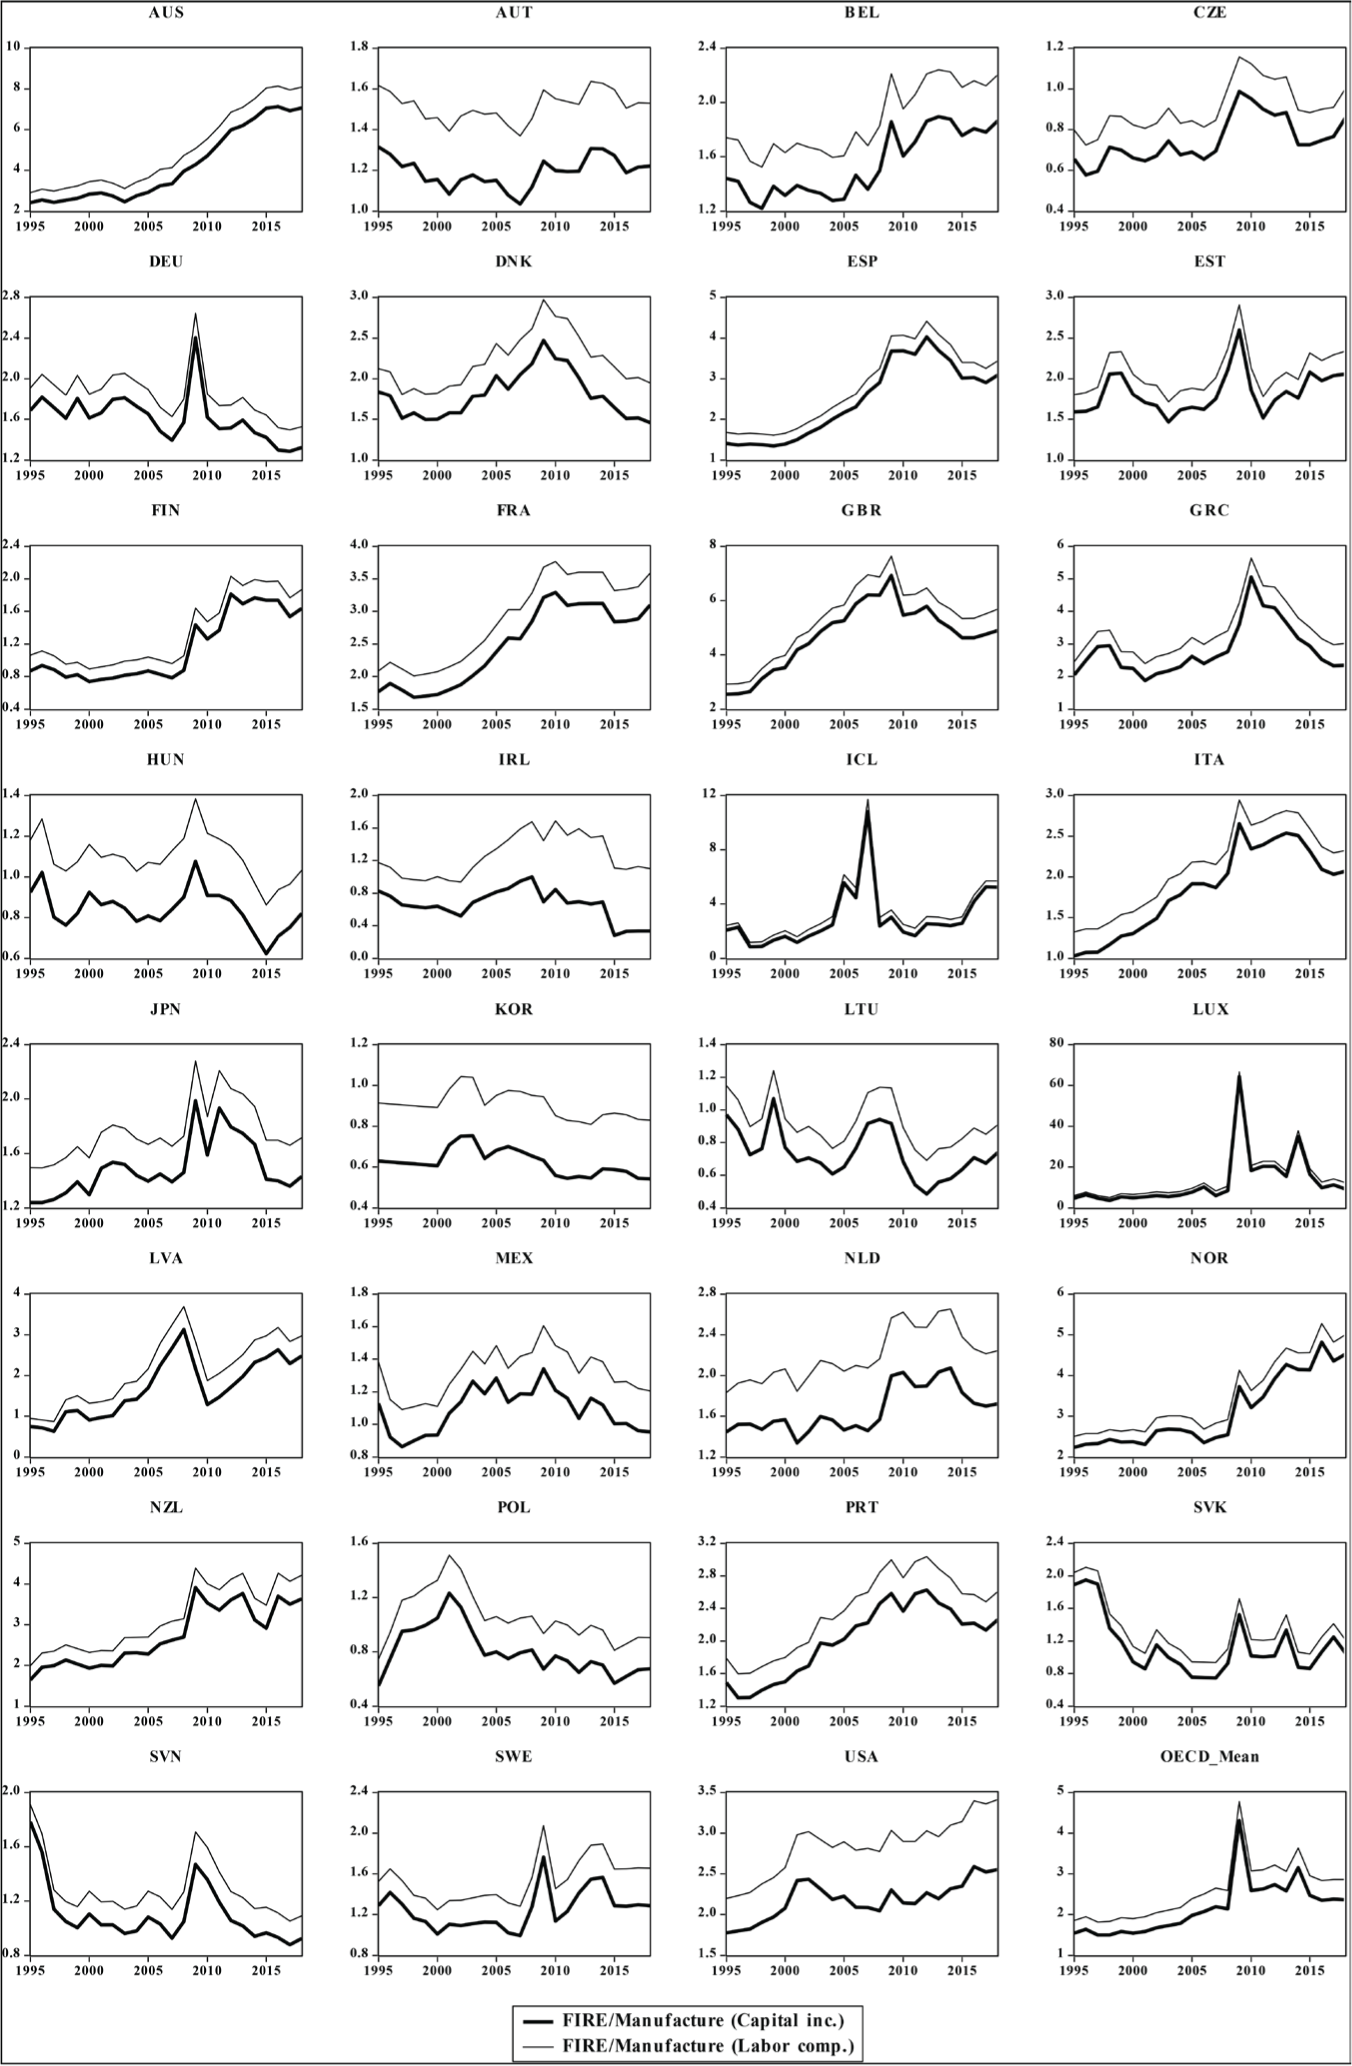
Ratio of FIRE Sector to Manufacturing Industry for Capital and Labor Revenues by Country
Source: Raw data were obtained from www.oecd.org. The figure was created by the author.
Analysis according to the Share of Labor and Capital in GVA
General Trend Analysis
The share of GVA made up of labor incomes in manufacturing industry is shown in Figure 9. Between 1995 and 2019, this ratio showed a statistically significant and negative linear trend. However, this trend was broken after the global crisis, instead turning slightly positive. Thus, the share of GVA comprised of labor incomes in manufacturing industry declined from 10.9% in 1995 to 7.94% in 2010, before increasing to 8.02% in 2019. It can be stated that the share of labor incomes in manufacturing industry decreased until the global crisis.
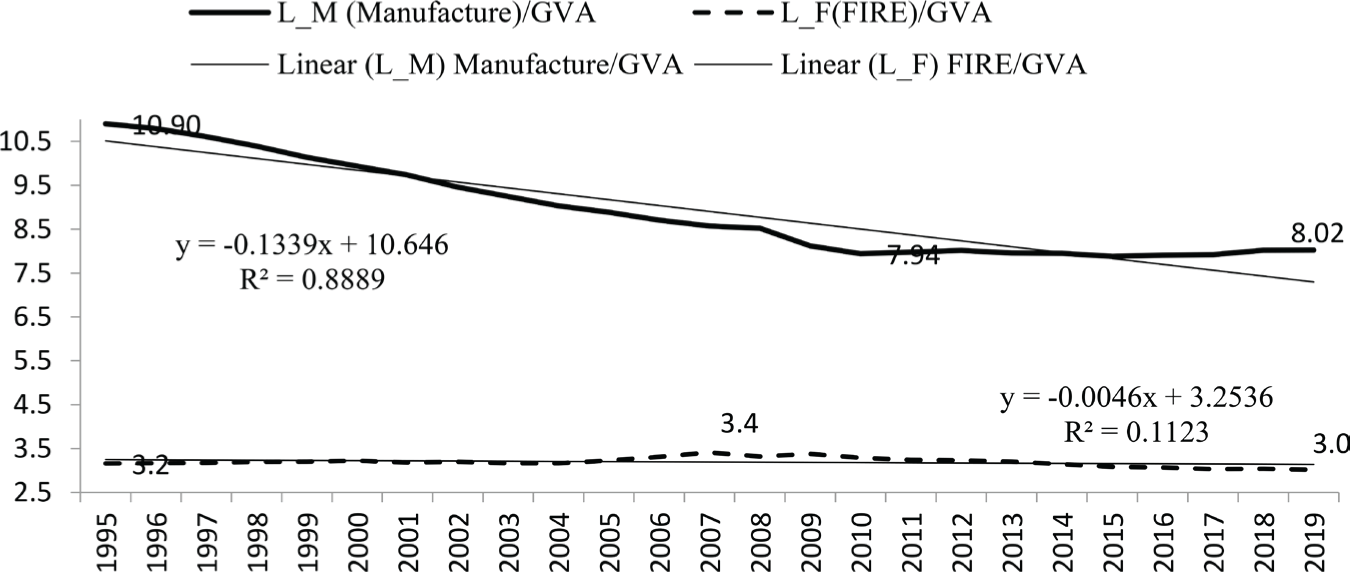
Share of Labor Revenues in Gross Value Added in Manufacturing Industry and the FIRE Sector (%)
Source: Raw data were obtained from www.oecd.org. The figure was created by the author.
The share of labor incomes in GVA for the FIRE sector is also shown in Figure 9. There is no statistically significant linear trend between 1995 and 2019 in the FIRE sector. Therefore, the situations before and after the global crisis are entirely different. It can be mentioned that there was a positive linear trend between 1995–2007 and a negative linear trend between 2008–2019. While the share of labor incomes in GVA in the FIRE sector in 1995 was 3.2%, it increased to 3.4% in 2007 and decreased to 3.0% in 2019. The increase in the relative importance of the FIRE sector between 1995 and 2007, when financialization accelerated, had a positive impact on both labor and capital incomes.
The share of capital incomes in GVA for the FIRE sector is shown in Figure 10. Between 1995 and 2019, this ratio had a statistically significant and positive linear trend. While this rate was 11.36% in 1995, it reached its highest level at 12.37% during the global crisis in 2009. Afterward, it decreased slightly and was 12.17% in 2019.
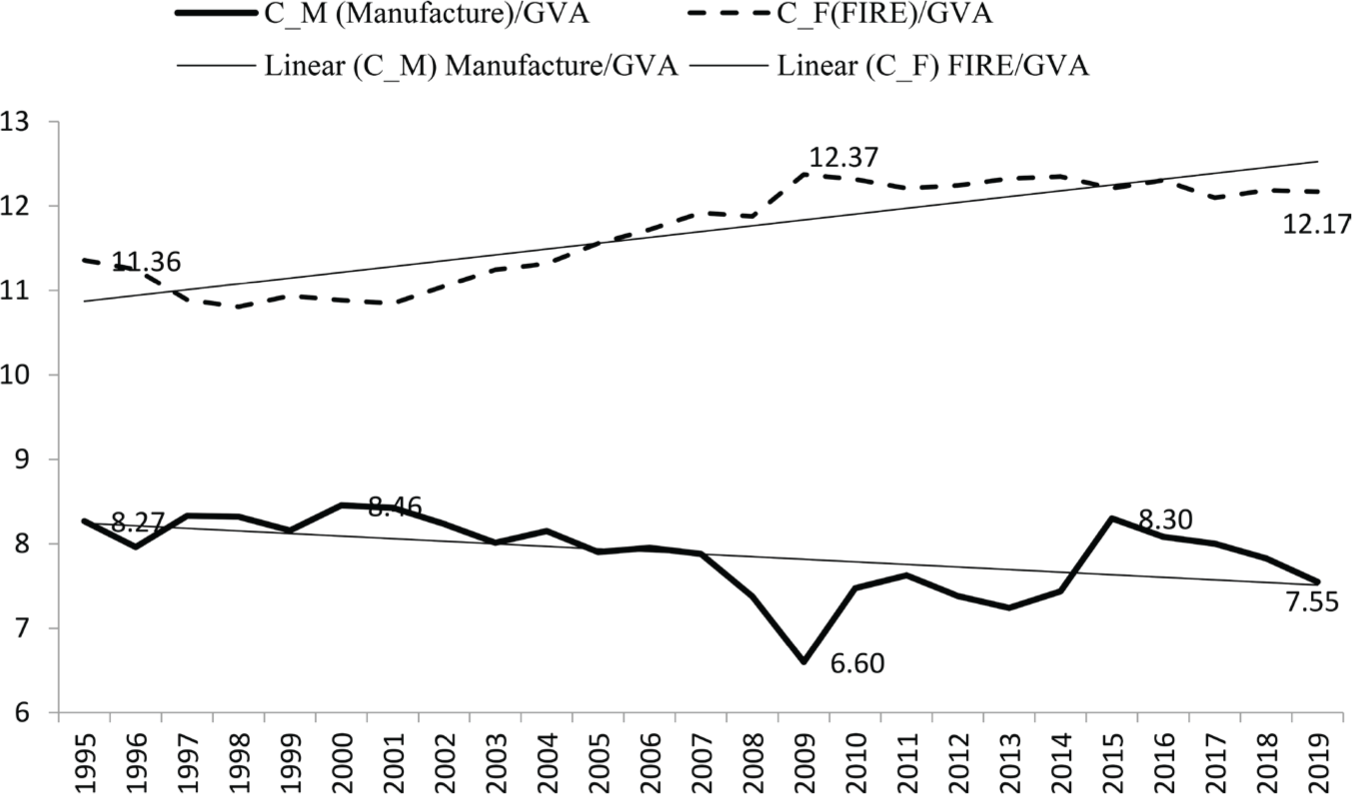
Share of Capital Revenues in Gross Value Added in Manufacturing Industry and the FIRE Sector (%)
Source: Raw data were obtained from www.oecd.org. The figure was created by the author.
Figure 10 also shows the share of GVA for capital incomes in manufacturing industry. Although this rate had a negative linear trend between 1995 and 2019, it was not statistically significant. In 1995, the share of labor incomes in GVA had been 8.27%; thereafter, it increased to 8.46% in 2000, before decreasing continuously to 6.6% in 2009. After again rising in the aftermath of the global crisis and reaching 8.30% in 2015, it showed a renewed downward trend. In 2019 it was 7.55%.
Periodic Percentage Change of the Share of Labor and Capital Incomes in GVA by Sectors
In Table 3, periodic percentage changes in the share of labor and capital incomes in GVA in the manufacturing and FIRE sectors are shown. While the share of labor incomes in GVA decreased by 21.4% in the sub-period of 1995–2007 in the manufacturing industry, it decreased by 5.9% in 2008–2019 and 26.4% in 1995–2019. However, the changes in the share of capital incomes were −4.7%, 2.3%, and −8.7%, respectively. While the ratio of the share of capital to the labor share increased by 20% between 1995–2007, it increased by 6.6% between 2008–2019 and by 22.1% in the period 1995–2019. The labor share in the FIRE sector increased by 1.1%, 0.9%, and 1.0%, respectively. The share of the capital increased by 4.9%, 2.5%, and 7.2%, respectively. While the ratio of the share of capital to the labor share increased by 5.8% between 1995–2007, it increased by 13.6% between 2008–2019 and by 21.1% in the period 1995–2019. It is observed that the share of capital in gross value added has increased significantly compared to labor. In the 1995–2019 period, the share of both labor income and capital income increased in the FIRE sector at a higher rate than in manufacturing. While the maximum periodical increase in the share of labor incomes was between 1995 and 2007, the maximum sectoral increase occurred in FIRE. Considering the sub-period after the global crisis, while the share of labor incomes in the manufacturing industry decreased, the share of capital incomes increased. While the share of both labor and capital incomes increased in the FIRE sector, the share of capital incomes increased relatively more.
Periodic Percentage Change of the Share of Labor and Capital Incomes in GVA by Sectors

Source: Raw data were obtained from www.oecd.org. The table was drawn up from calculations by the author.
Analyses according to the Annual Percentage Change of Variables
Annual Percentage Changes of Labor and Capital Revenues in the Manufacturing Industry and FIRE Sector
Figure 11 charts the annual percentage changes in labor and capital incomes in the manufacturing industry between 1995 and 2019. During the global crisis in 2009, a radical decrease occurred in both labor and capital incomes. That year, labor incomes in manufacturing industry fell by 9.6%, and capital incomes by 13.6%.
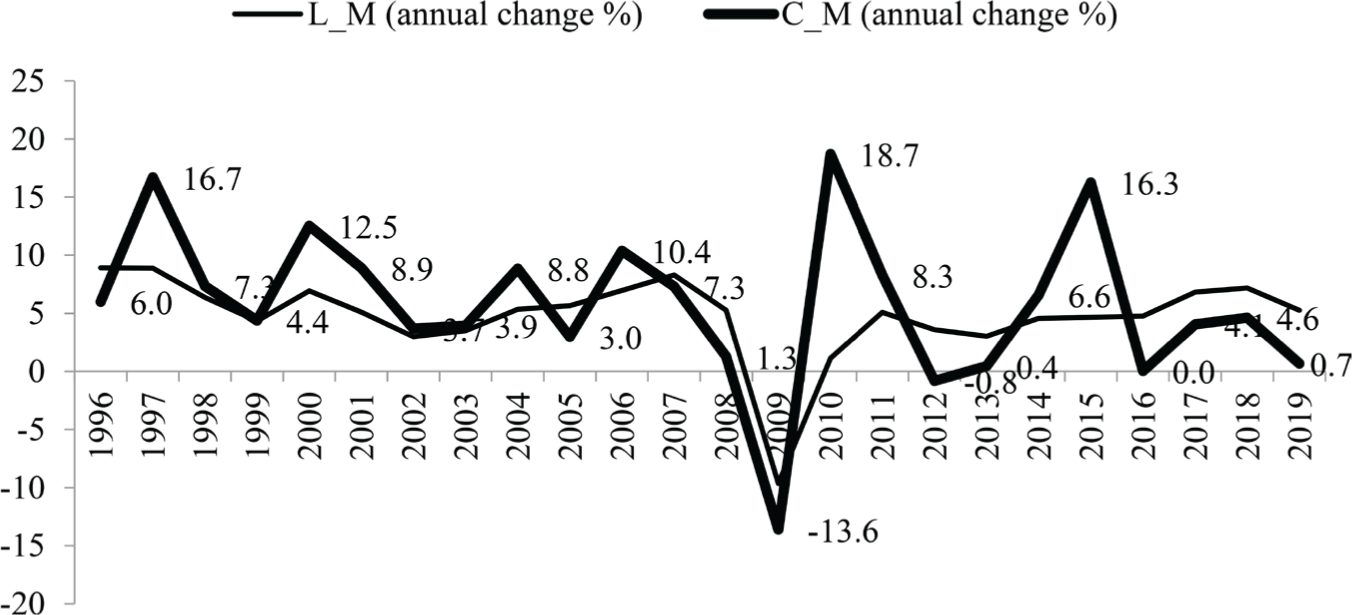
Annual Percentage Changes of Labor and Capital Incomes: The Manufacturing Sector
Source: Raw data were obtained from www.oecd.org. The figure was created by the author.
Figure 12 shows annual percentage changes in labor and capital incomes in the FIRE sector between 1995 and 2019. While labor incomes decreased in 2009 by 4.1%, capital incomes fell by 2.1%.
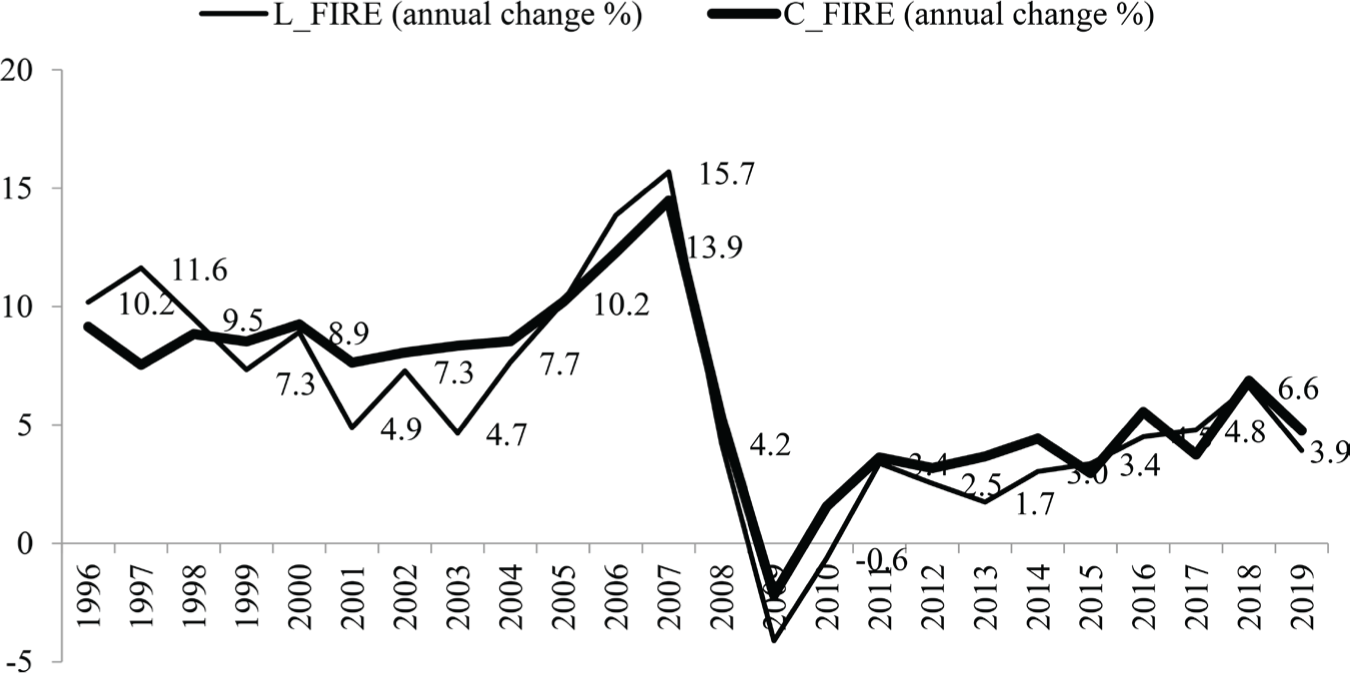
Annual Percentage Changes of Labor and Capital Incomes: The FIRE Sector
Source: Raw data were obtained from www.oecd.org. The figure was created by the author.
Table 4 shows the annual average increases in labor and capital incomes in each sector during the various periods. It can be seen that capital incomes increased more than labor incomes in both sectors over the three periods. Although the rates of increase were different, the incomes of both labor and capital grew most rapidly between 1995 and 2007 in both sectors, while the increases during the sub-period after the global crisis were less marked. Between 1995 and 2019, labor incomes in manufacturing industry increased by an annual average of 4.8%. This rate was at its highest (6.1%) between 1995 and 2007. During and after the global crisis, this average rate declined to 3.5%. Labor incomes in the FIRE sector grew at an average annual rate of 9.3% between 1995 and 2007, with this figure slowing to 2.8% in the post-crisis period. For the whole period between 1995 and 2019, the annual average increase was 6.0%. While capital incomes in manufacturing industry increased at a rate of 7.8% between 1995 and 2007, average growth after the global crisis fell to 3.9%. Between 1995 and 2019, the annual average increase was 5.8%. Capital incomes in the FIRE sector also saw their strongest growth between 1995 and 2007, with an average rate of 9.4%. In the sub-period after the global crisis, this figure declined to 3.6%. Over the whole period from 1995 to 2019, the annual average increase was 6.5%.
Average Percentage Changes and Cumulative Changes

Source: Raw data were obtained from www.oecd.org. The table was drawn up from calculations by the author.
When the cumulative increases in labor and capital incomes in Table 4 are compared across the various periods, the following conclusions may be drawn. In all three periods, capital incomes in both the manufacturing and FIRE sectors clearly increased more than labor incomes. The income inequality between classes deepened.
While the cumulative sum of the annual percentage changes in labor incomes in the field of manufacturing industry was 73.3 between 1995 and 2007, this total decreased to 41.8 in the sub-period after the global crisis. Between 1995 and 2019, it was 115.1. The cumulative increases in labor incomes in the FIRE sector were, in order, 111.7, 33.4, and 145.1. The growth rates of labor incomes in both sectors declined significantly in the post-crisis sub-period compared to the previous sub-period. The trend for capital incomes was similar. When the cumulative increases in labor and capital incomes are compared, capital incomes can be seen to have increased more than labor incomes in both sectors over all three periods. While between 1995 and 2007 both labor and capital incomes increased more in the FIRE sector than in manufacturing industry, in the 2008–2019 sub-period, by contrast, the increase in manufacturing industry was higher than in the FIRE sector.
Annual Percentage Changes of the Share in GVA by Periods
Table 5 shows the average annual percentage changes of labor and capital incomes in GVA by sub-periods and sectors. Between 1995 and 2007, there was a decline in the share of GVA contributed by labor and capital incomes in manufacturing industry. However, the decrease in the figure for labor incomes is more significant than that for capital incomes. Between 2008 and 2019, the share made up by capital incomes decreased by an annual average of 0.1%, while the corresponding figure for labor incomes decreased by 0.5%. Between 1995 and 2019, the yearly average decrease in the share of labor incomes was 1.3%, while the decrease in the share of capital incomes was 3.5%. In the FIRE sector, between 1995 and 2019, the share of labor incomes in GVA decreased by an average of 0.2% annually, while the share of capital incomes increased by 0.3%. As this table shows, only capital revenues in the FIRE sector recorded a positive annual average annual change in GVA shares over the entire period.
Annual Percentage Change in Average Share of GVA by Periods

Source: Raw data were obtained from www.oecd.org. The table was drawn up from calculations by the author.
General Evaluation and Conclusion
The main questions that this article sought to answer were how labor and capital incomes changed relatively in OECD countries between 1995 and 2019, and what the reflections of these changes were in manufacturing industry and the finance sector. Due to the 2008/2009 global crisis that was experienced during the study period, this period was further analyzed by dividing it into two sub-periods, and the above questions were also answered in relation to the pre-crisis and crisis/post-crisis years. In addition, the study followed the development of the shares of labor and capital incomes in GVA over the various timeframes. Long-term trend analyses were performed, and the relative changes in the values at the beginning and end of various periods were compared. The annual percentage changes in labor and capital incomes were compared, as were the cumulative changes at the end of each period.
One of the concepts that left its mark on the decades examined was financialization, thought to be among the reasons for the differentiation in labor and capital incomes. To make a definite judgment on this issue, however, the relationship between indices representing financialization and labor income would need to be tested econometrically.
In manufacturing industry, the share of labor incomes in GVA decreased from 10.9% in 1995 to 7.9% in 2010. By 2019 it had increased to 8.0%. It can be said that the share attributable to labor incomes in manufacturing industry decreased during the financialization period until the global crisis. While the labor income share in GVA in the FIRE sector was 3.2% in 1995, it rose to 3.4% in 2007 and decreased again to 3.0% in 2019. The relative importance of the FIRE sector between 1995 and 2007, when financialization accelerated, had a positive impact on both labor incomes and capital incomes. In the manufacturing industry, the share of labor incomes in GVA decreased by 21.4% in the 1995–2007 sub-period and by 5.9% in the 2008–2019 sub-period. In the 1995–2019 period, it decreased by 26.4%. The share of labor incomes in the FIRE sector increased by 1.1%, 0.9%, and 1%, respectively. Therefore, while the labor income share decreased in the manufacturing sector, it increased slightly in the FIRE sector.
In the manufacturing industry, the share of capital incomes in GVA decreased by 4.7% in the sub-period of 1995–2007, increased by 2.3% in the sub-period of 2008–2019, and decreased by 8.7% in the 1995–2019 period. In the FIRE sector, the share of capital incomes in GVA increased by 4.9%, 2.5%, and 7.2%, respectively. When the share of capital incomes in GVA is compared by sector, the increase in the FIRE sector is higher. In the sub-period after the global crisis, it is possible to say that the share of capital incomes in both manufacturing and FIRE sectors increased more than the share of labor incomes, and the class inequality between labor and capital increased even more.
When the increases in capital and labor incomes in the FIRE sector and manufacturing industry are compared, the FIRE sector can be seen to have outstripped manufacturing industry, an outcome that accords well with the financialization theory. It may be surmised that it was as a result of financialization, assumed to have increased from the 1990s, that the financial sector grew well, capital accumulation increased, and that the relative increases in the number of employees and in employee incomes were high. However, this trend changed with the 2008/2009 global crisis. Labor and capital incomes in both sectors were affected by the crisis, albeit to differing extents. During the crisis years of 2008 and 2009, while capital incomes in manufacturing industry declined by 12.4%, they increased by 3.1% in the FIRE sector. While labor incomes in manufacturing industry decreased by 4.4%, this rate declined by only 0.5% in the FIRE sector. The ratio of capital incomes to labor incomes in manufacturing industry shifted by 11.8% in favor of labor during the global crisis, but in the FIRE sector this ratio moved in the opposite direction, favoring capital by 3.6%. During the global crisis, therefore, the loss of capital incomes in manufacturing industry was higher than that of labor incomes. In the FIRE sector, by contrast, the loss of labor income was higher. In the sub-period following the global crisis, class inequality could be seen to have increased relatively more in manufacturing industry than in the FIRE sector.
When the period from 1995 to 2019 is considered as a whole, it is evident that capital incomes increased more than labor incomes both in manufacturing industry and in the finance sector. Thus, it can be said that income inequality between labor and capital grew during this period. Analyzing data for 151 countries, both developing and developed, for the years from 1970 to 2015, Guerriero (2019, 9–28) concluded that the share of labor incomes had been on a continuous downward trend, especially since 1980. This result parallels the findings of our study.
When manufacturing industry and the FIRE sector are compared, it is clear that between 1995 and 2019 manufacturing industry saw a greater shift of class inequality in favor of capital. It is believed that as the non-financial sector has become increasingly financialized, a rise in capital incomes obtained from financial market dealings, quite apart from operating profits, has helped guarantee that inequality would grow. In addition, the ending of strong trade union influence in manufacturing industry, as the proportion of union members among total employees has declined (Western 1995, 180–186), has ensured that the share of wage incomes obtained through collective agreements remains relatively low.
When the relative changes in capital incomes and labor incomes were compared on a country basis, the following results were obtained. While the C/L ratio in 11 of the 32 countries included in the study showed a clear upward trend in both sectors, a downward trend was observed only in Sweden. In the remaining countries, a clear trend for the entire period could not be determined. The countries with the highest increase in C/L ratios in both sectors were ESP, ITA, and PRT, along with the OECD average. During the global crisis, the C/L ratio decreased in most countries, albeit at different rates. The countries where this ratio declined until the global crisis and increased afterwards were AUS, DNK, GBR, NOR, and SVN.
When compared in terms of FIRE/manufacturing industry ratios for capital and labor incomes, the countries showing a clear upward trend in the FIRE sector were AUS, BEL, NZL, ITA, LVA, PRT, and the USA, along with the OECD average. The countries where this ratio developed in favor of manufacturing industry were KOR, POL, SVK, SVN, and DEU. During and after the global crisis, countries implemented fiscal policies, central bank monetary policies, and policies aimed at protecting the financial sector and financial markets. Interest rates were radically lowered, credit taps were opened, and liquidity was provided to the financial sector through purchases of securities. The results included high earnings in stock markets, and growing profits for financial institutions in sum, increased capital incomes.
The economic and social policies followed, that have given priority to protecting the financial sector rather than manufacturing, have accelerated financialization and caused a relative decline in the whole real sector, especially in the case of agriculture. The supply shortages experienced, when combined with the higher demand resulting from monetary expansion, have now caused a severe problem of inflation. Climate change, more frequent and severe natural disasters such as droughts, and increasingly insecure agricultural supply are making the problems more serious and permanent. In addition, falling real wages as a result of protecting the interests of capital against those of labor, more unequal income distribution, rapidly increasing poverty, the growing incidence of hunger, increased global migration, serious refugee problems, and the economic and social difficulties specific to the pandemic period have caused extreme social tensions in countries both of the center and periphery.
Like the accumulation of energy before a powerful earthquake, the stresses are building up. When this discharge of energy begins, it will result in social changes that cannot be predicted either in terms of their rate of spread, or of the eventual outcomes. All individuals, institutions, and states need to recognize the dangers, especially the problem of hunger, and to implement effective policies before it is too late. The approaches that reduce economic policies to the interest rates set by central banks, or that focus solely on preventing stock-market losses, should be abandoned. The policies implemented should not be those that prioritize the interests of tiny capital groups, but those that increase the economic and social gains of large masses of the population, and that encourage fairness and participation in production and sharing. Poverty can be eliminated, and income distribution made more equitable. The obstacles impeding genuine trade union organization that protects the rights and interests of employees, and that can use its collective power for this purpose, should be removed. Policies and mechanisms that allow farmers easy access to inputs and resources, that support producers’ cooperatives and eliminate the intermediaries between producers and consumers, should be implemented without delay. Product supply chains should be constructed that are more transparent and can be tracked through digital environments, and agricultural production incentives and economic support should be increased.


