Introduction
In recent years, inflation in Cuba has reached levels that have considerably reduced the purchasing power of the population’s income, especially those households that depend on salaries and pensions in Cuban pesos (CUP). At present, there are multiple factors that exert a strong influence on the development of the inflationary process in Cuba, which greatly complicates the challenge that price stability represents.
This article analyzes the inflationary phenomenon in Cuba, focusing on the behavior of the main economic variables that have played the role of the nominal anchor 1 of monetary policy. Due to the lack of policy instruments and the characteristics of the Cuban monetary and financial environment, price stability in the sector of the population 2 has depended considerably on the authority’s ability to effectively control and manage the behavior of three fundamental nominal variables: the formal exchange rate, the money supply, and the prices administered in the state retail network.
The analysis carried out is divided into two parts. In the first, the use of the main nominal anchors in the macroeconomic stabilization carried out in the period 1990–2010 is evaluated. In the second, the factors that explain the loss of the main nominal anchors in the period of 2011–2022 are examined.
Use of the main nominal anchors in the stabilization of prices in the period 1990–2010
The period analyzed in this section begins with the deep economic recession (known as the “Special Period”) that occurred as a consequence of the fall of the socialist camp and the tightening of the economic blockade of the United States. The enormous magnitude of this economic crisis led to the implementation of a broad set of structural measures 3 aimed at macroeconomic stabilization in the short term and the promotion of a process of sustainable economic growth in the long term. As a result, a series of transformations took place in this period that gave new features to the Cuban monetary and financial environment 4 and implied a change in the way of conducting monetary policy in Cuba.
It is in this context of profound economic transformations that a stabilization program was launched, 5 known as the “domestic finance recovery program,” with the aim of correcting the macroeconomic imbalances generated. This stabilization program can be characterized as being a heterodox approach, since it was based on the control of multiple nominal variables to achieve price stabilization in the Cuban economy. 6
Given the peculiarities of the Cuban monetary and financial environment, only the sector of the population is taken into account for the analysis of these nominal anchors. In practice, all prices in the state sector were administratively regulated. 7 The dangers of unadministered price growth therefore only existed in the sector of the population, where these could vary based on an imbalance between supply and demand (Lage and González 2015). It was in the sector of the population where the functioning of the transmission mechanisms 8 made it possible for variations in these nominal variables to affect the price level.
Therefore, to evaluate the use of the main nominal anchors in the period under study, it is convenient to analyze the markets that the population attended and the formation of prices in those markets. On the one hand, the population was supplied in the formal market, which was made up of all the goods and services that were sold in the purely state retail network, 9 where prices were set administratively under a scheme that was distinguished by the major application of subsidies for the network of regulated products (Hidalgo and León 2015). On the other hand, the population was also supplied in the agricultural market, 10 and in the informal market. 11 In the network of capped agricultural markets that were subordinated to the Ministry of Agriculture (MINAGRI), the state established and set a maximum price for all products (García 2009). Likewise, in the network of uncapped agricultural markets that were subordinated to the Ministry of Domestic Trade (MINCIN), and in the informal market, prices were formed taking into account the conditions of supply and demand.
In this way, inflation in Cuban pesos in the population sector is made up of two indices that reflect the behavior of prices in these three markets. The formalization of this relationship is carried out in Hidalgo and Pérez (2010) through Equation 1.
In this expression, the superscript P refers to the inflation registered in the markets that operate with Cuban pesos. Likewise, the superscripts F and AI indicate the trajectory of prices in the formal and agro-informal markets, respectively. The parameters ρ1 and ρ2 indicate the structure of consumption in the two markets.
However, the main variables that operated as a nominal anchor in the population sector from the reform process started in the 1990s in Cuba are the following:
CADECA’s nominal exchange rate. 12
The money supply in the sector of the population, which is collected in the monetary aggregate M2A.
Prices regulated by the state in the state retail network in Cuban pesos.
Thus, monetary policy had three main nominal anchors to influence the general level of prices in the population sector, as shown in Diagram 1.
The nominal exchange rate of CADECA, the money supply in the population, and the regulated prices in the state retail network influenced the general price level indirectly through the trajectory of the prices in the agro-informal markets (πt AI), whereas only the regulated prices influenced the general price level directly.
Using the Exchange Rate as a Nominal Anchor
The main features of the Cuban monetary and financial environment shaped the unique transmission mechanisms through which the CADECA exchange rate exerted its influence on prices in the analyzed period, specifically in the population’s monetary circuit. The two essential characteristics of the monetary environment that allow us to understand the operation of these transmission mechanisms in Cuba are the high degree of market segmentation 13 and the dual currency (Pérez, Hernández and Hidalgo 2003). In Pérez et al. (2003) and in Hernández, Chuairey, and Rosales (2004) the different channels through which the exchange rate transmitted its effects on the price level in the monetary circuit of the population are analyzed, which are reflected in Diagram 2.
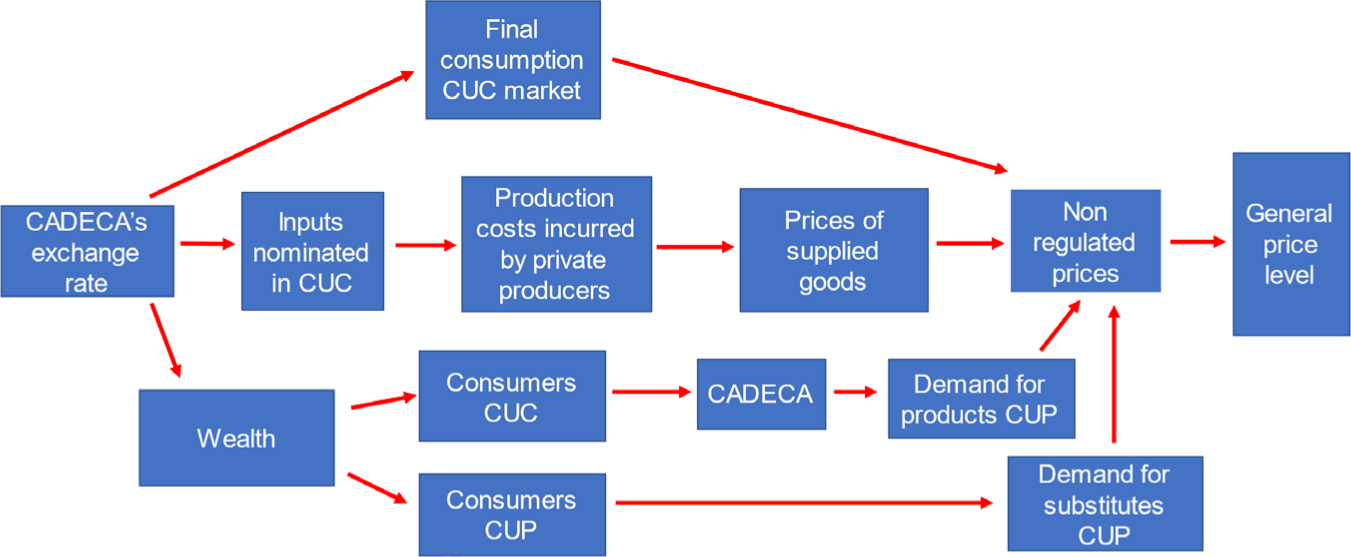
Formal exchange rate transmission mechanisms
Source: Own Elaboration based on Perez et al. (2003) and Hernandez et al. (2004).
As stated by Hernández et al. (2004), the fluctuations in the exchange rate faced by the sector of the population could modify the price levels of three economic agents clearly differentiated by the context in which they operated. These agents were private producers, consumers who received most of their income in convertible pesos (or foreign currency), and consumers who received most of their income in Cuban pesos.
When there was a devaluation in the exchange rate in the Cuban economy with which CADECA operated, in theory an inflationary process could be triggered in the population’s consumption market through different channels: 14
A proportion of the families’ consumption basket necessarily had to be purchased on the market in CUC, since market segmentation reduced the elasticity of demand for some products. In this way, an increase in the exchange rate automatically made all products on the market in convertible pesos more expensive, which translated into an increase in unregulated prices and, as a result, an increase in the general price level.
Private producers faced costs denominated both in Cuban pesos and in convertible pesos for the sale of their products, so a devaluation made those inputs in convertible pesos more expensive.
In response to the increase in production costs, private producers increased the prices of the products they offered to avoid reducing their profit margin. The magnitude of the transfer of the increase in their production costs to prices depended on the weight represented by the inputs in convertible pesos in their total costs and the structure of the market they supplied. 15 If the prices of the supplied goods increased, then the non-regulated prices increased and, as a consequence, the general price level.
A devaluation of the exchange rate increased the wealth (expressed in CUP) of consumers who received most of their income in foreign currency, who could buy CUP at exchange houses to participate in the market in that currency. Consequently, these agents had greater incentives to consume a greater quantity of products in this market, so the demand for goods in CUP should increase and, therefore, non-regulated prices and the general price level.
On the other hand, a devaluation of the exchange rate decreased the wealth (expressed in CUC) of consumers who received most of their income in national currency, who could buy the CUC needed to guarantee their participation in the market in that currency. In this way, these agents had incentives to reduce their demand for products in CUC, by finding other similar products (substitutes) in the market in CUP. Therefore, the demand for goods in the CUP market could also increase and, as a result, provoke an increase in non-regulated prices and in the general price level.
The analysis of these mechanisms allows us to understand how a devaluation of the official exchange rate of the population could affect inflation in the macroeconomic environment of this period and, therefore, how the fixing of the nominal exchange rate at a value that guaranteed the convertibility of the two national currencies in the population sector contributed to price stability.
Graph 1 illustrates the evolution of the population exchange rate and inflation in the 1990–2010 period, providing an idea of how closely linked these variables were.
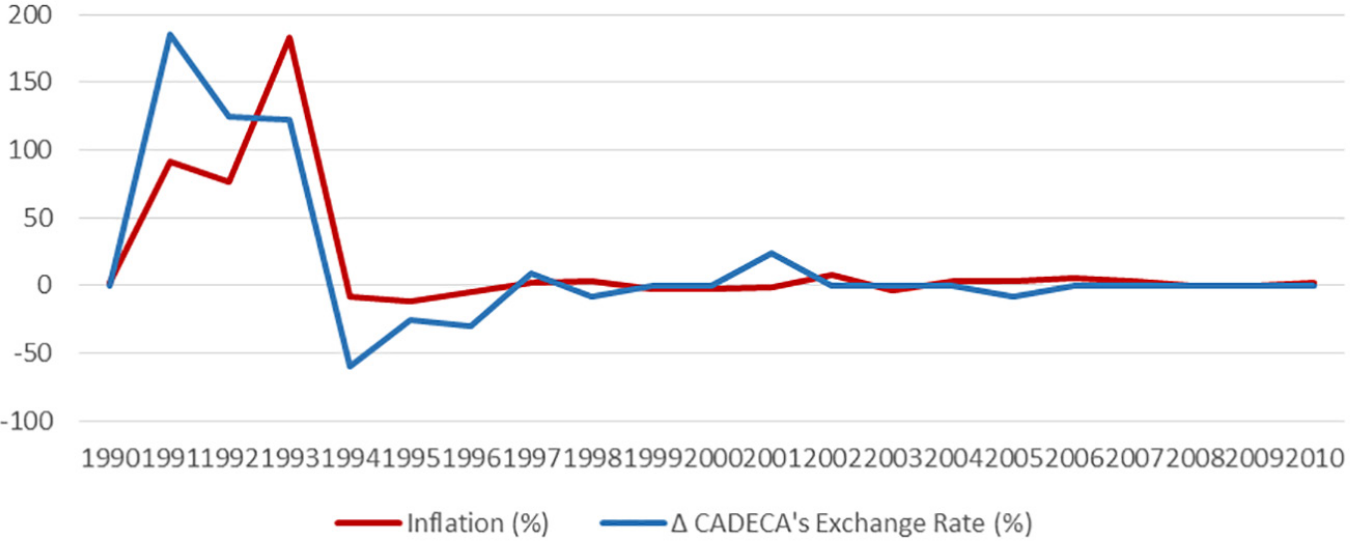
Evolution of inflation and the change in the exchange rate
Source: Own elaboration based on CEPAL (1997) and ONEI Statistical Yearbooks.
As can be seen in Graph 1, between 1990 and 1993 the exchange rate of the Cuban peso depreciated severely, obtaining depreciation rates of 185.7%, 125%, and 122.2% in 1991, 1992 and 1993, respectively. In these years there was high inflation in the context of the deep economic recession associated with the loss of Cuba’s main trading partners, which manifested itself in the real and monetary sectors of the economy through the significant loss of purchasing power and the accelerated deterioration of the money functions performed by domestic currency.
Within the framework of the reform of the economic system that began in 1993, the actions that were taken contributed considerably to monetary and exchange stability, since they restricted the demand for foreign currency in the population’s exchange market. In this way, after 1994 it was possible to revalue the exchange rate of the Cuban peso for the population and, subsequently, maintain its stability.
Using the Money Supply as a Nominal Anchor
Taking into account what was stated by Vidal (2003), it can be affirmed that the use of the money supply as a nominal anchor in this period is based on the direct relationship 16 that was established between the quantity of money and the price level. In this sense, due to the inelasticity of the supply of goods and services in CUP, the increase in the money supply was generally not accompanied by a quick response of the product, but was instead translated into price increases.
Vidal (2003) also points out that, due to the segmentation of the markets and the existing price regulations that have characterized the Cuban economy, not all movements in the quantity of money were transferred to prices. When the Central Bank of Cuba (CBC) issued more money than was required, given a certain level of economic activity, this was reflected not only in rising prices, but also in the accumulation of excess liquidity in the economy (repressed inflation and forced saving).
On the other hand, it is important to highlight that there were three ways through which money was injected into or withdrawn from the population: 1) monetary flows between the state sector and the population (both collections and payments), 2) the net inflow of foreign currency through official channels (exchange operations through CADECA) and 3) the net granting of bank credits (discounting their amortization). The first two paths were those that determined the growth of the monetary aggregate M2A, 17 given that bank credit had a very small weight in the sector of the population (Lage 2016).
It is relevant to highlight the relationship established between the fiscal deficit and the money supply in the sector of the population. According to Lage and González (2015), the monetization of the fiscal deficit in Cuba was not directly inflationary. This produced an increase in the amount of money in the economy, which was initially deposited in the State Budget accounts. Its effect was only inflationary if these funds were transferred to the population sector, based on an increase in the salaries of the budgeted sector, payments for assistance and social security, the distribution of company profits to their workers, or the payments for goods and services from the public sector to the private sector. In this way, inflation was generated if the increase in the monetary balances held by the population, resulting from the monetary flows of payments established between the state and the population sectors, was superior to the level of the supply of goods and services and to the amount of tax collections.
What has been stated up to here implies that the stabilization of the fiscal deficit was a necessary but not a sufficient condition to control the increase in monetary balances in the sector of the population. It was also necessary to regulate the specific channels through which money was injected into that sector.
The latter was accomplished in two ways. On the one hand, the government kept wages in the state sector under its direct control, so their growth rate was determined by government regulations. In this way, in the absence of an automatic adjustment mechanism for wages in the face of price increases (indexation), during inflationary processes the purchasing power of the population’s income was considerably reduced while avoiding the formation of inflationary spirals.
On the other hand, a mechanism was established to sterilize the net inflow of foreign currency to the sector of the population, which worked as follows: the CBC bought from CADECA the excess convertible pesos that were produced as a net result of the operations with the population. Subsequently, the CBC sold these resources to the state retail network (MINCIN) in exchange for Cuban pesos at the exchange rate prevailing in CADECA. For its part, the retail network used these convertible pesos to buy products that it later sold in national currency to the sector of the population, increasing the supply of goods in CUP. Thus, if the net inflow of foreign currency was sterilized by a proportional increase in retail sales, there would be no impact on the monetary issue in this sector (Lage 2016).
Diagram 3 illustrates the transmission mechanisms through which the money supply influenced the price level of the population.
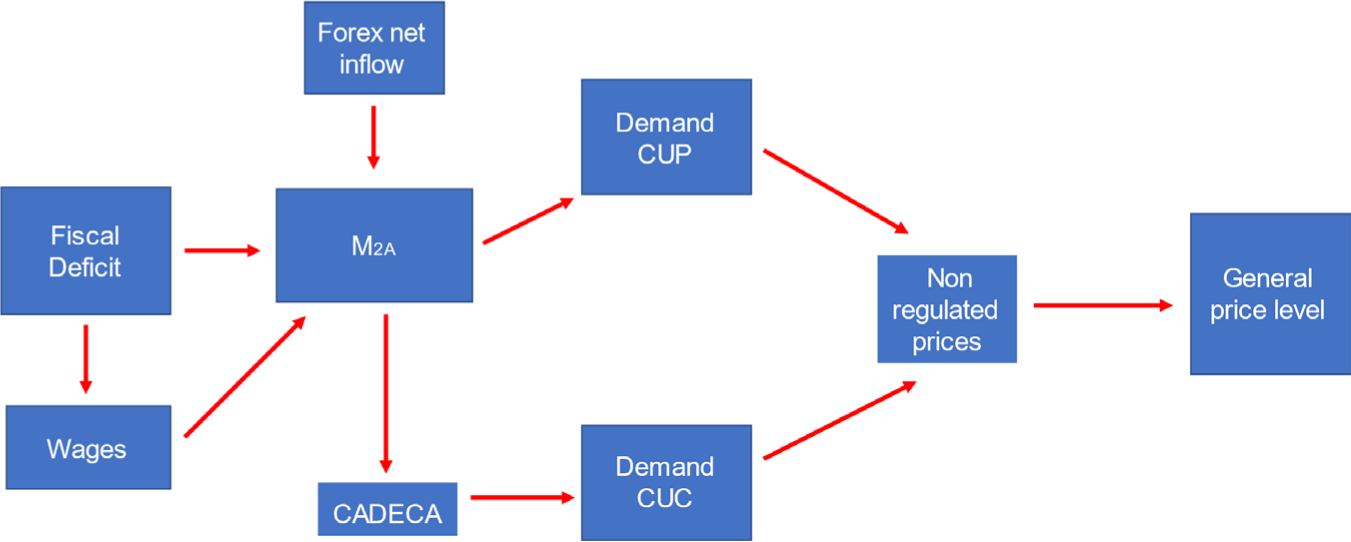
Money supply transmissions mechanisms
Source: Own Elaboration based on Perez et al. (2003) and Hidalgo et al.(2011).
Generally speaking, an increase in the monetary balances held by the population could occur as a result of the following factors:
1) The monetization of an increase in the fiscal deficit whose funds pass to the sector of the population as a result of the monetary flows of payments.
2) Increase in wages in the state sector.
3) Net inflow of foreign currency not sterilized.
As witnessed in Cuba, the immediate consequence of an increase in the monetary balances held by the population would be an inflationary pressure through the following channels (Pérez et al. 2003; Doimeadiós et al. 2011):
An increase in the amount of money held by people stimulated an increase in purchases in the goods market in CUP, which produced an increase in demand that, if not absorbed by an increase in the supply of goods in CUP, generated inflationary pressures on non-regulated prices and, therefore, on the general price level.
In the presence of a proportion of regulated prices, restrictions on the supply of goods in CUP and dual markets, a part of the increase in monetary balances held by individuals was transferred to the exchange market in order to acquire convertible pesos and complete consumption in this currency. This exerted devaluation pressures on CADECA’s exchange rate which, if not compensated with interventions in the exchange market (through the net sale of CUC) resulted in an excess demand for CUC and the devaluation of the CUP. If this excess demand for CUC was not absorbed by an increase in the supply of goods in CUC, it would result in an increase in non-regulated prices and, therefore, an increase in the general level of prices.
Graph 2 reflects the evolution of the money supply and inflation and its relationship with the magnitude of the fiscal deficit in the period 1990–2010.
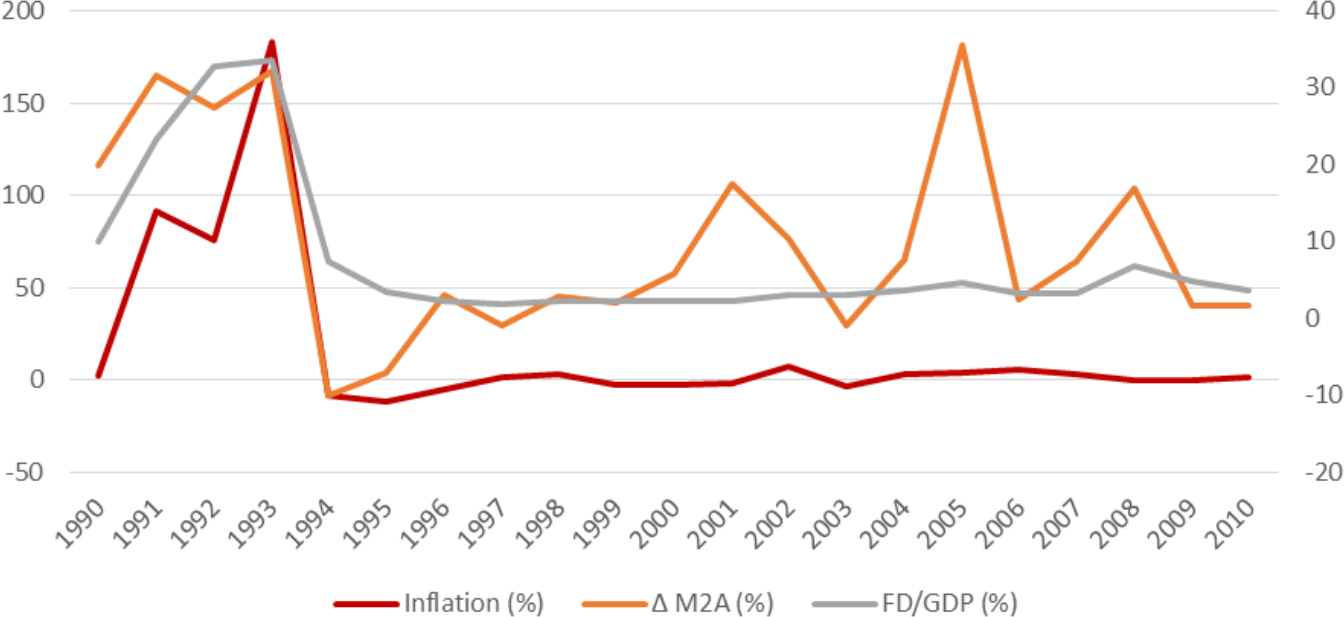
Evolution of inflation and the Money supply
Source: Own elaboration based on ONEI Statistical Yearbooks.
Between 1990 and 1993 there was a considerable increase in the amount of money in the hands of the population as a result of the substantial fiscal deficits obtained in those years, 18 since the budget maintained spending on education and health, while subsidies to state companies increased in order to preserve employment. In these three years, the money supply grew by an amount much greater than what the economy needed, so not only prices increased, but also considerable volumes of liquidity accumulated in the population sector as a result of price controls over a broad set of goods and services (repressed inflation).
In order to reduce the monetary liquidity held by the population, financial sanitation measures were established. 19 The successful implementation of these measures allowed the money supply to be reduced by 10% and 7% in 1994 and 1995, respectively.
Subsequently, the money supply remained relatively stable, except for the increases to deal with different situations in the period, since it was tried to ensure that the amount of money in the hands of the population did not exceed levels that endangered monetary stability and would give rise to a situation like the one experienced in the early 1990s. One of the factors that contributed to this happening was the stability of the fiscal deficit, which remained around 3% of GDP after 1995.
Another factor that contributed to the monetary stability achieved after 1994 was the direct control by the government of salaries in the state sector. Graph 3 shows the evolution of the average nominal wage and the average real wage in the period 1990–2008.
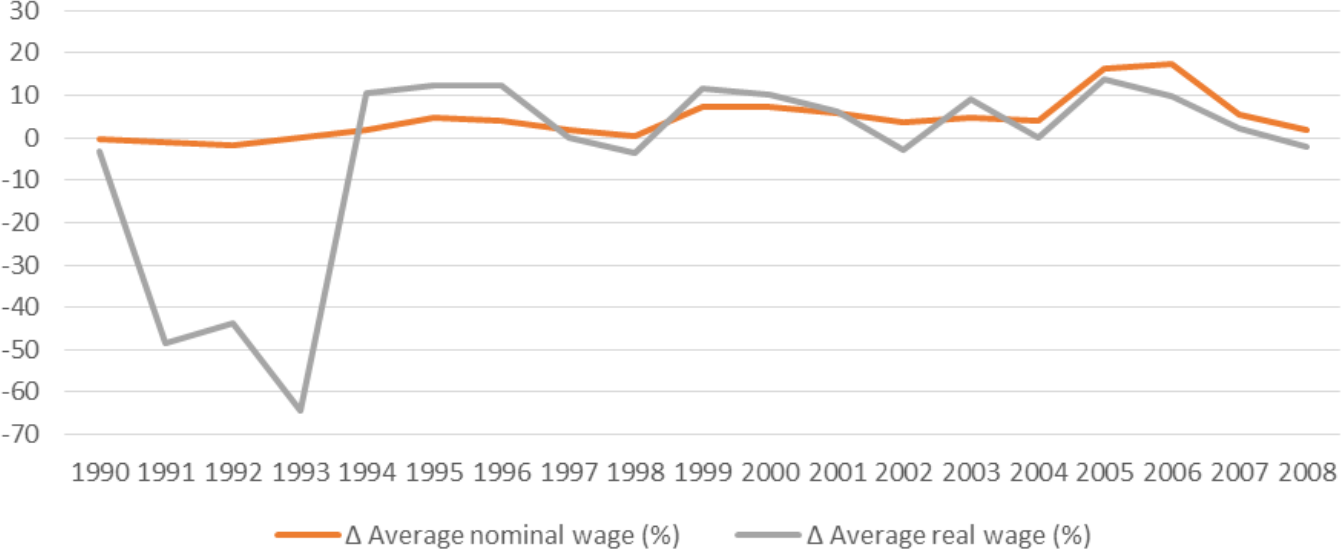
Evolution of average nominal wage and the average real wage
Source: Own elaboration based on Vidal (2010)
Graph 3 shows how, despite the high inflation experienced between 1990 and 1993, the nominal average wage remained stable due to the wage freeze in the state sector. As the state sector is the largest employer of the labor force in Cuba, wage control prevented an inflationary spiral from originating that would further exacerbate the economic instability present in those years. However, this also implied a huge deterioration in the purchasing power of state-owned companies and institutions, which subsequently began to gradually recover, although they long remained far from their pre-crisis levels.
Income Policy: Use of Regulated Prices as a Nominal Anchor
With the objective of maintaining price stability, the Cuban government regulated and managed the retail prices of those products and services that, due to their economic importance for the standard of living of the population, required it. In the analyzed period this policy of regulated prices, directed at preventing serious negative inflationary effects from the social measures applied by the Cuban government to protect the population from the effects of the economic crisis of the Special Period and, later, from the oscillations of the international market prices, as well as to maintain the principle of social equity, remained unchanged.
The control of prices in the sector of the population was carried out by means of the administration of the prices in CUP of all the goods and services that were offered in the formal market. Following the logic of Equation 1, we must conclude that for regulated prices to directly influence the general price level in CUP, two conditions must be met: 1) that the proportion of final household consumption that corresponds to the state market (ρ1) is high, so that the population depends considerably on goods and services with regulated prices for their consumption, and 2) that the trajectory of regulated prices, measured by formal inflation (πF t), is stable.
Thus, in order to assess the role of regulated prices as a nominal anchor in the population sector, one must first determine the proportion of household final consumption that corresponds to the state market, measured by the parameter (ρ1). Graph 4 illustrates the structure of final consumption of the population by supply sources in the period 2002–2010.
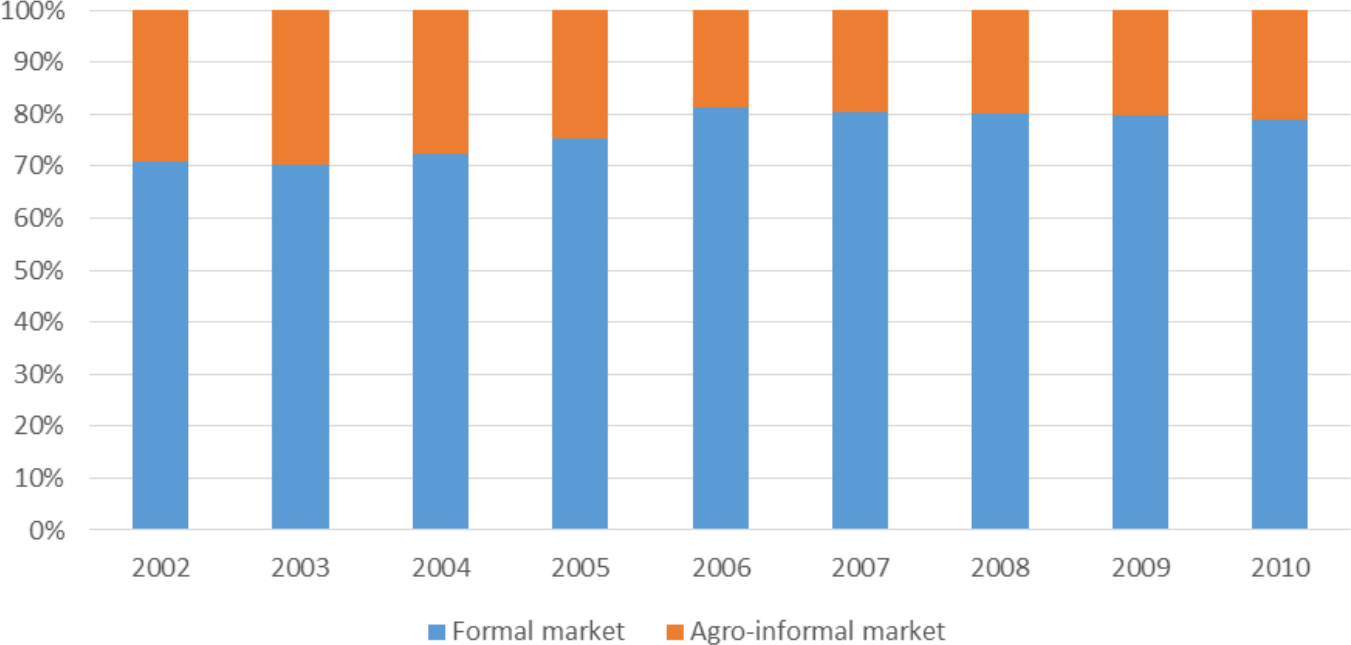
Structure of the final consumption of the population
Source: Own elaboration based on ONEI Statistical Yearbooks.
This graph shows how the proportion of final consumption of the population in the formal market remained between a minimum of 70.4% and a maximum of 81.2%, demonstrating a clear predominance of the state retail network over the rest of the sources of supply. This high proportion implies that the final consumption of households was made up mostly of goods and services with regulated prices, fulfilling the first condition indicated above.
On the other hand, the trajectory of regulated prices must also be analyzed, taking the consumer price index (CPI) into consideration. Graph 5 shows the variations of regulated prices (FCPI) 20 and non-regulated (AICPI) 21 from January 1996 to December 2004.
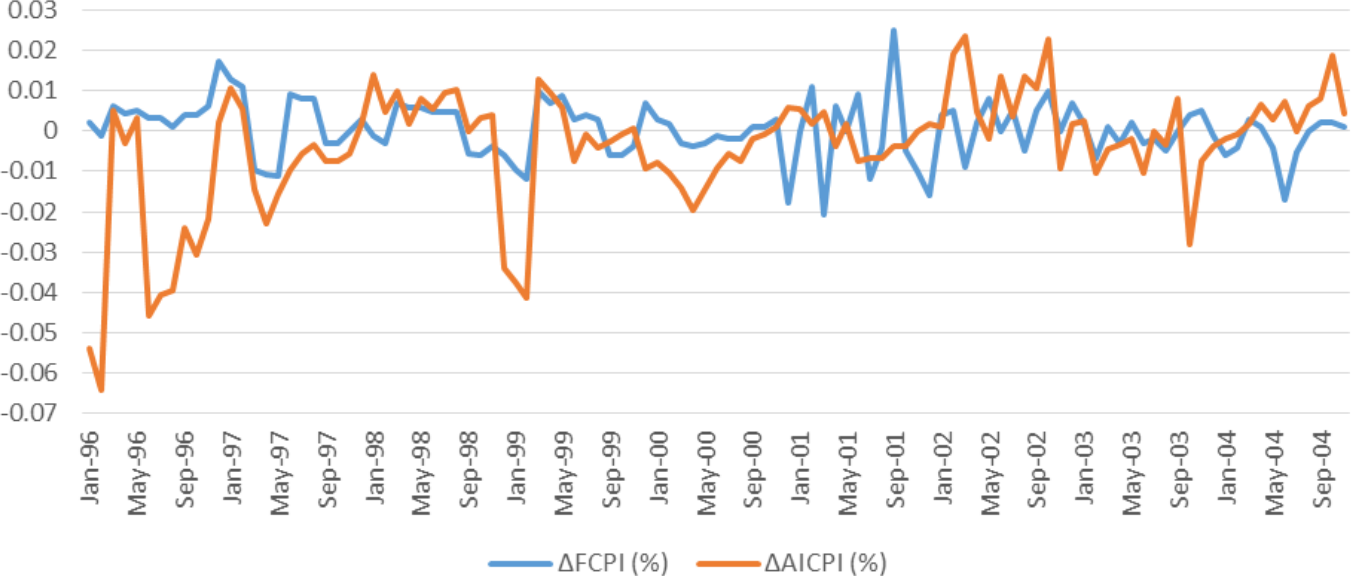
Variations of regulated prices and non-regulated prices
Source: Own elaboration based on Vidal (2007).
Observing the variations of both types of prices reflected in Graph 5, it can be deduced that regulated prices presented less volatility than unregulated prices between January 1996 and December 2004. Consistent with this, empirical studies are carried out for this period in Vidal (2007) and in García (2009), in which it is demonstrated that the regulated prices showed a relative stability in their trajectory, with the exception of certain adjustments in the prices of some products. Hence the second condition mentioned above is fulfilled. Likewise, they also show that unregulated prices had a greater variability and were responsible for the inflation levels reached in the country, which have been associated with the monetary imbalances that occurred in the economy.
Similarly, these studies quantify the impact of regulated prices on unregulated prices in the population sector, drawing the conclusion that regulated prices significantly explained the behavior of prices in the agricultural and informal market. Vidal (2007) proposes the transmission mechanisms through which regulated prices influence non-regulated prices and, therefore, indirectly on the general price level in CUP:
An increase in regulated prices increased the production costs of private agents, since many of the goods and services offered in the formal market, including those in the regulated channel, represented inputs from these agents. 22
This mechanism could occur by two effects: income and substitution. If the substitution effect was stronger, an increase in regulated prices would reduce the sales of retail mercantile circulation and increase the demand for goods in the agricultural and informal markets and, therefore, produce an upward movement in prices in these markets. In contrast, if the income effect was predominant, increasing administered prices would increase the volume of retail sales and, as a result, reduce the quantity of money in circulation, bringing about a decrease in unregulated prices.
Diagram 4 below summarizes the mechanisms for transmitting regulated prices to the general price level, described above.
Loss of the Main Nominal Anchors in the Period of 2011–2022
In this second part of the article, we proceed to examine the factors that explain the loss of the main nominal anchors in the period of 2011–2022. During this period, important changes take place in the macroeconomic environment.
At the beginning of the period, a new economic reform called “Update of the Cuban Economic Model” was promoted, as part of which a set of measures were adopted 23which sought a greater role for the market, and also a higher degree of decentralization in economic management.
Despite the broad set of measures that were taken as part of the update process, between 2011 and 2018 the macroeconomic performance of the model was characterized by a propensity for stagnation. This was due to multiple causes, some of an internal nature, such as the distorting persistence of the dual currency, 24 and others of an external nature, as is the case of the Venezuelan economic crisis. 25
Subsequently, in 2019 the economy began to show symptoms of a more generalized crisis, with the dynamics of the main economic, monetary and financial indicators approaching or exceeding what happened in the early 1990s. This new adverse macroeconomic scenario is the result of the effects of the escalation of the sanctions of the Trump administration 26 and the COVID-19 pandemic 27 over an already weakened economy as a result of the stagnation of the economic model.
Given the need to seek some quick relief from the economic crisis, new measures were taken in the monetary and financial environment. Table 3.1 briefly indicates these and their results.
Balance of the new measures taken in the monetary-financial environment
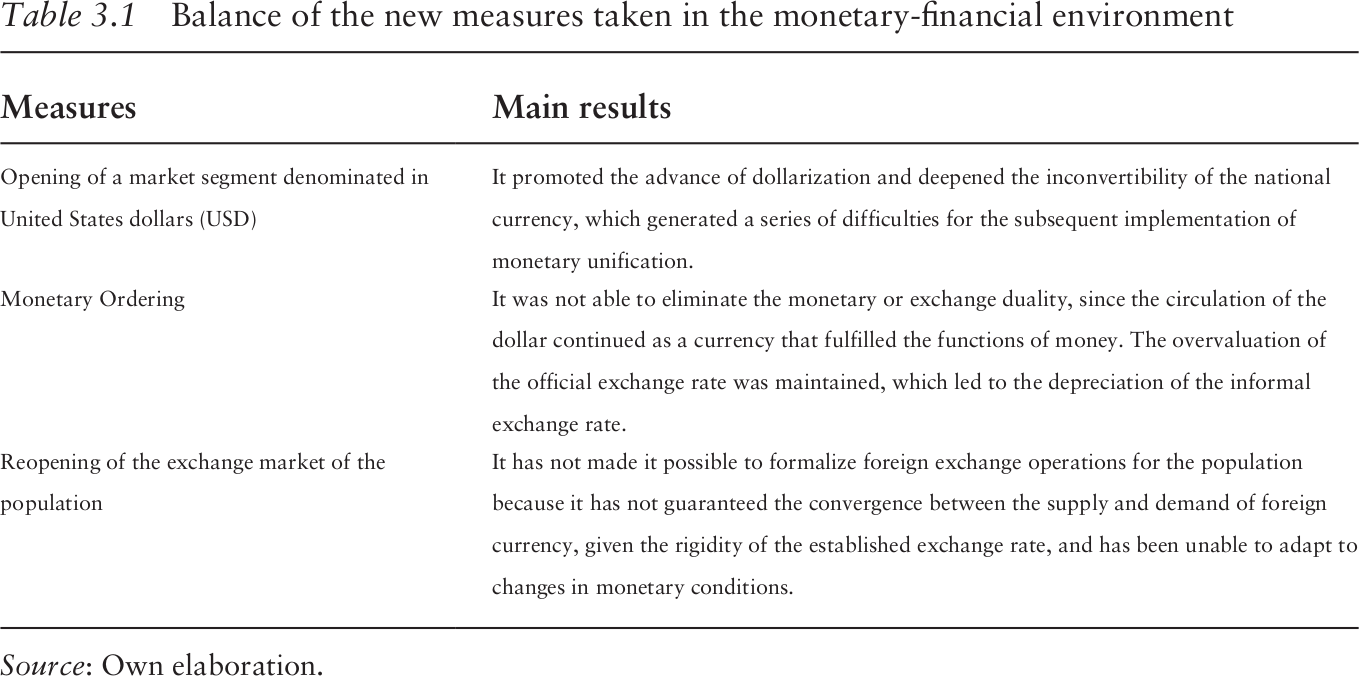
Source: Own elaboration.
All these transformations which were produced in the prevailing macroeconomic environment in the period were unsuccessful in overcoming the obstacles to the Cuban economic model and for promoting the development of the country’s monetary and financial system. On the other hand, as a result of these transformations some of the factors that caused the loss of the main nominal anchors of monetary policy proliferated. These are examined in the rest of the article.
Factors that Explain the Loss of the Exchange Rate as a Nominal Anchor
According to Vidal (2020), the need to redollarize in 2019 is explained, basically, by all the flaws in the design of the monetary policy scheme after the de-dollarization in 2004. In this sense, the lack of transparency and the total discretion with which the printing of CUCs was handled brought about excessive issues of this currency into circulation, without having an adequate backing in foreign currency or in the supply of goods and services. This began to act against the convertibility and stability of this currency, also in the sector of the population.
As a result of the strong external shocks that affected the Cuban economy as of 2019, there was a contraction in the foreign currency supply. The package of measures approved by the Trump administration imposed substantial obstacles to the arrival of American tourists and Cuban emigrants. This situation worsened during 2020 as a result of the health emergency caused by the COVID-19 pandemic, which forced measures to restrict mobility and limit the entry of foreign visitors into the country. Both external shocks caused a huge contraction in the inflow of foreign currency from tourism and, consequently, the uptake of this currency by the private sector linked to this activity was greatly reduced.
On the other hand, remittance flows were also considerably affected by both shocks. In a context in which remittances were channeled through informal mechanisms as a result of the cessation of Western Union operations, the COVID-19 pandemic forced the closure of airports, thereby eliminating the main source for sending remittances.
Graph 6 illustrates the evolution of the formal and informal exchange rate from July 2019 to November 2022. Until October 2019, the trajectory of the informal exchange rate remained within the limits established by the 10% tax on the sale of USD in cash by the population to the financial system and the commercial margin of 3% applied by commercial banks, moving in parallel with the formal exchange rate. However, as of October 2019, with the decision to open retail establishments nominated in USD, the informal exchange rate began to exceed the established limits and misalign with the official exchange rate. Consequently, the inconvertibility of the national currency ceased to be an exclusive phenomenon of the state sector of the economy, extending to the non-state sector. In this way, the monetary scheme built since the 1990s became dysfunctional, since neither of the two national currencies had convertibility in the two monetary circuits: the population sector and the state sector (Torres 2020).
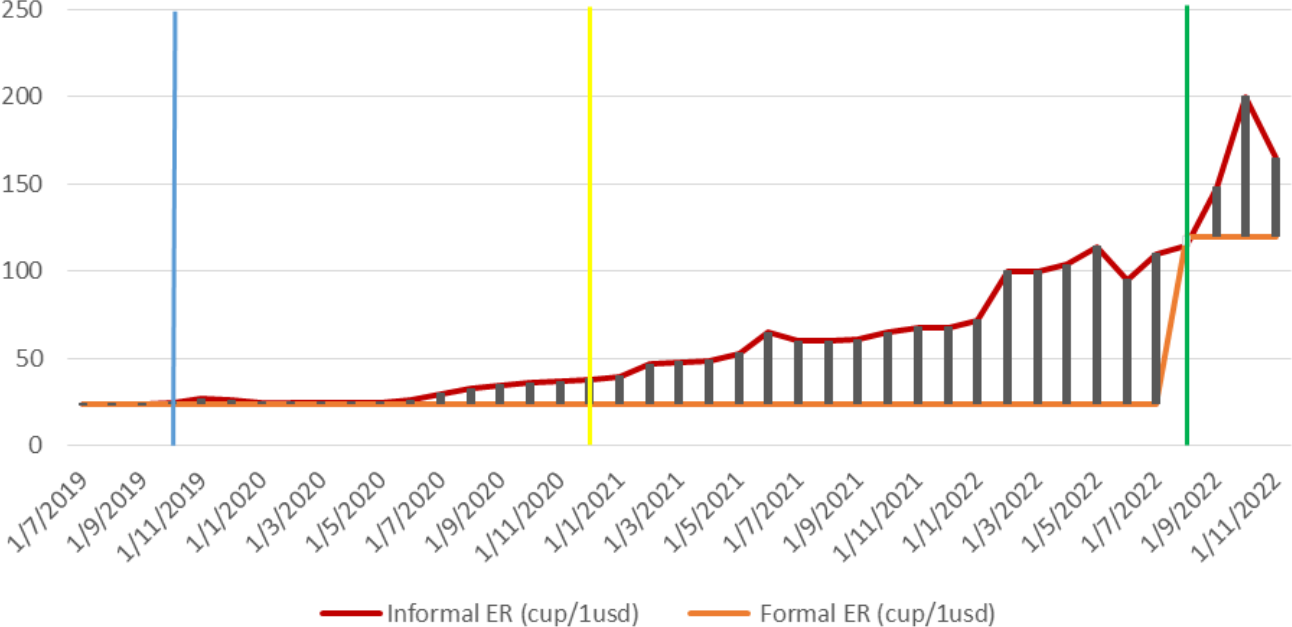
Evolution of the formal and informal exchange rate
Source: Own elaboration based on estimates from eltoque.com.
With the start of partial redollarization (blue line in Graph 6) in October 2019, there is a considerable increase in the demand for foreign currency to carry out transactions and, subsequently, an expansion of the informal currency market. According to Torres, Cruz and Carmona (2021), the inclusion of many basic necessities in markets denominated in foreign currency, together with the reduced level of supply of goods in national currency as a consequence of external shocks, resulted in an excess of the population’s demand for foreign currency in order to support their purchases in this segment. The inability to satisfy this excess demand for foreign currency led to the almost total suspension of the sale of foreign currencies in the financial system. Therefore, natural persons with no possession of USD income had to resort to the informal exchange market to obtain it.
In this way, the growth of both transactions and participants in the informal currency market (expansion) and the depreciation of the informal exchange rate were factors induced by the excessive issuance of the CUC from de-dollarization, by the colossal impact of external shocks, and by the redollarization policy adopted by the government itself.
As a result of all these impacts, starting in October 2019, a considerable depreciation of the informal exchange rate occurred, whose percentage difference in relation to the official exchange rate widened to reach approximately 67% in January 2021.
January 1, 2021, constituted the “zero day” of the Monetary Ordering (yellow line of Graph 6), marking the beginning of this complex reform. The implementation of the Monetary Ordering brought with it an increase in the monetary balances held by the population, coming from the increase in salaries, pensions and social assistance, which was not accompanied by a substantial increase in the supply of goods and services in pesos. As a result, the excess demand for foreign currency increased in the informal market and generated even more inflation in the economy, deteriorating the value of the national currency in relation to foreign currency. Thus, the depreciation of the informal exchange rate continued to advance as a result of the systematic and growing erosion of the purchasing power of the Cuban peso.
On the other hand, as an essential part of this reform the government decided to continue with the fixed exchange rate or nominal anchor to control the increase in wholesale prices and inflation. The fixed exchange rate of 24 CUP/USD was maintained, oblivious to the conditions that the population market presented in the face of the acute shortage of foreign currency. This resulted in the inability of the Central Bank to offer the foreign currency at the fixed price, so that there was a new expansion of the informal currency market, increasing the volume of dollars that was channeled to this market, as well as the exchange differential between it and the official rate. In July 2021 the informal exchange rate reached a value of 60 CUP/USD, widening the exchange differential to 150%.
Finally, on August 4, 2022, the foreign exchange market reopened (green line in Graph 6). This constituted the first steps to combat the notable expansion of the informal exchange market by formalizing foreign currency inflows through the financial system, with the aim of recovering the convertibility of the national currency.
With this objective, the authorities devalued the official exchange rate to a fixed value of 120 CUP/USD, establishing equality with the informal exchange rate. However, the upward spiral of the USD in the informal exchange market persisted, which can be explained by an overreaction of the informal exchange rate 28 as a result of the expectations generated by the opening of the official exchange market with an insufficient supply of foreign currency. In addition to this inadequate currency availability, the official exchange market also suffered from limitations in geographic scope, and from the impossibility of access by agents other than natural persons. Therefore, not all the conditions have been created so that economic agents can freely and opportunely exchange foreign currencies for national currency and vice versa.
This situation once again increased the exchange differential between the two rates, thus maintaining the conditions motivating agents to participate in the informal market, where a much more attractive price is offered. In October 2022, the informal exchange rate reached 200 CUP/USD.
As a result of the rise in the value of the USD above what demand was willing to pay (overreaction), there was a new adjustment in the informal exchange rate that reduced its value to 165 CUP/USD on November 1. This constitutes a sample of the volatile behavior that the informal exchange rate has adopted as a result of the determining role that agents’ expectations have acquired in determining its value. Hence the importance of achieving the anchoring of said expectations by recovering the nominal anchor of the official exchange rate.
Graph 7 shows how the price level in the population sector has been closely related to the recurring depreciation of the informal exchange rate, which indicates that there has been a substitution of the formal exchange rate for the informal one as the fundamental variable of reference for price formation. The bivariate linear correlation coefficient between the monthly CPI and the informal exchange rate yields a value of 0.901, showing the existence of a very strong direct linear relationship between both variables. On the other hand, this same coefficient presents a value of 0.395 for the relationship between monthly CPI and the formal exchange rate. This evidences the loss of the nominal anchor established through the formal exchange rate as a consequence of the expansion of the informal exchange market and the depreciation of the informal exchange rate.
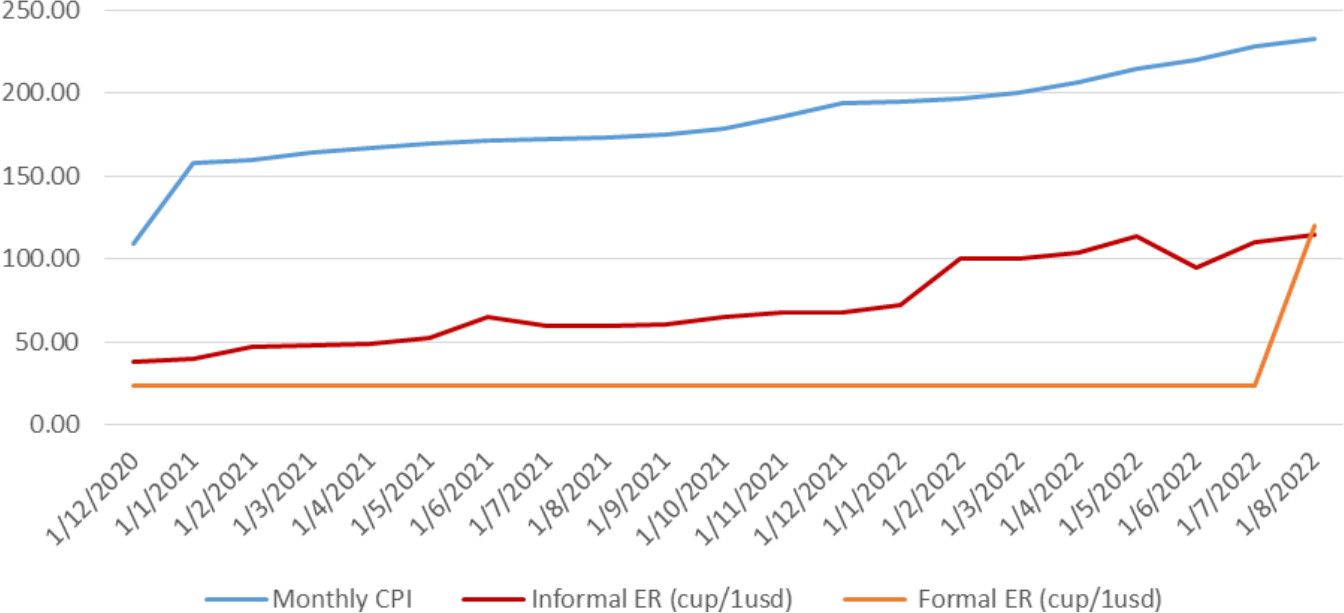
Evolution of the monthly CPI and the informal exchange rate
Source: Own elaboration based on ONEI Statistical Yearbooks and estimates from eltoque.com.
Factors that Explain the Loss of the Money Supply as a Nominal Anchor
With the stabilization program implemented in the early 1990s, an attempt was made to sustain a fiscal policy aimed at avoiding additional inflationary pressures, which allowed for an average fiscal deficit of around 3% of GDP between 1996 and 2014. In the same way, with the updating of the economic model several measures were introduced that had a significant influence on the fiscal sphere, 29 boosting tax revenues and limiting public spending.
Despite the dynamics promoted by the program to update the economic model, the evolution of the fiscal deficit in the analyzed period shows a new turning point in 2015, as shown in Graph 8. The deficits have moved away from the figure of 3% of GDP since then, while subsidies crowded out public investment and social spending. This situation is largely explained by inconsistencies in the implementation of measures associated with the delay in the monetary unification process and the corresponding devaluation of the business exchange rate. Thus, productive incentives based on a multiplicity of implicit exchange rates proliferated (exchange compensations for the export sector, price increases for producers, converters for wages, etc.), enhancing the burden of subsidies on the State Budget in a drastic way, thereby causing serious problems in terms of fiscal sustainability (Hidalgo 2021).
In this way, despite the approval of the purchase and sale of sovereign bonds, it was not possible to preserve fiscal discipline as an essential condition to maintain a sustainable trajectory of the deficit. Finally, the accumulation of pronounced fiscal deficits overwhelmed the public bond financing mechanism, which had been showing signs of deterioration. As of 2015, therefore, the necessary condition to keep the increase in monetary balances held by the population under control was no longer met, since the stability of the fiscal deficit was lost.
On the one hand, these increases in the fiscal deficits have in turn resulted in disastrous impacts on macroeconomic stability as a consequence of the marked fiscal domination 30 that has prevailed in the management of the macroeconomic policies of the country, which has meant successive monetizations of the fiscal deficits.
On the other hand, the detrimental effects of the international situation on Cuba’s fiscal position cannot be ignored. The external shocks corresponding to the escalation of US sanctions and the COVID-19 pandemic led to maintaining a markedly expansionary fiscal policy to soften their impact on the economy. The measures that have been taken from the State Budget to deal with these new shocks of enormous proportions have involved large increases in fiscal expenditures without having stable income levels, adding considerable risks to monetary stability.
Thus, for example, to combat the pandemic in a recessive economic context, public outlays were increased in the areas of social security, science and technological innovation, education, public health, and social assistance. Consequently, there was a considerable increase in the fiscal deficit, which rose from 6.2% of GDP in 2019 to 17.7% of GDP in 2020. Likewise, public health expenditures associated with the outbreak of the pandemic continued to rise after January 2021, including investment in the development and clinical trials of five COVID-19 vaccine candidates. All this contributed to the generation of a fiscal deficit in 2021 of about 11.7% of GDP.
In addition to this, in August 2019 an expansion of the average nominal salary of 68% was decreed for half of the employees of the state sector. As this increase depended heavily on the State Budget, the decision implied another expansion of total public spending, also increasing the magnitude of the fiscal deficit (Alonso and Vidal 2020). Likewise, as part of the Monetary Ordering, there was an adjustment of the salaries in the state sector, pensions and social assistance to protect the income of the population from the increase in prices. These wage and remuneration increases have generated inflationary pressures in the absence of an adequate supply of goods in CUP as a result of the acute economic crisis, exacerbating macroeconomic instability in the sector of the population. Graph 9 shows how the increase in average nominal salary has been accompanied by a notable slowdown in retail sales in CUP. 31
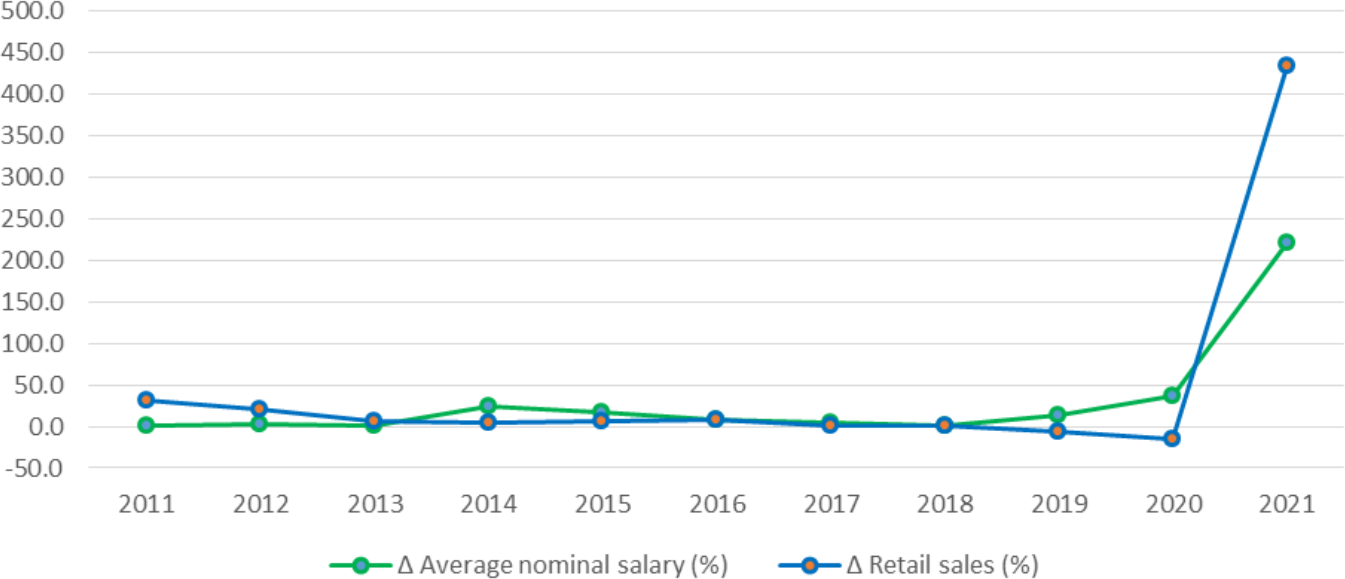
Evolution of the average nominal salary and retail sales
Source: Own elaboration based on ONEI Statistical Yearbooks.
In this way, there has been a considerable increase in the amount of CUP in circulation in the population sector, coming mostly from the sustained increases in the fiscal deficit that have been transferred to this sector through the monetary flows of payments. In 2019, the fiscal deficit was 6,435.3 million CUP and in 2021 it was 63,696.7 million CUP. For its part, the salary fund was 31,845 million CUP in 2019 and 155,288 million CUP in 2021, increasing almost five times. As a consequence, the money supply in the population sector increased almost three times in just two years, from 65.028 million in 2019 to 190.917 million in 2021.
This complex situation of monetary imbalance has resulted in the loss of the money supply as a nominal anchor, since the monetary balances held by the population have grown much more than the needs of retail circulation.
Factors that Explain the Loss of Regulated Prices as Nominal Anchor
In the 2011–2021 period, a deterioration in the predominance of state retail commerce as the main source of supply for the consumption of the population began to appear. Graph 10 shows the decrease in the proportion of final consumption of the population in the state market from 79.4% in 2011 to 60.5% in 2021 and the corresponding expansion of the non-state sector and the informal market, that occurred in the analyzed period.
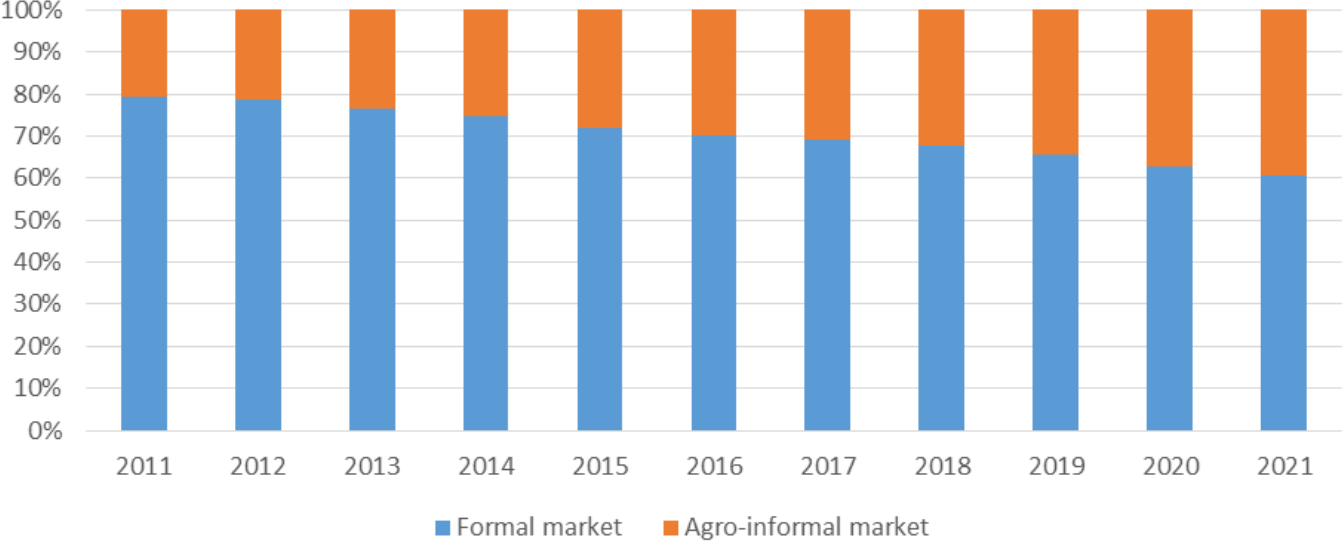
Structure of the final Consumption of the population
Source: Own elaboration based on ONEI Statistical Yearbooks.
From the updating of the Cuban economic model, measures such as the authorization of non-agricultural cooperatives, the expansion of self-employment and, more recently, the recognition in legal terms of micro-, small-, and medium-sized enterprises (MSMEs), have subjected the enterprise system to various changes. All these measures have promoted the expansion of the non-state sector, which has been the one that has created the majority of the employment in Cuba since 2011.
According to the figures published by the ONEI Statistical Yearbooks, it can be seen in Graph 11 how between 2011 and 2021 the labor force employed in the non-state sector expanded from 22.7% to 32.4%, while in the state sector correspondingly contracted from 77.3% to 67.6%.
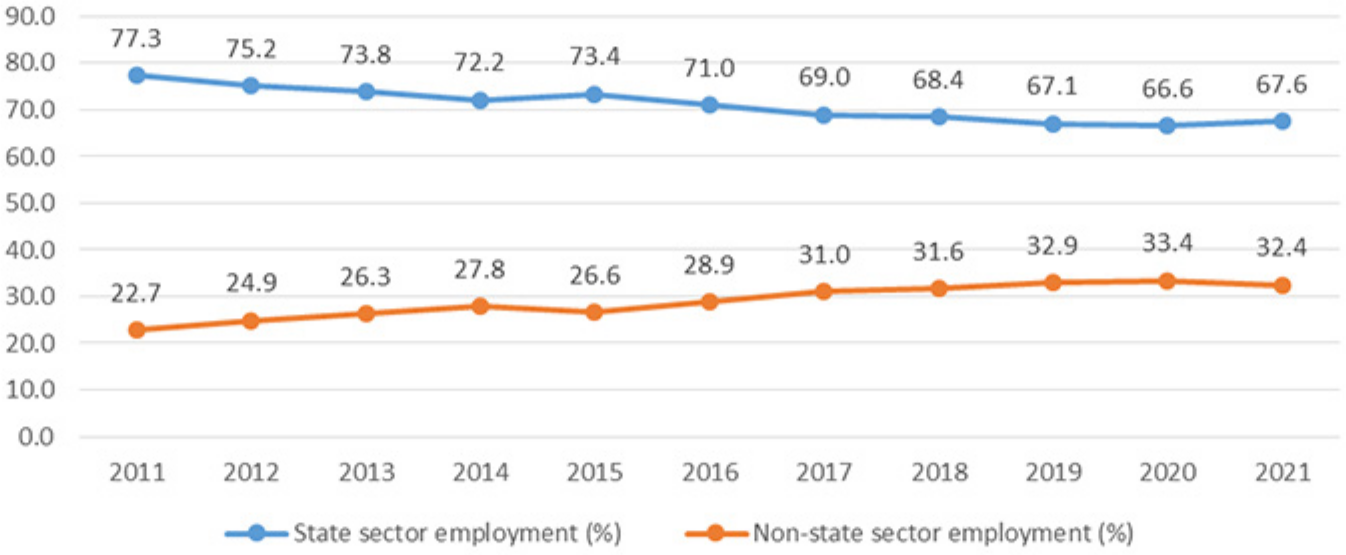
Expansion of employment in the non-state sector
Source: Own elaboration based on ONEI Statistical Yearbooks.
With the updating of the economic model from 2011 forward, a reopening of the private sector in Cuba was promoted without adequate material and regulatory conditions. In this sense, the absence of wholesale markets, scarce access to bank credit, and a tax system that generates incentives for tax evasion, stimulated the preference of private agents for informal channels to carry out their operations and avoid control by the authorities. Likewise, the enormous difficulties that have arisen to generate adequate and stable levels of supply of goods and services in the formal markets, together with the imposition of price controls and the increase in demand due to the increase in salaries and pensions, have driven an expansion of the black market, supplied mainly by the deviation of consumer goods from state establishments.
On the other hand, with the entry into force of the immigration reform in 2013, there was a liberalization of international travel through the lifting of the restrictions that existed until then, allowing migratory movements to take place in a legal, orderly, and safe manner. Since this update of the Cuban migration policy, a proliferation of informal importation by individuals has taken place.
The expansion of informal importation that has been observed since 2013 occurred as a result of the growing need to purchase imported goods in order to complement the domestic supply provided by the official circuit, which has been characterized by low quality and diversity, uncompetitive prices, and recurring shortage. In addition to this, the expansion of self-employment was not accompanied by the creation of a wholesale market where access to inputs to carry out productive and service activities was guaranteed. In this way, both families and private entrepreneurs have resorted to the informal importation of goods to meet the needs of private and productive consumption, respectively (Torres, Cruz and Carmona 2021) (Torres, Cruz and Carmona 2021).
In this way, the nominal anchor of regulated prices has been lost since the final consumption of the population has come to depend on a large proportion of goods and services whose prices are not regulated by the authorities, and therefore the necessary condition for regulated prices to directly affect the price level cannot be met. This has resulted in the failure of price controls to keep inflation in the population sector under control.
Final Considerations
Throughout this article, the relevance of the exchange rate, the money supply, and regulated prices as nominal anchors in the last three decades has been analyzed, stressing how the dynamics of inflation in Cuba have been closely linked to the behavior of these economic variables.
The fixed exchange rate regime of 24 CUP/CUC that guaranteed the convertibility of national currencies in the population sector, the anti-inflationary fiscal policy that allowed an average fiscal deficit of 3% of GDP to be obtained, and the predominance of state retail commerce in the structure of final consumption of the population, made it possible for the official exchange rate, the money supply in the population, and regulated prices to be relevant as nominal anchors between 1990 and 2010. This fostered the confidence of agents that future inflation would remain low and stable, anchoring of their expectations.
However, the ability of these anchors to influence price stability has deteriorated markedly in the last decade, so that one by one they have been lost. The nominal exchange rate anchor was lost as a result of the expansion of the informal foreign exchange market and the depreciation of the Cuban peso. For its part, the money supply as a nominal anchor was lost as a consequence of the sustained increase in the fiscal deficit and the increase in wages and remunerations without a corresponding supply of goods available in CUP. Likewise, the nominal anchor of regulated prices was lost as a result of the reduction in the weight of the state market in the consumption structure of the population.
With the loss of the main nominal anchors we arrive at the current scenario. It is characterized by high inflation that the government is unable to control, since it does not have effective tools to stabilize prices. This in turn has resulted in the loss of credibility of policymakers and in an “unanchoring” of the expectations of economic agents. All of this makes it more expensive to influence the dynamics and decisions of economic actors, which makes it difficult to implement economic policies. Therefore, monetary policy in Cuba faces the challenge of greatly strengthening its institutional framework for macroeconomic stabilization. In this sense, it is essential to grant greater autonomy to the CBC in the use of its instruments, develop effective macroeconomic coordination mechanisms, and redesign the current monetary policy scheme in correspondence with the newly restructured institutional framework.


