INTRODUCTION
Automatic detection of physical actions—defined as human activity recognition (HAR)—has been a research topic for years and several problems hinder further progression ( Qian et al., 2021). HAR intends to detect the physical actions of an individual related to video and/ or sensor datasets ( Islam et al., 2023). Therefore, it refers to a system that offers data regarding user behavior and this might stop circumstances of risk or forecast events that could occur. The HAR topic presents various amounts of liberty in terms of system model and application ( Park et al., 2023). First, there is no common description or definition of human actions that explains how a particular action could be characterized ( Xu et al., 2020). The second aspect that goes with this is that human action is different and the detection of particular actions thus necessitates a precise choice of sensors and their placement. A few challenges are the collection of data and the selection of sensor measurements under realistic conditions ( Tang et al., 2022).
The HAR problem is not possible to be resolved deterministically as the number of combinations of sensor measurements and actions can be vast ( Islam et al., 2023). Thus, machine learning (ML) methods can be generally utilized for the growth of the HAR system for detecting patterns of human action in sensor data ( Anagnostis et al., 2021). Generally, ML approaches were adopted to obtain knowledge from data with statistical approaches that intend to ascertain patterns and relations between the features or variables of the data. Like other ML approaches, HAR entails a test and training stage ( Zhang et al., 2022). In the training stage, a method can be advanced related to training datasets, whereas the test phase serves to test (termed assess) the model performance. The model performance on a test dataset becomes a pointer of how well the method may achieve in the future on formerly not-seen data ( Dahou et al., 2022). In general, advancing these systems can be carried out in four basic steps; they are feature extraction, data collection, classification, and windowing. Feature extraction can be considered as the critical step since it decides the overall performance of the method ( Mekruksavanich et al., 2020). This step can be established either using conventional ML or deep learning (DL) methods.
In Shuaieb et al. (2020), the authors suggest a price-efficient, radio frequency identification (RFID)-dependent interior position scheme that implements received signal strength data of inactive RFID tags. This system employs RFID tags positioned at diverse locations on the aimed body. The mapping of the examined information compared to the set of reference location datasets is employed to precisely locate the horizontal position and vertical position of a patient inside a restricted space in real time. Xia et al. (2020) present a DNN that incorporates complex layers with LSTM. This technique could extract action aspects routinely and categorize them with limited method parameters. LSTM is a modified recurrent neural network (RNN) model that is more appropriate for temporal serial processing. In this model, the raw data gathered by smartphone sensors are passed to a multi-layer LSTM trailed by complex layers. Additionally, a GAP layer was enforced to replace the completely associated layer after convolution to mitigate the method parameters.
In Oguntala et al. (2019), the authors present a new ambient HAR model by employing the multivariate Gaussian distribution. This model enhances previous data from inactive RFID tags to attain an elaborate action summary. The model is established on the multivariate Gaussian distribution through greater probability assessment implemented for learning the aspects of the human action method. Gumaei et al. (2019) suggest an efficient multi-sensor established model for human action detection by employing a fusion DL method that incorporates the simple recurrent unit (SRU) with the gated recurrent unit (GRU) of neural networking. This model employs the deep SRU for processing the multi-modal input data sequences by employing the capacity of their interior memory states. The model also utilizes the deep GRU for storing and learning how much of the previous data are fed to the future state to resolve discrepancies or variations in precision and fading gradient issues. In Islam et al. (2019), the authors present an action detection and monitoring approach that is established on a multi-class accommodating classification process for enhancing the action categorizing precision in video frames assisting the cloud or fog computing-dependent blockchain construction. In this approach, frame-based salient factors are extracted from video frames comprising diverse human actions that are additionally processed into activity vocabulary for precision and effectiveness. Likewise, the activity categorizing is accomplished by employing SVM established on the error-correction-output-codes model.
Mihoub (2021) proposed a DL-founded model for action detection in smart homes. This new model is modeled to safeguard a deep utilization of the factor space as three major methods are examined: reduction, selection and the all-feature. Additionally, this model presents the association and analysis of various well-selected DL methods like RNN, autoencoder, and a few derivative methods. Alsarhan et al. (2022) suggest a new enhanced discriminative graph convolutional network founded on the attention system for skeleton-based activity detection. Discriminatory channel-wise factors are attained through the fusion of GCN and the squeeze and excitation component to particularly improve the crucial factors and conceal the insignificant factors. The adaptively improved factor map is later combined with the graph complex layer for enhancing the capacity of learning improved depiction.
In this study, a new Computer Vision with Optimal Deep Stacked Autoencoder Fall Activity Recognition (CVDSAE-FAR) for disabled persons is designed. The presented CVDSAE-FAR technique aims to determine the occurrence of fall activity among disabled persons in the Internet of Things (IoT) environment. In this work, the densely connected networks (DenseNet) model is exploited for feature extraction purposes. Besides, the DSAE model receives the feature vectors and classifies the activities effectually. Lastly, the fruitfly optimization (FFO) method is used for the automated parameter tuning of the DSAE approach which leads to enhanced recognition performance. The simulation analysis of the CVDSAE-FAR approach is tested on a benchmark dataset.
THE PROPOSED FALL ACTIVITY RECOGNITION MODEL
In this study, a new CVDSAE-FAR for the identification and classification of fall activities among disabled persons is designed. The presented CVDSAE-FAR technique aims to determine the occurrence of fall activity among disabled persons in the IoT environment. In this work, the CVDSAE-FAR technique comprises a three-stage process including DenseNet feature extraction, DSAE classification, and FFO-based parameter optimization. Figure 1 shows the workflow of the CVDSAE-FAR algorithm.
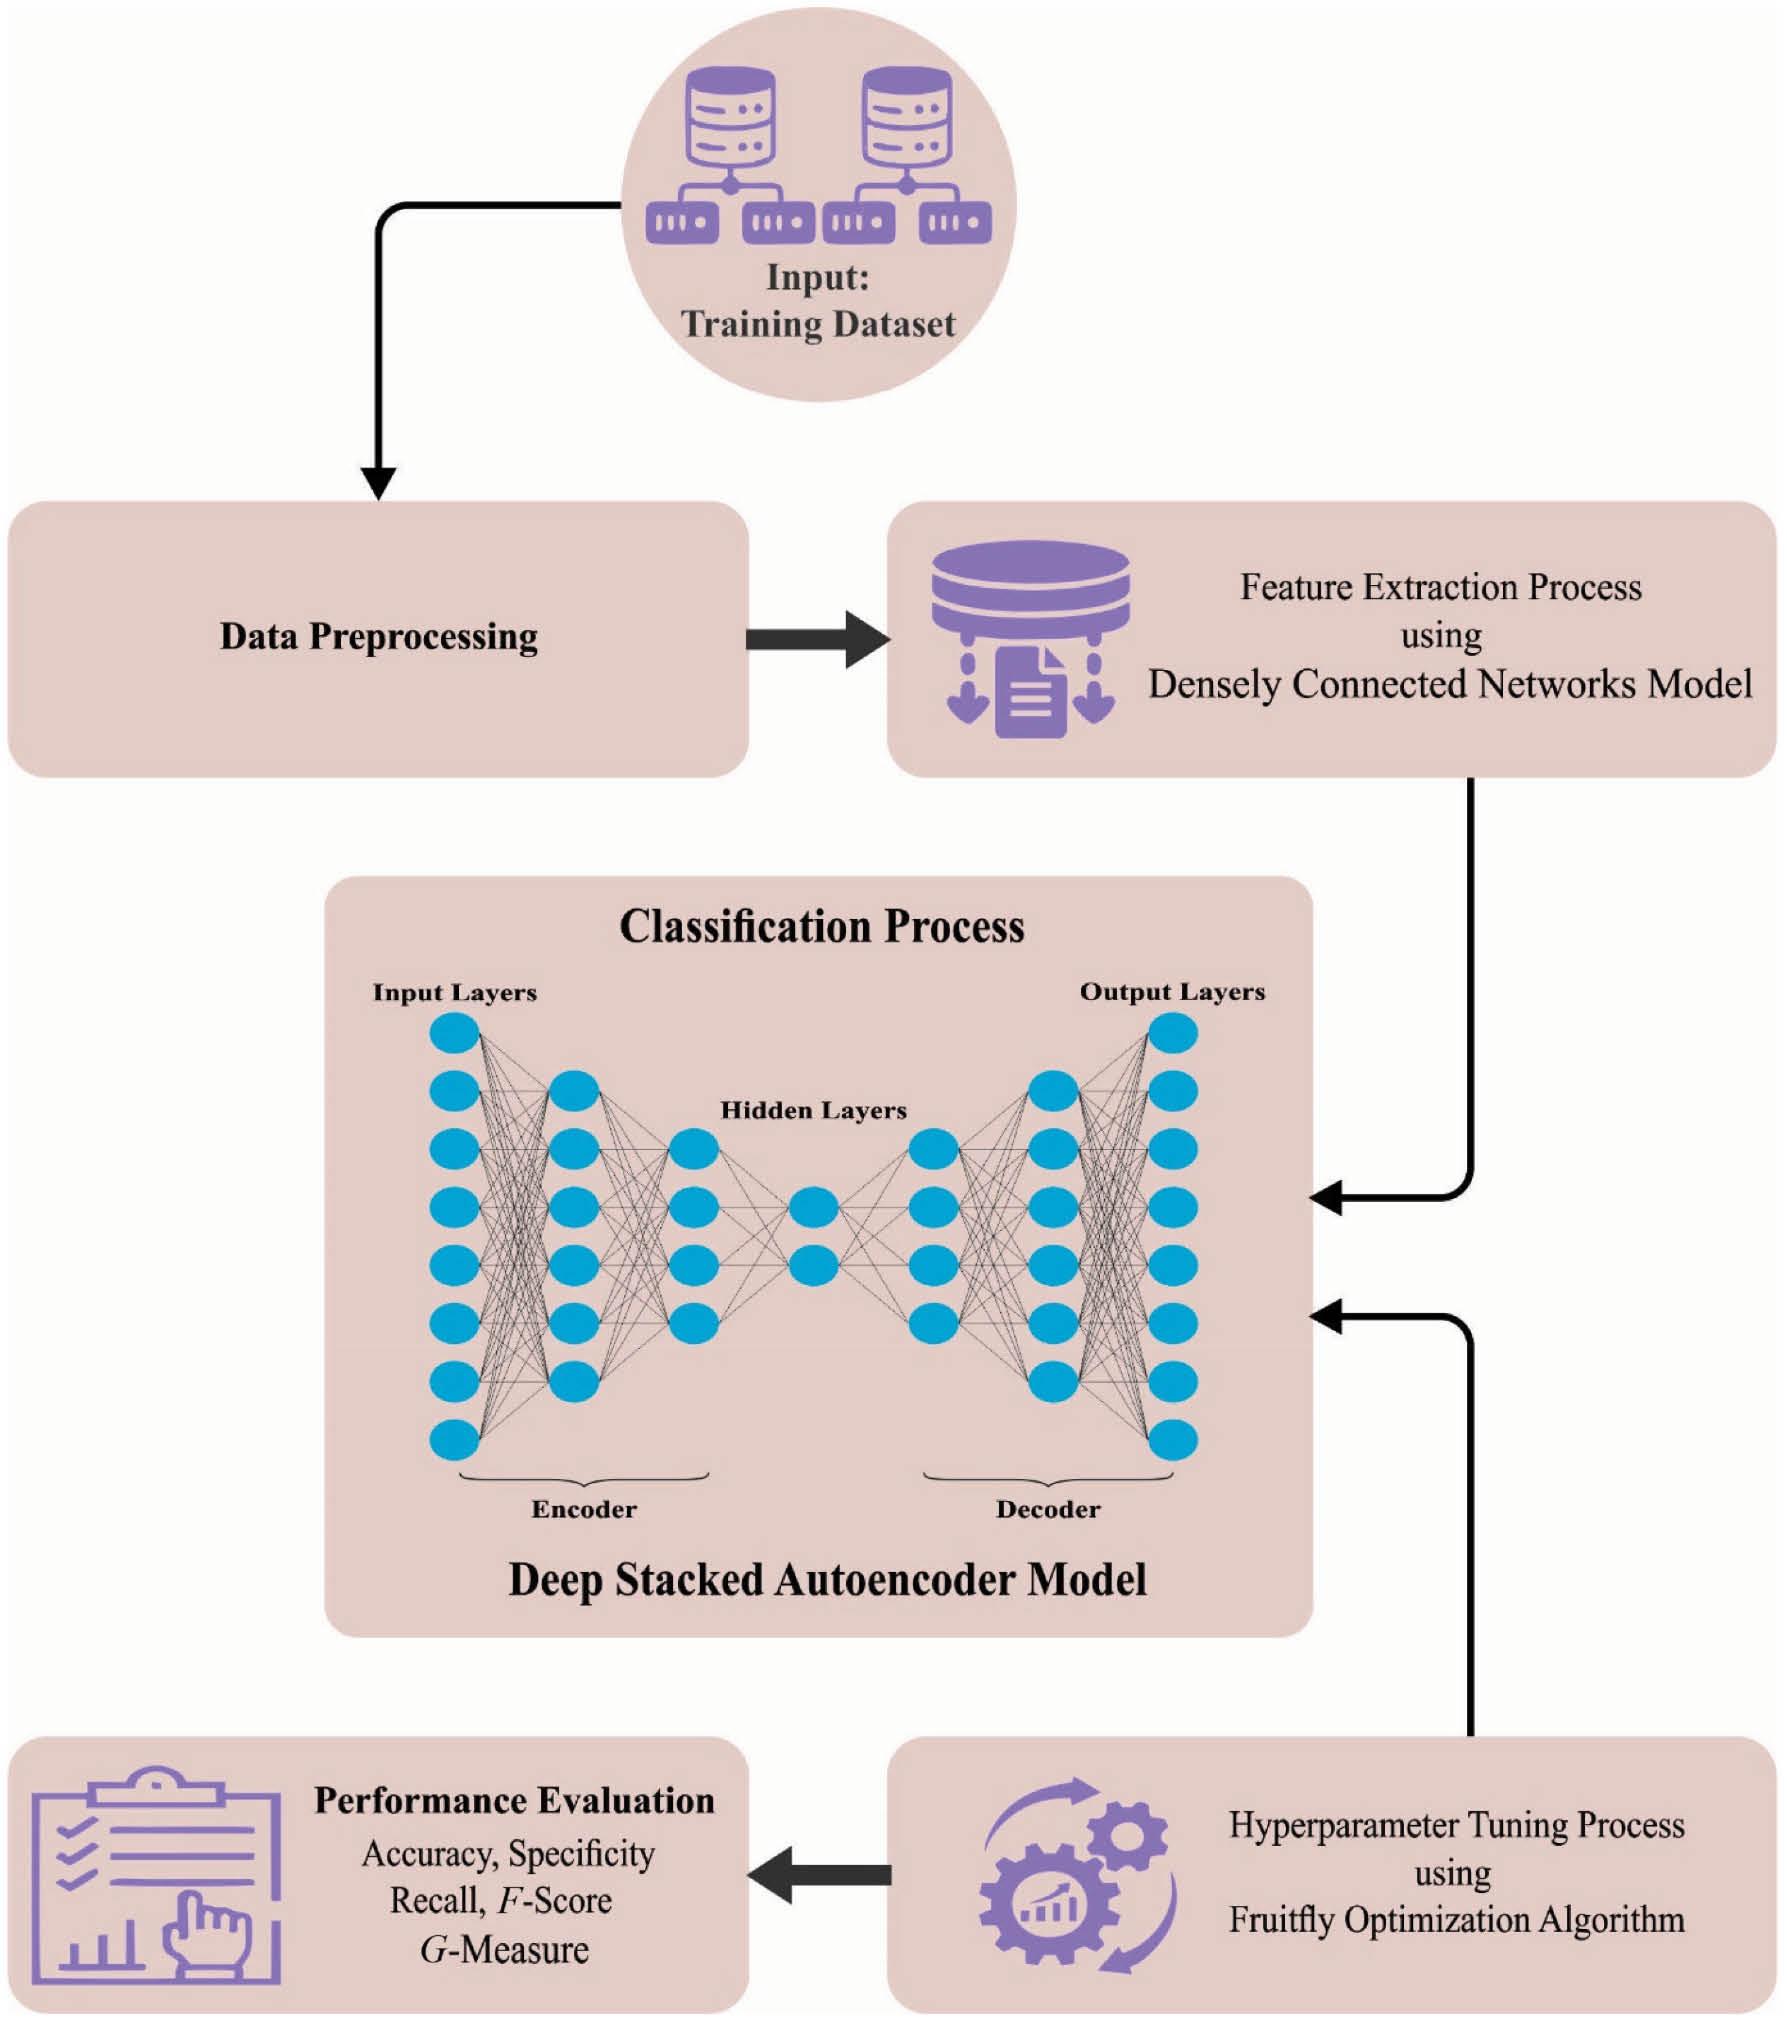
Workflow of the CVDSAE-FAR algorithm. Abbreviation: CVDSAE-FAR, Computer Vision with Optimal Deep Stacked Autoencoder Fall Activity Recognition.
Feature extraction
Initially, the DenseNet model can be exploited for feature extraction purposes. The fundamental concept of the densely connected constructive network (DenseNet) technique is similar to that of ResNet, and it determines a dense connection among every prior and subsequent layer ( Huang et al., 2023). However, the resultant of identity function and H is cumulative which can hinder the data flow from the network. To improve the difficulty of data flow among various layers, DenseNet directly links every input to the output layer. To preserve the feed-forward nature, all the layers attain more inputs in every prior layer and come on their individual mapping feature to every subsequent layer. In DenseNet, all the layers are linked to the size of channels of every preceding layer and are utilized as the input for the next layer. These features allow DenseNet to achieve optimum efficiency over ResNet with some parameters and computational costs. Also optimum parameter efficacy, one major benefit of DenseNets is its enhanced data flow and gradients throughout the network, which make them simple for training. An efficiency difference among the main broadcast procedures of these two kinds of networks exists. The nonlinear transformation formulation of ResNet is as follows:
The nonlinear transformation formula of DenseNet is as follows:
The dense block is a fundamental element of DenseNet, and DenseNet was separated as many dense blocks. During all the nodes of the dense block, an input has a concatenated mapping feature, and the dimensional mapping feature in every dense block is similar. A Transition element was utilized for performing down-sampling transition connections among all the dense blocks. The nonlinear combined function from the dense block mentions the combination of BN + ReLU + Conv.
A whole DenseNet infrastructure that contains three dense blocks and two transition layers. The transition layers link all the dense blocks, composed of convolutional and pooling to downsample and compress the method. All the layers of DenseNet were planned very narrowly to reduce redundancy. Concatenating mapping features learned by distinct layers improves variants from the input of the next layers and enhances efficacy. The network enhances the data flow and gradient, achieving simplicity to train, and the intensive connection was regularized uses, decreasing the over-fitting problem of smaller trained sets.
Activity recognition using DSAE
Here, the DSAE model receives the feature vectors and classifies the activities effectually. An AE is an unsupervised learning configuration-based type, but three layers like output, hidden, and input layers exist ( Balasubramaniam et al., 2023). An input provided to DSA is F aug . At present, the trained procedure is applied in two parts: encoded and decoded. An encoded exploits input data mapping for converting as latent illustration and decoded reconstructs input data in developed latent illustration. For the projected unlabeled input data, {lΔ}DΔ=1, where lΔ∈QI×J, α Δ signifies the vector of hidden encoded obtained in β Δ and the vector of resultant layer decoded is defined by ˆlΔ . Therefore, the encoded procedure was expressed as follows:
where the function of encoded was represented by α, the matrix of encoded weighted is E 1, and H 1 implies the bias vector. The decoded procedure was expressed as follows:
In which the function of decoded was signified utilizing P, the weighted matrix of decoded is E 2, and the bias vector is provided as H 2.
For minimized reconstruction error, an AE parameter fixed is optimized as follows:
where M denotes the loss function M(l,ˆl)=‖l−ˆl‖2 .
Therefore, SAE was executed using three phases. Primarily, input data trained an AE and then obtained the learned feature vector. Second, an input for the next layer is obtained as the preceding layer feature vector and this iteration was maintained still training completion. Lastly, the hidden state train was performed and the BP algorithm was utilized to minimize of cost function weighted can be upgraded by labeled tuning group to attain optimum training. Therefore, the output attained in DSAE is Z d .
FFO-based parameter optimization
Finally, the FFO algorithm can be used for the automated parameter tuning of the DSAE model, which leads to enhanced recognition performance. The FFO technique is an optimized technique which simulates the foraging performance of fruitfly swarms ( Zhang, 2023). In the FFO system, a fruitfly swarm explorations for food by always upgrading the swarm position. The parameters of the fruitfly optimized technique can be simple in infrastructure and easy to alter. When the count of fruitflies is N f , the positions of fruitflies are X axis and Y axis . The fundamental FFO technique upgrades iteration equation was defined in the following formula:
where j refers to the fruitfly serial number, j∈{1,2,⋯,Nf} . t f stands for the fruitfly dimension, tf∈{1,2, ⋯, d} . rand refers to the arbitrary number, rand ∈[0,1]. Rtf represents the search radius of t he tf size of fruitflies.
As the location of the food is unknown, it is essential to compute the distance Dist j among the present individual location of the fruitfly with serial number j and origin and then compute the taste concentration judgment value Sm j . Sm j is the reciprocal of the distance Dist j , and the calculation formula can be defined using the following equation:
The FFO method has determined the merit by its favor concentration values, which can be computed as described in the following equation:
where Smell j denotes the taste concentration function values of the jth individual fruitfly and f s indicates the formula to compute the taste concentration values.
The fitness selection becomes a pivotal factor in the FFO approach. Solution encoding is leveraged to evaluate the candidate solution goodness. Here, to design a fitness function, the accuracy value denoted the main condition used.
From the expression, FP designates the false-positive value and TP signifies the true-positive value.
RESULTS AND DISCUSSION
The HAR outcomes of the CVDSAE-FAR approach can be tested on Multiple Cameras Fall datasets ( Auvinet et al., 2010), encompassing 192 instances and 2 classes as shown in Table 1. Figure 2 signifies the sample images.
Details on database.
| Class | MCF |
|---|---|
| No. of samples | |
| Fall | 96 |
| Nonfall | 96 |
| Total number of samples | 192 |
Abbreviation: MCF, Multiple Cameras Fall.
The suggested technique is put under simulation by employing the Python 3.6.5 tool on PC i5-8600k, 250GB SSD, GeForce 1050Ti 4GB, 16GB RAM, and 1TB HDD. The setups of the parameter are as follows: learning rate: 0.01, activation: ReLU, epoch count: 50, dropout: 0.5, and size of the batch: 5.
Figure 3 portrays the classifier outcomes of the CVDSAE-FAR approach on the test dataset. Figure 3a depicts the confusion matrix presented by the CVDSAE-FAR model on 80% of TRP. The result signified the CVDSAE-FAR approach has recognized 77 samples under Fall and 75 samples under Nonfall. Besides, Figure 3b depicts the confusion matrix offered by the CVDSAE-FAR model on 20% of TSP. The result highlighted that the CVDSAE-FAR method has identified 18 samples in Fall and 20 samples under Nonfall. Similarly, Figure 3c shows the PR study of the CVDSAE-FAR method. The figures reported that the CVDSAE-FAR model has gained higher PR performance under two classes. Eventually, Figure 3d exemplifies the ROC study of the CVDSAE-FAR method. The result portrayed that the CVDSAE-FAR model has productive results with maximal ROC values under two class labels.
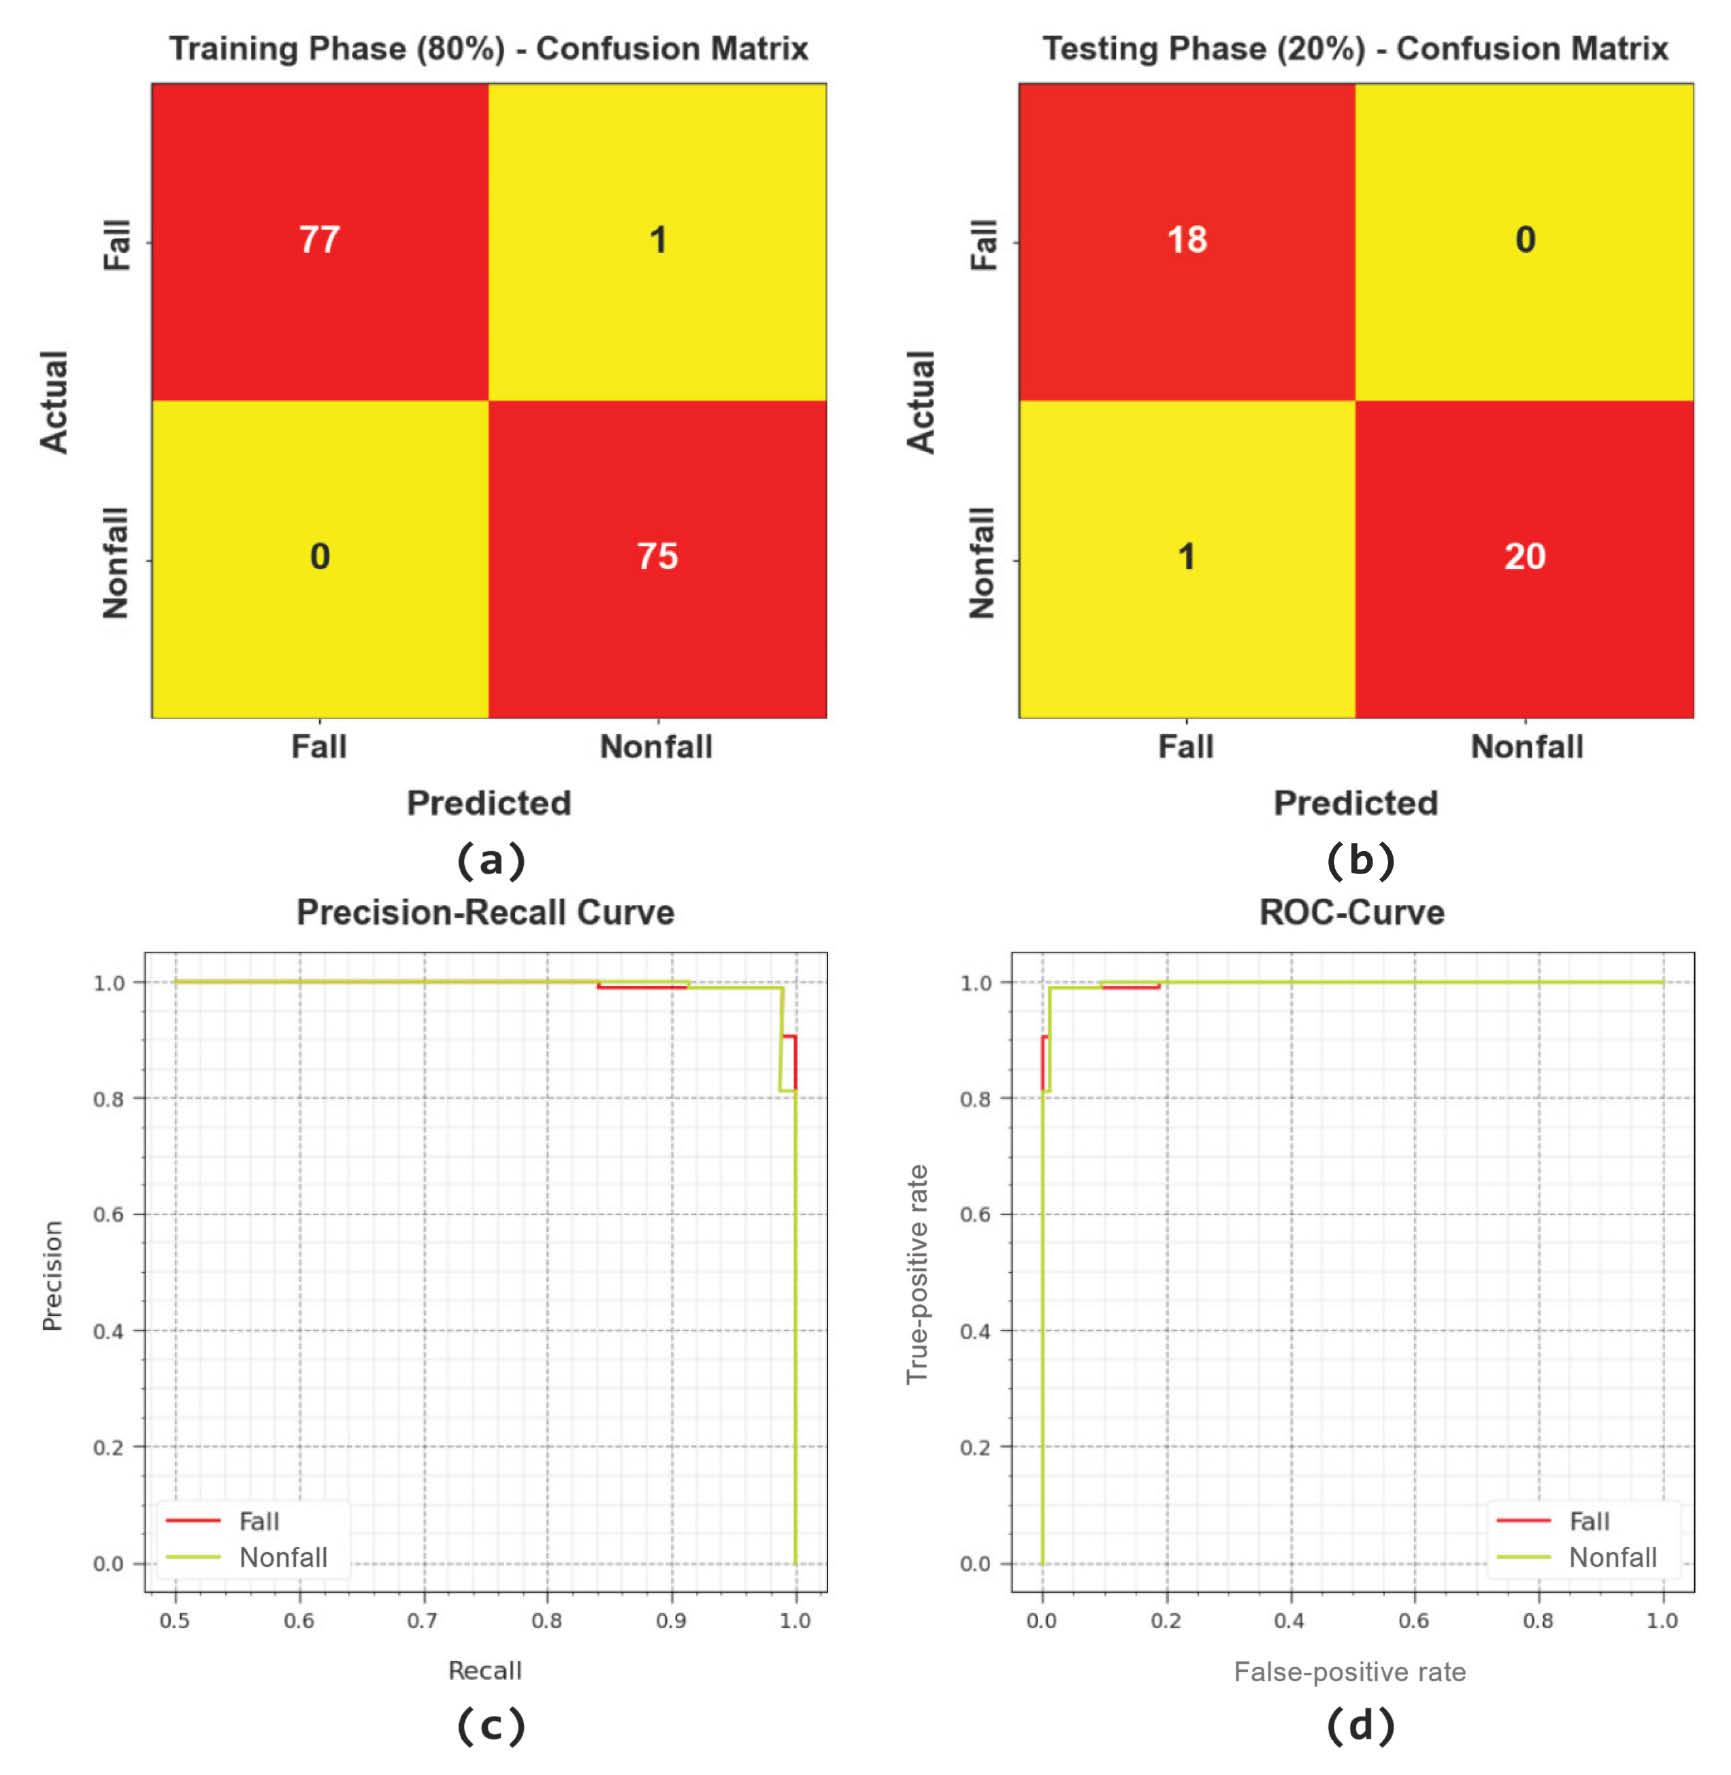
Classifier outcome of the CVDSAE-FAR system: (a,b) confusion matrices, (c) PR-curve, and (d) ROC-curve. Abbreviation: CVDSAE-FAR, Computer Vision with Optimal Deep Stacked Autoencoder Fall Activity Recognition.
The overall HAR outcomes of the CVDSAE-FAR approach are revealed in Table 2 and Figure 4. The result recognized that the CVDSAE-FAR method attains an effectual recognition rate under every class. For example, with 80% of TRP, the CVDSAE-FAR approach provides average accu y , reca l , spec y , F score , and G measure of 99.36, 99.36, 99.36, 99.35, and 99.35%, correspondingly. In the meantime, with 20% of TSP, the CVDSAE-FAR approach provides average accu y , reca l , spec y , F score , and G measure of 97.62, 97.62, 97.62, 97.43, and 97.46%, correspondingly.
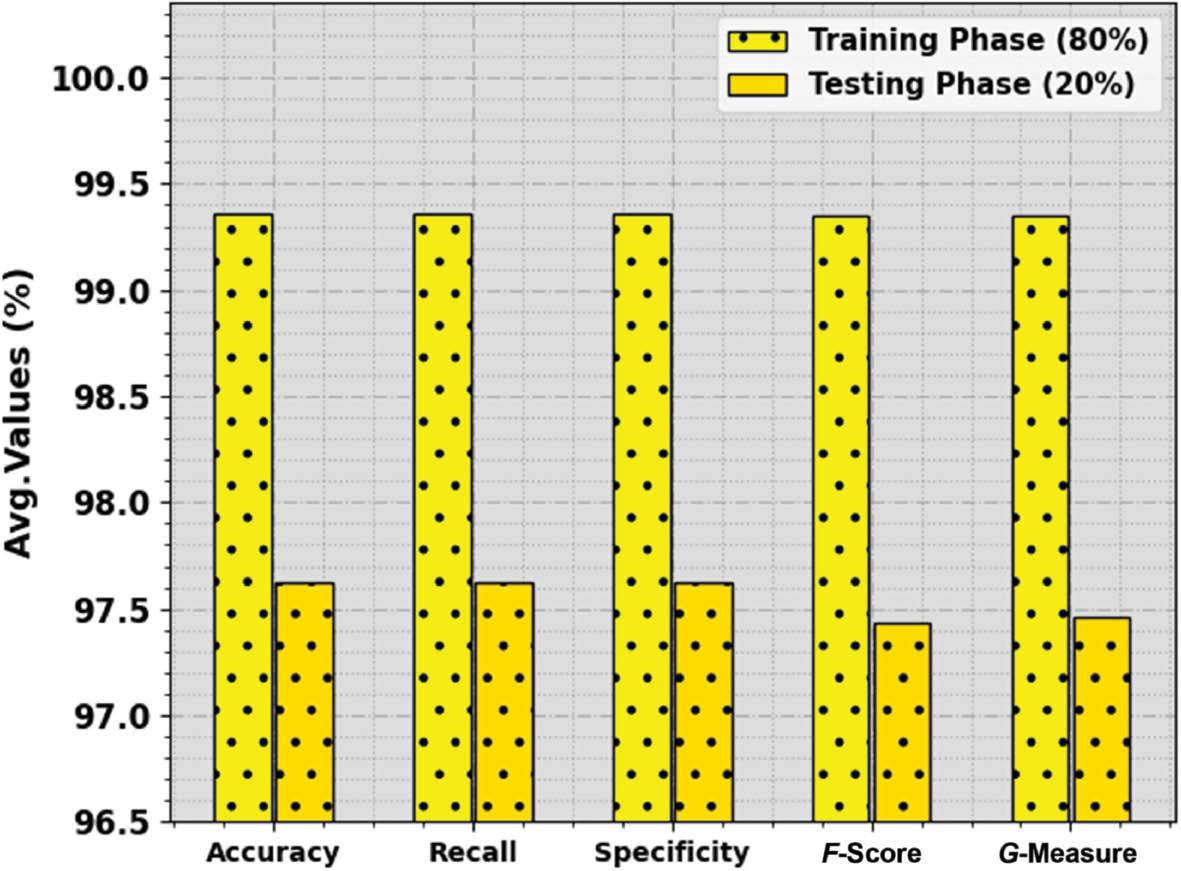
Average outcome of the CVDSAE-FAR approach on 80:20 of TRP/TSP. Abbreviation: CVDSAE-FAR, Computer Vision with Optimal Deep Stacked Autoencoder Fall Activity Recognition.
HAR outcome of the CVDSAE-FAR approach on 80:20 of TRP/TSP.
| Class | Accuracy | Recall | Specificity | F-Score | G-Measure |
|---|---|---|---|---|---|
| Training phase (80%) | |||||
| Fall | 98.72 | 98.72 | 100.00 | 99.35 | 99.36 |
| Nonfall | 100.00 | 100.00 | 98.72 | 99.34 | 99.34 |
| Average | 99.36 | 99.36 | 99.36 | 99.35 | 99.35 |
| Testing phase (20%) | |||||
| Fall | 100.00 | 100.00 | 95.24 | 97.30 | 97.33 |
| Nonfall | 95.24 | 95.24 | 100.00 | 97.56 | 97.59 |
| Average | 97.62 | 97.62 | 97.62 | 97.43 | 97.46 |
Abbreviations: CVDSAE-FAR, Computer Vision with Optimal Deep Stacked Autoencoder Fall Activity Recognition; HAR, human activity recognition.
Figure 5 inspects the accuracy of the CVDSAE-FAR method in the training and validation of the test database. The result highlighted that the CVDSAE-FAR technique attains higher accuracy values over greater epochs. Also, the greater validation accuracy over training accuracy displays that the CVDSAE-FAR method learns productively on the test database.
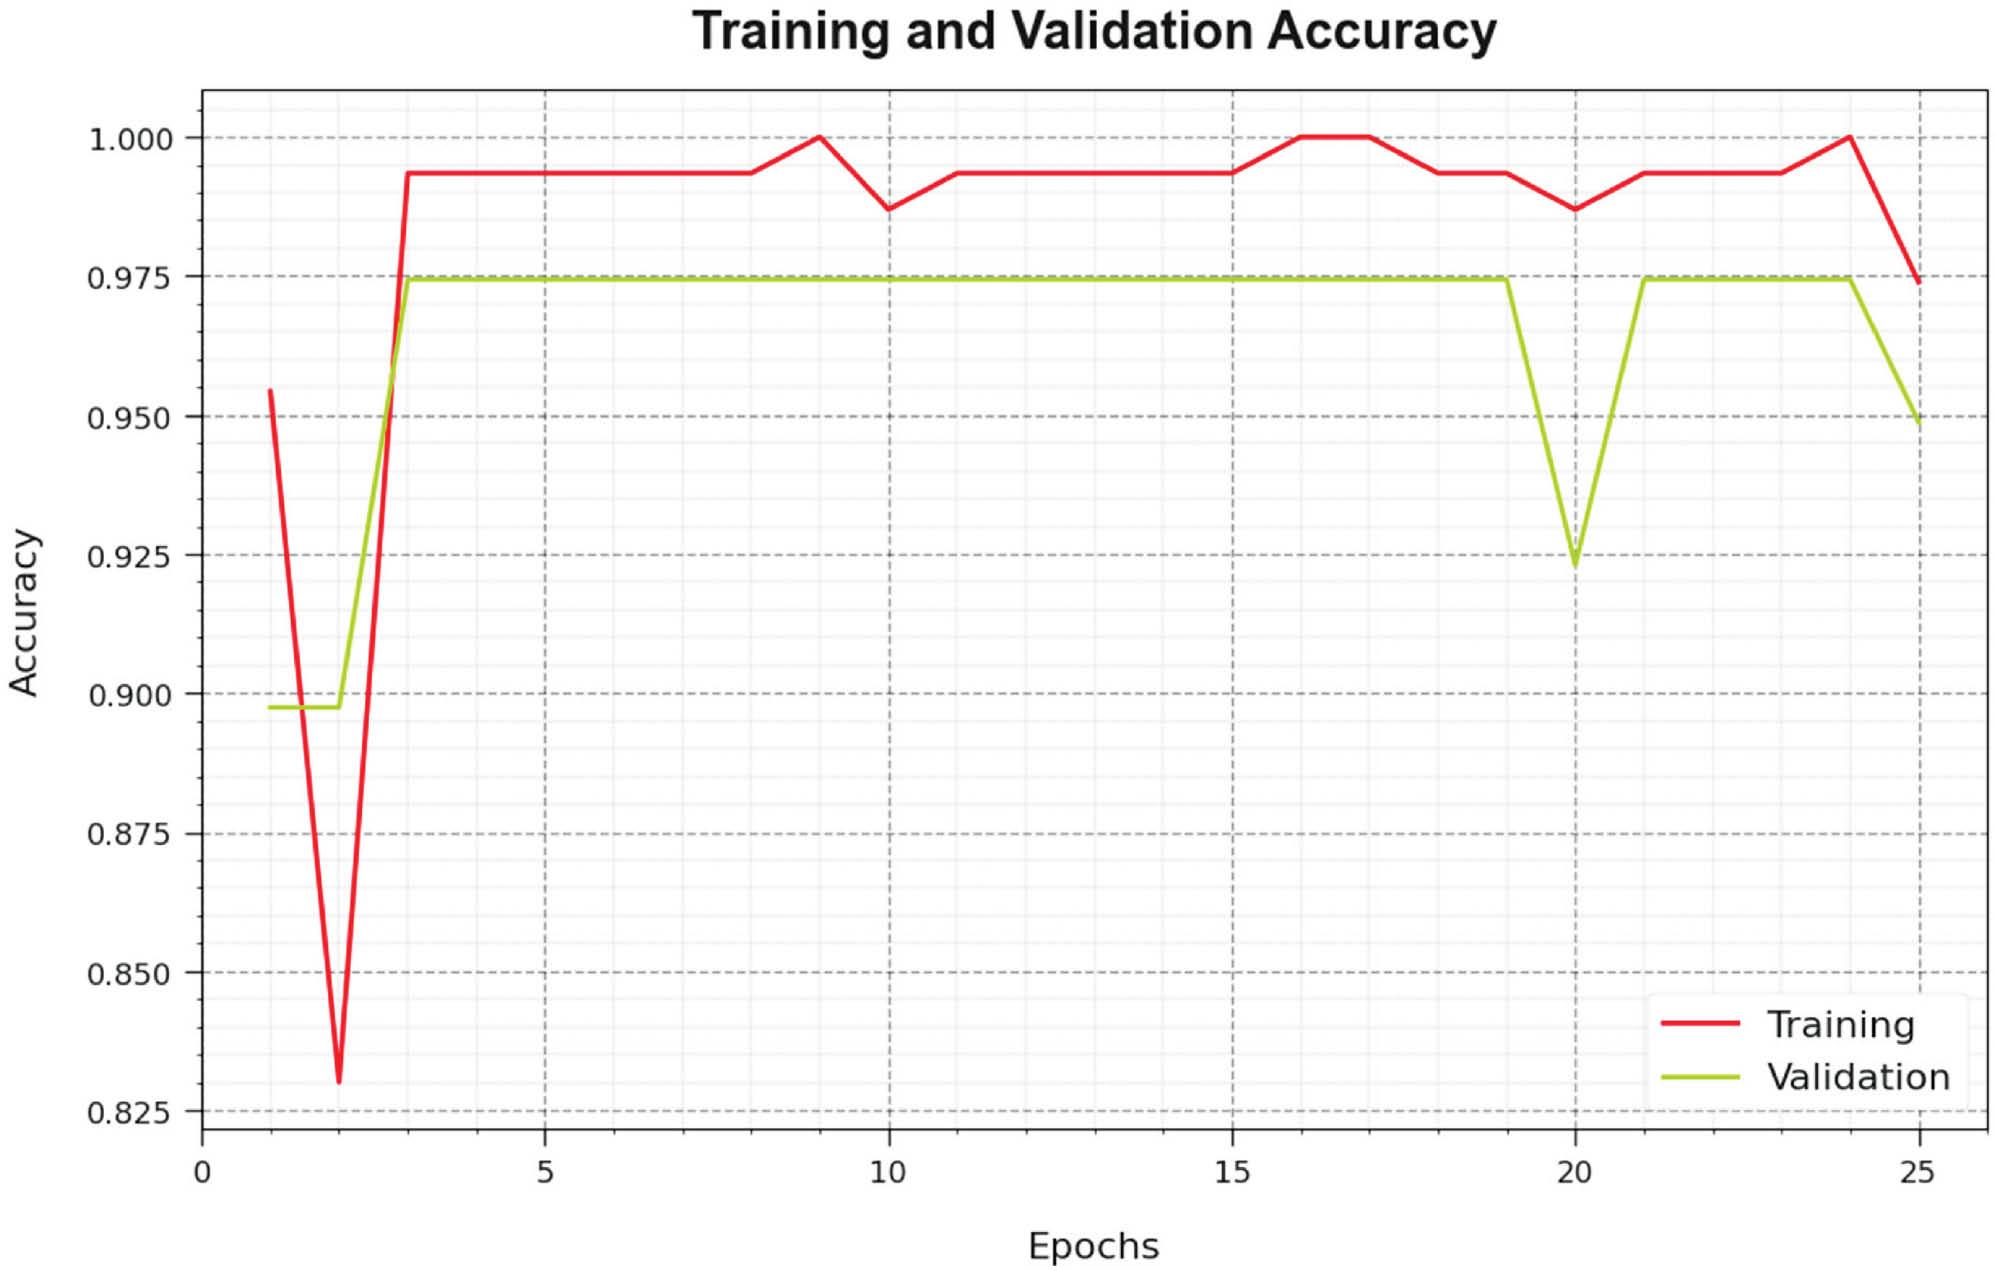
Accuracy curve of the CVDSAE-FAR approach. Abbreviation: CVDSAE-FAR, Computer Vision with Optimal Deep Stacked Autoencoder Fall Activity Recognition.
The loss investigation of the CVDSAE-FAR technique in the training and validation is proven on the test database in Figure 6. The result specifies that the CVDSAE-FAR approach attains adjacent values of training and validation loss. It is observed that the CVDSAE-FAR technique learns productively on the test database.
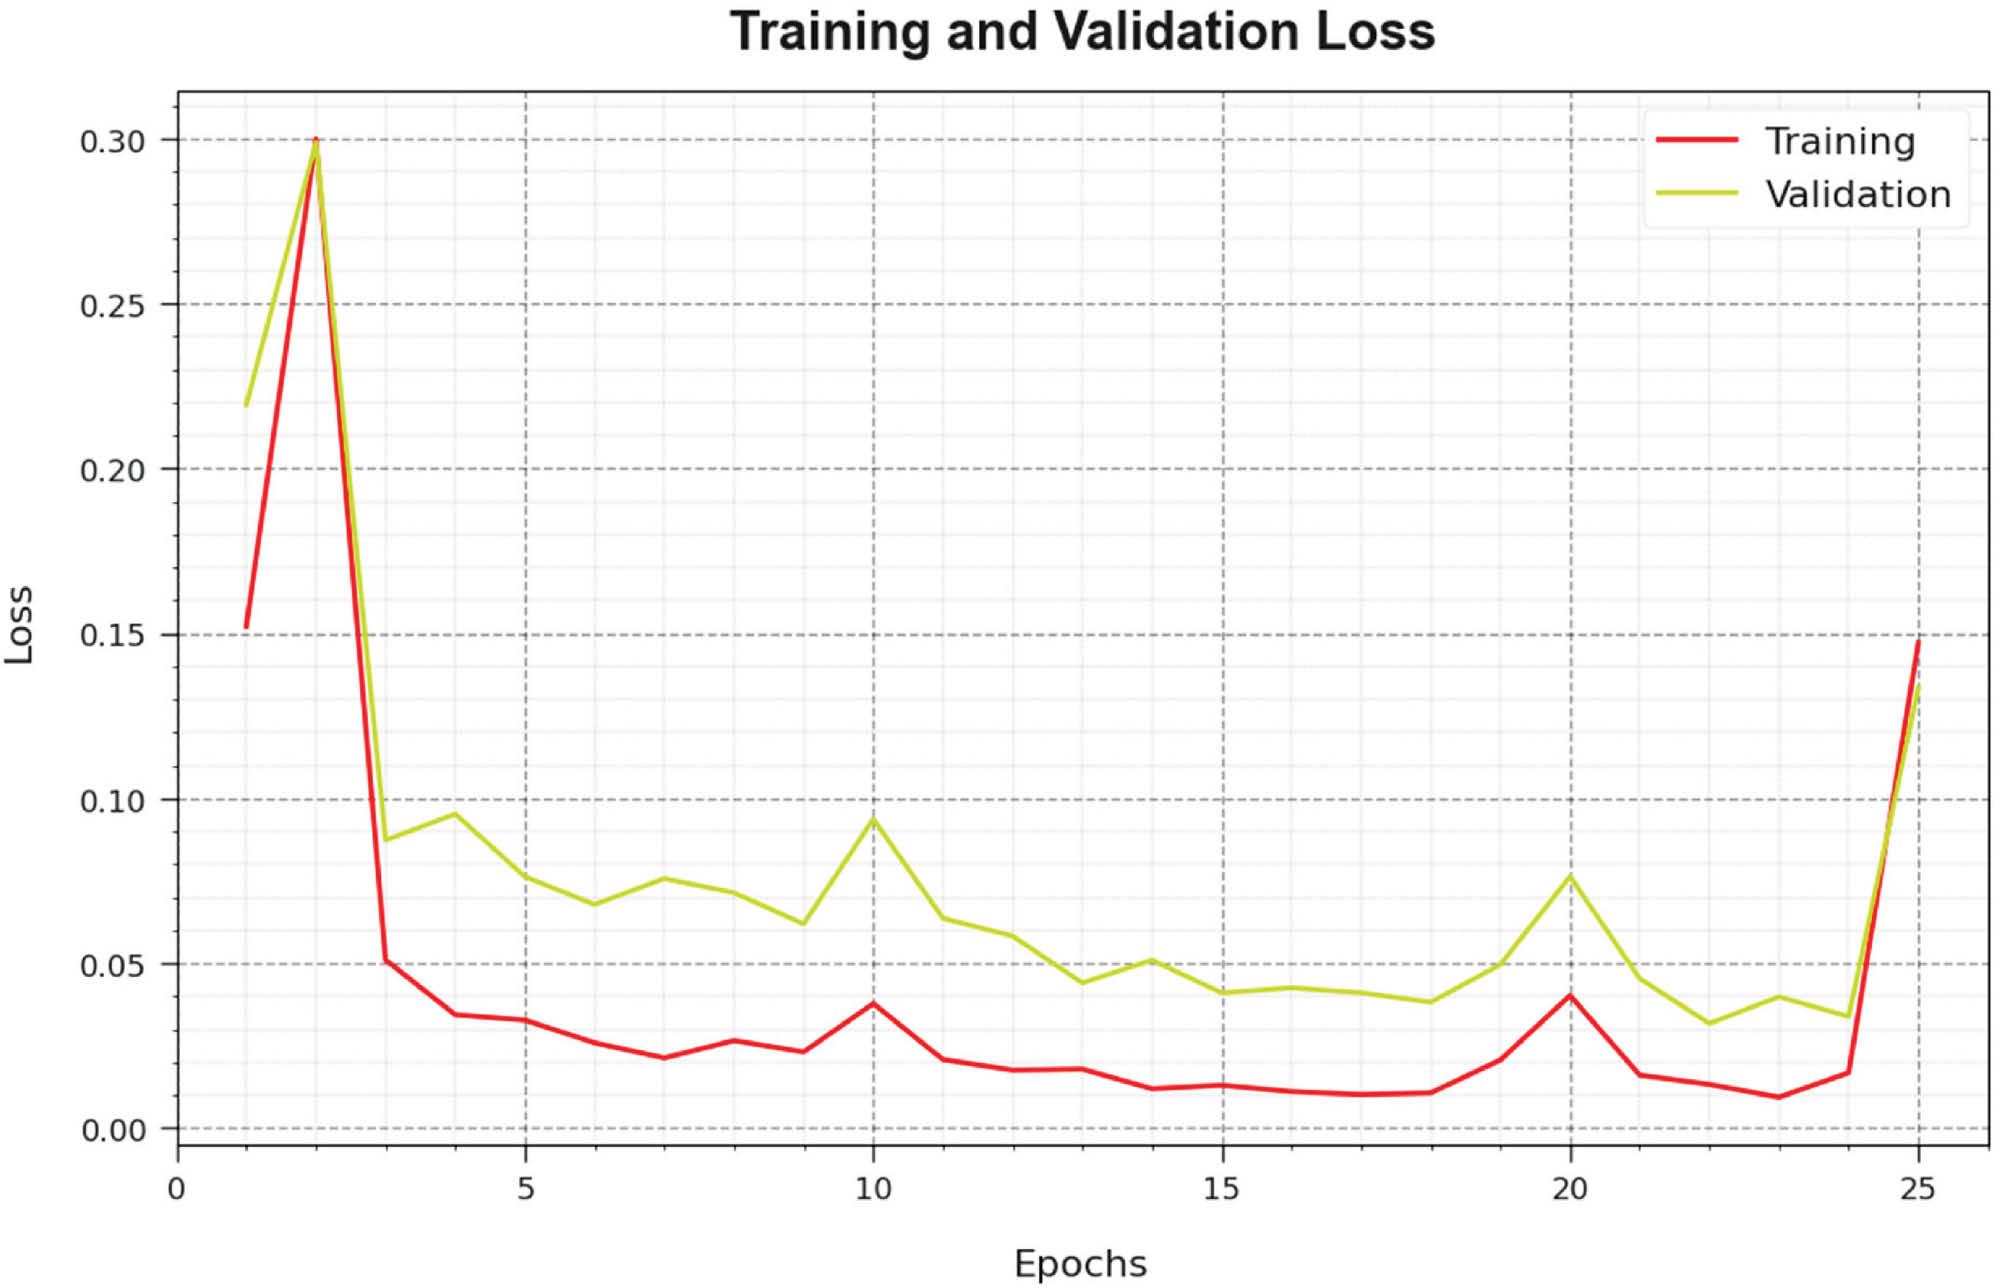
Loss curve of the CVDSAE-FAR approach. Abbreviation: CVDSAE-FAR, Computer Vision with Optimal Deep Stacked Autoencoder Fall Activity Recognition.
In Table 3 and Figure 7, the overall HAR results of the CVDSAE-FAR approach are compared with current methods ( Almalki et al., 2023). The figure recognized that the 1D-CNN, 2D-CNN, and ResNet-50 methods accomplish worse results. Simultaneously, the ResNet-101, VGG-19, and IMEFD-ODCNN approaches have moderately improved performance. In the meantime, the WOADTL-AFD method has attained considerable performance with accu y , reca l , spec y , and F score of 99.08, 97.98, 98.95, and 98.93% correspondingly. However, the CVDSAE-FAR method gains higher outcomes with accu y , reca l , spec y , and F score of 99.36, 99.36, 99.36, and 99.35% correspondingly.
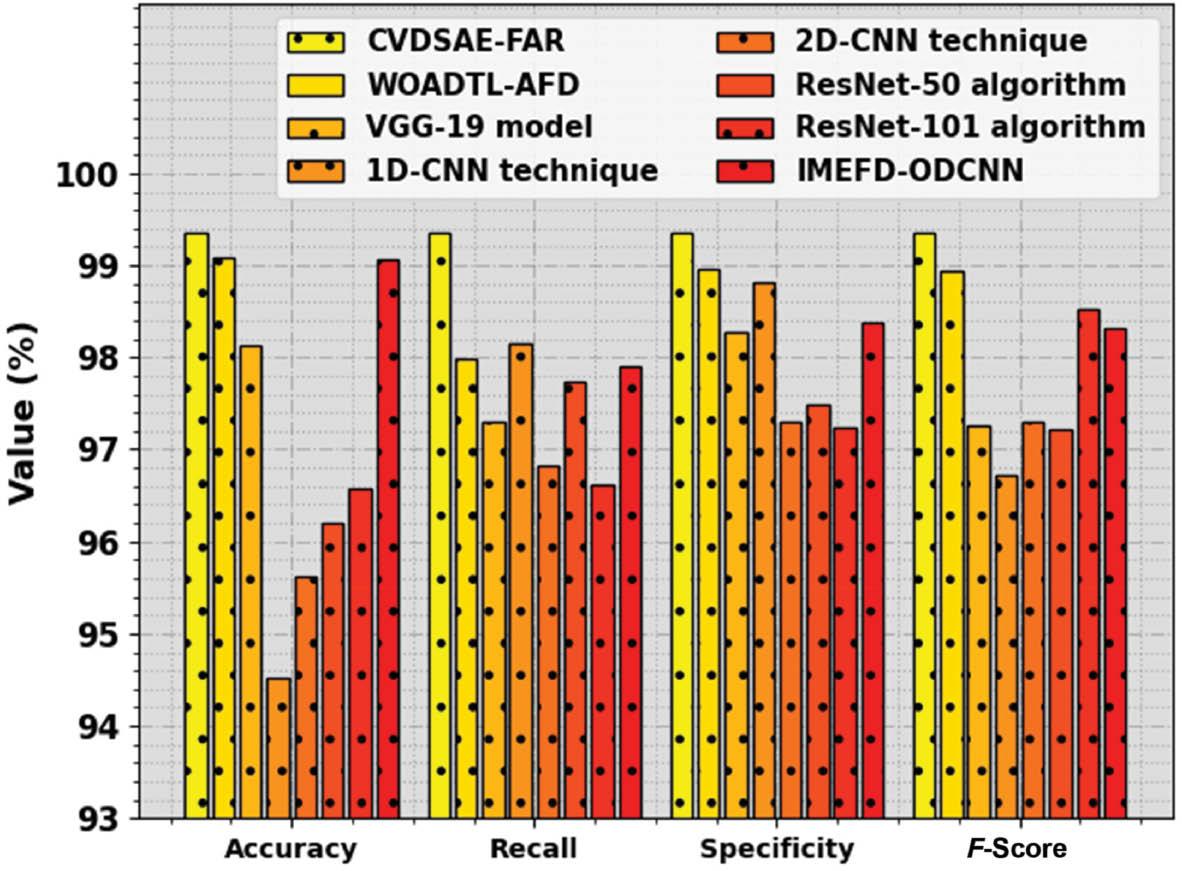
Comparative outcome of the CVDSAE-FAR approach with other systems. Abbreviation: CVDSAE-FAR, Computer Vision with Optimal Deep Stacked Autoencoder Fall Activity Recognition.
Comparative outcome of the CVDSAE-FAR approach with other systems.
| Methods | Accuracy | Recall | Specificity | F-Score |
|---|---|---|---|---|
| CVDSAE-FAR | 99.36 | 99.36 | 99.36 | 99.35 |
| WOADTL-AFD | 99.08 | 97.98 | 98.95 | 98.93 |
| VGG-19 model | 98.12 | 97.31 | 98.28 | 97.26 |
| 1D-CNN technique | 94.53 | 98.16 | 98.81 | 96.71 |
| 2D-CNN technique | 95.63 | 96.82 | 97.31 | 97.31 |
| ResNet-50 algorithm | 96.21 | 97.74 | 97.49 | 97.22 |
| ResNet-101 algorithm | 96.58 | 96.62 | 97.24 | 98.52 |
| IMEFD-ODCNN | 99.06 | 97.91 | 98.37 | 98.31 |
Abbreviation: CVDSAE-FAR, Computer Vision with Optimal Deep Stacked Autoencoder Fall Activity Recognition.
CONCLUSION
In this article, a new CVDSAE-FAR for the classification and identification of fall activities among disabled persons is devised. The presented CVDSAE-FAR technique aims to determine the occurrence of fall activity among disabled persons in the IoT environment. In this work, the CVDSAE-FAR technique comprises a three-stage process such as DenseNet feature extraction, DSAE classification, and FFO-based parameter optimization. Initially, the DenseNet model can be exploited for feature extraction purposes. Besides, the DSAE model receives the feature vectors and classifies the activities effectually. Finally, the FFO algorithm is used for the automated parameter tuning of the DSAE method which leads to enhanced recognition performance. The simulation result analysis of the CVDSAE-FAR method is tested on a benchmark dataset. The extensive experimental results highlighted the supremacy of the CVDSAE-FAR technique compared to recent approaches. In future, the computation complexity of the proposed model will be examined. In addition, the proposed model can be tested on large-scale datasets.


