
1. INTRODUCTION
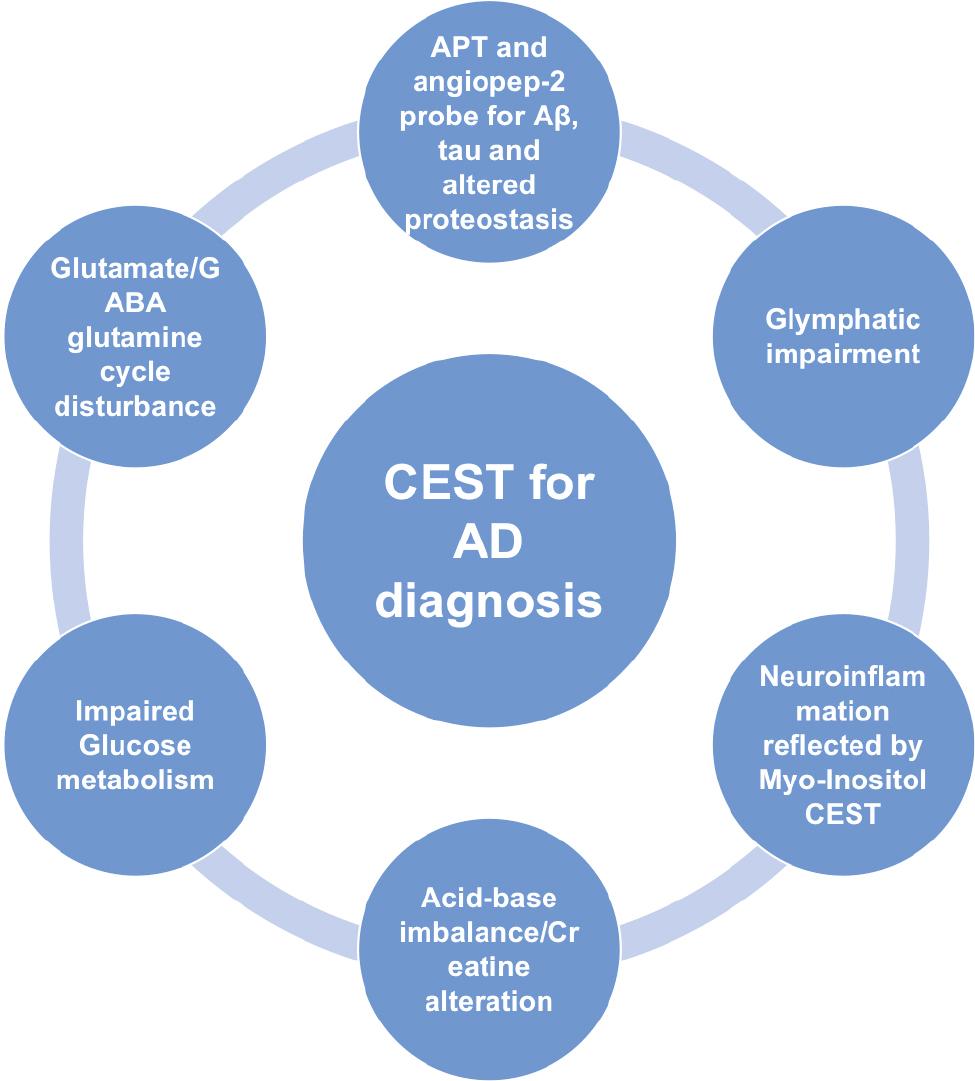
Alzheimer’s disease (AD) is the most common neurodegenerative disease. AD is manifested by age-related, disabling, irreversible, and progressive cognitive impairment and dementia, for which there is currently no cure [1]. Decades have passed since it was first proposed that AD may be caused by the deposition of beta-amyloid peptide (Aβ) in brain tissue plaques; however, anti-amyloid therapies have not provided clinical benefits to patients [2, 3]. Accumulating evidence supports the notion that early diagnosis and intervention may result in less cognitive and functional decline [3–8]. Therefore, prospective biomarkers are crucial in assessing AD treatment response and pathophysiologic alterations [9–12]. In addition to cerebrospinal fluid and plasma biomarkers, medical imaging has a very important role in enhancing our understanding of AD pathophysiology. Compared to other imaging modalities, chemical exchange saturation transfer (CEST) MRI, as a molecular technique, reflects the pathophysiologic process without radiation risk and implementation in the clinical MRI scanner is feasible. In this review we focus on different aspects of the pathophysiology underlying AD detected by CEST ( Figure 1 ) ( Tables 1–4 ), emphasizing the potential, limitations, and prospects.
The pathophysiology of Alzheimer’s disease revealed by chemical exchange saturation transfer MRI.
APT applied in different animal models and human studies of AD.
| Experimental group | Control group | Parameters (in vivo) B0(T)/Power(ut)/Saturation time (ms) | CEST scans (Slices/Offsets), Offset Range, CEST MRI analysis methods | Indications | References |
|---|---|---|---|---|---|
| APPswe; PS1ΔE9 mice | C57BL/6J mice | 11.7/0.9-1.5/12000 | 1/Not provided, −8 to 8 ppm, MTRasym (3.6 ppm) with control image at 8 ppm | A significant decrease in signal at −3.6 ppm, but not at 3.6 ppm in the cortex, corpus callosum, and thalamus | [37] |
| rTg4510 mice | Wild-type mice | 9.4/Not provided/Not provided | 1/80, −6 to +6 ppm, area under the MTRasym curves between 3.3 and 3.7 ppm | Decreased APT signal (3.5 ppm) in the presence of tau pathology, increased after doxycycline treatment (suppression of tau) | [38] |
| rTg4510 mice | Wild-type mice | 9.4/Not provided/Not provided | 1/80, −6 to +6 ppm, area under the MTRasym curves between 3.3 and 3.7 ppm | Reduced APT signal (3.5 ppm) in the cortex and hippocampus but not thalamus | [39] |
| SD rats received intracerebroventricular injection of Ab1-40 | Sham-operated SD rats | 7/1.3/4000 | 1/102, −5 to +5 ppm, MTRasym and MTRSAFARI | Reduced APT signal (3.5 ppm) in the hippocampus, cortex, and whole brain, with significant neuronal loss in the hippocampal CA1 region and cortex compared with sham-operated rats | [40] |
| aMCI patients | Normal control | 3/2/800 | 1/32, −6 to +6 ppm, MTRasym | The APTw values (3.5 ppm) in 9 of 12 ROIs were higher in the aMCI group than in the normal control group | [43] |
| AD patients | Normal control | 3/2/200*4 | 1/32, −6 to +6 ppm, MTRasym | Increased MTR Asym (3.5 ppm) values of bilateral hippocampus in AD patients and the strong correlations with the MMSE | [44] |
| aMCI patients | Normal elderly control | 3/Not provided/Not provided | Not provided, Not provided, MTRasym | The APTw values (3.5 ppm) of the bilateral hippocampus and amygdala in the aMCI group were higher | [45] |
| Dementia patients | Control | 3/2/200*4 | Whole-brain 3D/38, −5 to +5 ppm, Lorentzian-Fitted, MTRasym | Higher signal at 3.5 ppm in the hippocampus of the dementia group | [46] |
GluCEST, CrCEST and MICEST applied in different animal models of AD.
| Experimental group | Control group | Parameters (in vivo) B0(T)/Power(ut)/Saturation time (ms) | CEST Scans (Slices/Offsets), Offset Range, CEST MRI analysis methods | Indications | References |
|---|---|---|---|---|---|
| GluCEST | |||||
| APP-PS1 mice | Wild-type mice | 9.4/250Hz/1000 | 1/52, −5 to +5 ppm, MTRasym | Reduced GluCEST (3 ppm) in the whole brain, especially the hippocampus | [55] |
| PS19 mice | Wild-type mice | 9.4/5.9/4*250 | 1/14, ± 2.4–3.6 ppm, MTRasym | Glutamate loss (3 ppm) is associated with synapse loss | [56] |
| PS19 mice | Wild-type mice | 9.4/5.87/4*250 | 3/10, ± 2.5 – 3.5 ppm, MTRasym | Longitudinal, GluCEST contrast (3 ppm) reduction in the early stage | [57] |
| 5xFAD mice | Wild-type mice | 7/5/8*100 | 2/52, −5 to +5 ppm, MTRasym | GluCEST effects (3 ppm) were reduced before hypoperfusion occurred in part of the cortex and hippocampus | [58] |
| CrCEST | |||||
| Tau4RDK and APP/PS1 mice | C57BL/6J mice | 11.7/2/1000 | 1/52, 1 to 3.5 ppm, R-spectrum | Decreased CrCEST contrast of the cortex and corpus callosum, detected pH alteration as early as 6-7 months | [59] |
| MICEST | |||||
| APP-PS1 mice | Wild-type mice | 9.4/75Hz/5000 | 1/22, 0-2 ppm, CESTasym | ˜50% higher MICEST (0.6 ppm) contrast in the brains of AD mice | [60] |
| APP-PS1 mice | C57BL6/J | 9.4/0.9/1600 | 1/42, −4-4 ppm, MTRasym | CEST MRI (0.6 ppm) was sensitive detecting the inflammatory challenge in mice | [61] |
Gluco-CEST applied in different animal models and human studies of AD.
| Experimental group | Control group | Parameters (in vivo) B0(T)/Power(ut)/Saturation time (ms) | CEST scans (Slices/Offsets), Offset Range, CEST MRI analysis methods | Indications | References |
|---|---|---|---|---|---|
| APP/PS1 mice | C57BL/6 mice | 3/3.1/60 for parenchyma and 900 for CSF | On VDMP sequence, 1/1, MTRasym with fitting | Higher uptake in parenchyma of young (6 months) transgenic AD mice, while lower uptakes in parenchyma and CSF of old (16 months) AD mice | [79] |
| Tau4RDK mice | C57BL/6J mice | 11.7/variable/36 and 300 | On VDMP sequence, 1/1, T1q theory | Reduced D-glucose uptake in the cortex and CSF of AD mice at 7-8 months; clearance of D-glucose in the wild-type, but not AD mice | [82] |
| APP23 | C57BL/6N | 7/1.5/4000 | 1/58, −20 to +20 ppm, Lorentzian-Fitted, MTRasym (1-2.3 ppm), area under the curve | A reduction of glucose uptake in different brain regions | [77] |
| Injecting aggregated Ab 25–35 into the right lateral ventricle of SD rats | Injecting normal saline into the right lateral ventricle of SD rats | 7/1.5/5000 | 1/62, −3 to +3 ppm, MTRasym | Reduced glucose uptake (0.9 ppm) in the total brain, hippocampus, and parietal cortex correlate with myo-Inositol detected by MRS | [84] |
| rTg4510 | Wild-type | 9.4/Not provided/Not provided | Not provided, Not provided, area under the MTRasym curve | higher CEST contrast only in the cortex, but not in other regions | [39] |
Different CEST applications revealing pathophysiology of AD.
| CEST applications | Relations to the pathophysiology of AD | Limitations | References |
|---|---|---|---|
| Endogenous | |||
| APT | Reflecting Aβ deposition, tauopathy, and altered proteostasis; early diagnosis | Inconsistent results due to complicated pathophysiologic processes and confounding factors of the technique | [37–40, 43–46] |
| Glu/GABA CEST | Glutamate/GABA-glutamine metabolic cycle disturbance; early diagnosis | Only applied in 7T MRI scanner or higher | [55–58] |
| CrCEST | Acid-base imbalance/Creatine alteration | No longitudinal study, solely one animal study | [59] |
| MICEST | Neuroinflammation | No longitudinal study, solely two animal studies | [60, 61] |
| Exogenous | |||
| Angiopep-2 CEST | Aβ deposition | Injection required | [52] |
| GlucoCEST | Impaired glucose metabolism or glymphatic system | Injection required | [82] |
2. BASIC PRINCIPLES OF CEST
CEST is a molecular technique, the details of which have been previously reviewed [13–16]. CEST belongs to the family of saturation transfer (ST) and a dual-pool model is proposed for understanding the mechanism mathematically [15]. Pool A is the solute pool with exchangeable protons that resonate at a specific frequency; pool B is the water pool. By applying a selective RF irradiation at the solute frequency, the saturated solute protons transfer to the bulk water pool via chemical exchange, thus resulting in loss of the water signal and indirect detection of the solute signal. Continuous transfer amplifies the solute signal, which by convention is in a very low concentration range (μM-to-mM) and not detected by standard MR [17]. For successful CEST imaging, some requirements must be fulfilled. First, the chemical shift difference between the solvent and solute (ΔCS) should be greater or equal to the exchange rate ([kex=kAB+kBA]: kex<ΔCS). If the chemical shift difference is too small, saturation of the solute protons results in partial saturation of the water pool, which is referred to as the direct saturation effect. In addition, though the exchange rate should be large enough to enhance the CEST effect, in order to maintain a discrete spectral difference between water protons and the solute protons, it must remain in the slow to intermediate exchange rate domain [18]. Second, the exchange rate must be greater than the longitudinal relaxation rate (R1A) of the solute protons so that before complete relaxation, there is enough time for chemical exchange.
The most common metric used for CEST analysis is magnetization transfer asymmetry (MTRasym), which is defined as follows:
where S0 refers to the water signal intensity that is obtained without pre-saturation applied, and Ssat(Δω) and Ssat(-Δω) refer to the signal intensities that are obtained after applying pre-saturation pulses at Δω and -Δω, respectively ( Figure 2 ) [13, 19].
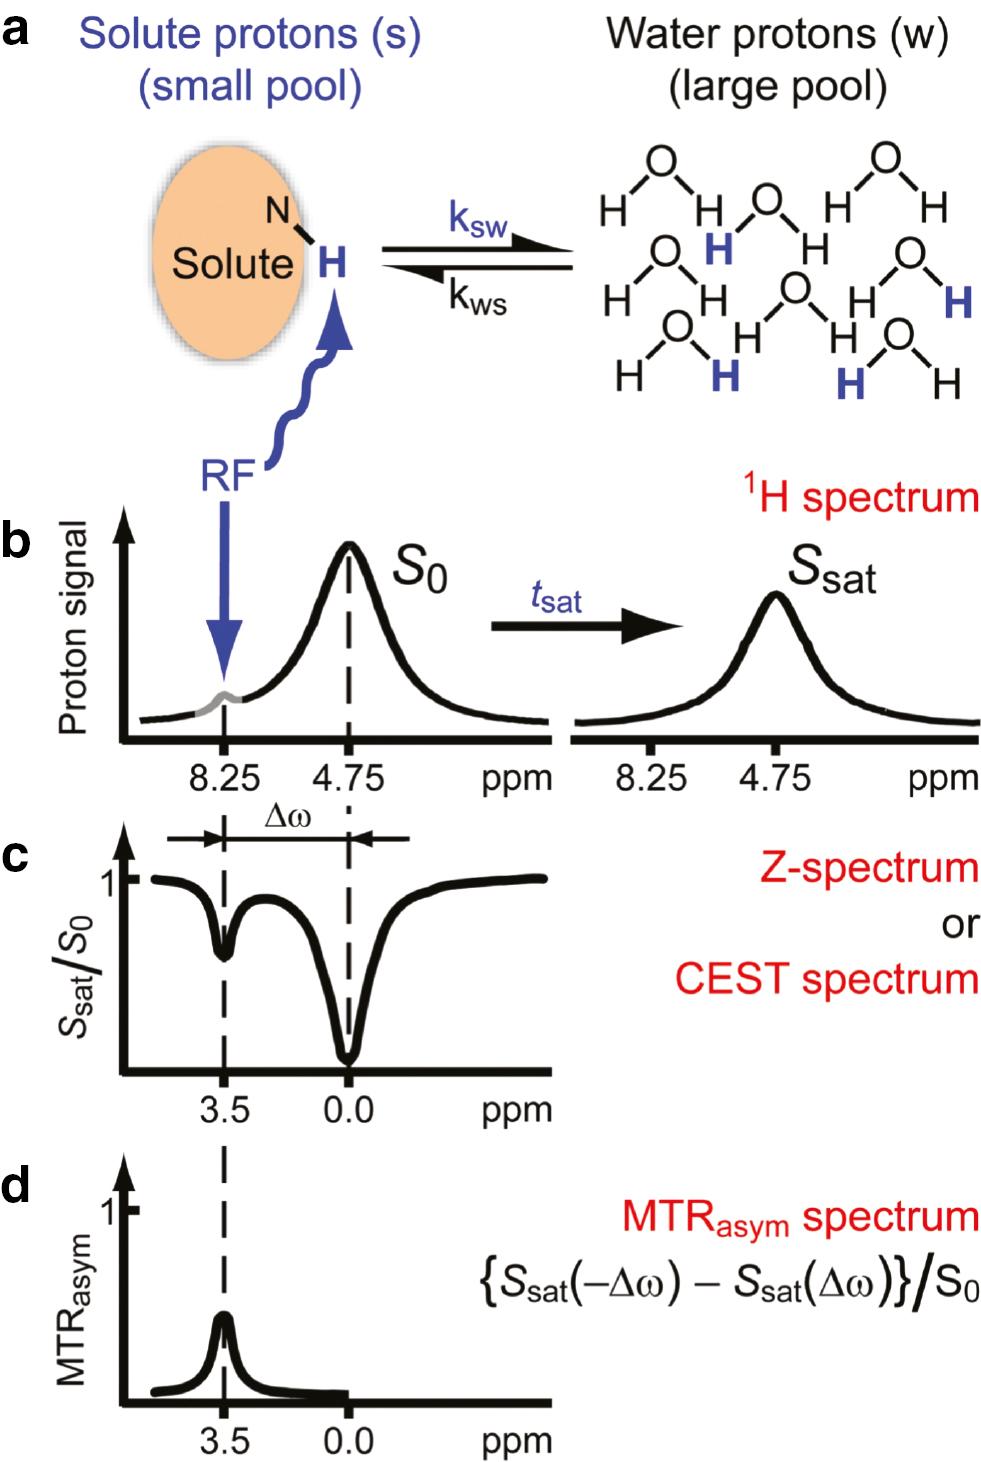
Chemical exchange saturation transfer (CEST): principles and measurement approach for pure exchange effects.
(a, b) Solute protons (blue) are saturated at their specific resonance frequency in the proton spectrum (here 8.25 ppm for amide protons). This saturation is transferred to water (4.75 ppm) at exchange rate, ksw, and non-saturated protons (black) return. After a period (tsat), this effect becomes visible on the water signal (B, right). (c) Measurement of normalized water saturation (Ssat/S0) as a function of irradiation frequency, generating a so-called Z-spectrum (or CEST or MT spectrum). When irradiating the water protons at 4.75 ppm, the signal disappears due to direct (water) saturation (DS). This frequency is assigned to 0 ppm in Z-spectra. At short saturation times, only this direct saturation is apparent. At a longer tsat, the CEST effect becomes visible at the frequency of the low-concentration exchangeable solute protons, now assigned to 8.25 - 4.75 = 3.5 ppm in the Z-spectrum. (d) Result of the magnetization transfer ratio (MTR = 1 – Ssat/S0) asymmetry analysis of the Z-spectrum with respect to the water frequency to remove the effect of direct saturation. Hereafter we will use the standard NMR chemical shift assignment for water at 4.75 ppm in 1H spectra, while the 0 ppm assignment will be used in Z-spectra. ©Reprinted with permission from [19], Copyright 2011 John Wiley & Sons, Ltd. (license number, 5463600328053).
Several other factors also contribute to optimizing the CEST effects, as follows: 1) B0 and B1 homogeneities are essential. Inhomogeneities can cause insufficient saturation of the exchanging pool and result in artifacts. B0 and B1 corrections should be performed to minimize the artifacts [13, 20, 21]. 2) The magnetization transfer (MT) and nuclear overhauser effect (NOE) should be minimized. ST can occur via chemical exchange or cross relaxation through space [22, 23]; it is difficult to separate these two processes. In addition to CEST, MT and NOE are two effects generated through ST that have been extensively investigated. CEST effects are typically affected by MT and NOE in vivo. Different methods have been developed to disentangle these effects [24–26]. 3) At higher fields, the CEST effect may be increased because T1w increases with field strength, which allows prolonged storage of saturation in the water pool. In addition, at higher fields the interference of direct water saturation is reduced [19].
3. DISCUSSION: DIFFERENT ASPECTS OF THE PATHOPHYSIOLOGY OF AD DETECTED BY CEST
3.1 Aβ, tau, and altered proteostasis
The direct cause of AD remains unclear, although there are various hypotheses [27], among which the amyloid cascade hypothesis is regarded as the theoretical construct. According to the amyloid cascade hypothesis, after initiation by Aβ deposition, progressive tau phosphorylation and tangle formation start, resulting in neuronal death, which finally leads to dementia [2, 28–30]. This Aβ, tau and altered proteostasis-related pathophysiologic process can be detected by endogenous or exogenous CEST. Amide proton transfer-weighted (APTw) is the most commonly used method for endogenous CEST to evaluate and quantify Aβ pathology, tauopathy, and altered proteostasis.
APTw imaging belongs to the molecular MRI technique and generates image contrast based on endogenous mobile proteins and peptides in tissue [17, 31]. APTw has been extensively used as a biomarker in brain tumors and to probe pH in stroke. In addition to the mobile amide concentration, pH is another crucial factor that affects APT signal intensity [32–34]. As an endogenous contrast technique, the signal is influenced by many factors. Over recent decades there has been considerable evolution in understanding the APTw contrast mechanism, especially in applying APTw to probing brain tumors status, in which a consensus has been reached [35]. In recent years, APTw has also been used in AD, with a primary focus on early diagnosis and progression. Unlike the application of APTw in brain tumors, the understanding of APTw in AD is limited because APTw is still in its infancy.
AD is a neurodegenerative disease that is characterized by the deposition of amyloid plaques and neurofibrillary tangles (NFTs). The extracellular amyloid plaques are mainly composed of Aβ, and NFTs are mainly comprised of tau [36]. APTw is used to diagnose AD by detecting altered proteostasis as related to Aβ pathology and tauopathy. Animal models are designated based on these hallmarks of AD pathology [37–40]. The transgenic rTg4510 mouse is an animal model of tauopathy. Using this model, a reduction in APT within the rTg4510 mice compared to wild-type c was observed in the cortex and hippocampus, but not in the thalamus. In addition, after treatment with doxycycline for several months, which suppresses the expression of mutant tau protein, the APT signal was less altered [38]. These experiments demonstrated that it is feasible to use APTw to detect tauopathy in patients with AD. Another study developed an animal model of AD by the intracerebroventricular injection of Aβ1-40 [40]. In this study [40] the APT signal was reduced in the AD model compared to the control group. In addition, application of the saturation with frequency alternating RF irradiation method improved the diagnostic accuracy. Based on these limited animal studies, it was deduced that APTw has the potential to detect tauopathy and Aβ pathology in AD, and the altered proteostasis was shown to have a decreased signal on APTw imaging; however, the mechanism underlying this phenomenon is still unclear. One possible explanation is that the relatively small and soluble Aβ and tau proteins become aggregations of insoluble amyloid deposits and NFTs in patients with AD [41], which would attenuate the chemical exchange between amide protons and water protons. Acidosis in the brain is another factor that may cause decreased APT values in the AD model brains [17]. The pH is reduced in the APP-PS1 mouse model brains of AD [42]. A lower pH reduces the exchange rate of amide protons, resulting in a decreased APT signal intensity. The APPswe/PS1ΔE9 mouse, which develops Aβ deposits by 6 months of age, is another animal model used for AD. Using this model, one animal study indicated that compared to the control group there was no difference in the signal related to the amide proton [37]. Nevertheless, these animal models do not reflect the pathophysiology underlying AD, which might be one of the reasons that the results of animal studies are inconsistent with human studies ( Table 1 ).
In a human study, the APT signal intensities calculated by MTRasym (3.5 ppm) of the bilateral hippocampus were higher in AD patients than in normal controls and were negatively correlated with the MMSE [44]. In addition to the hippocampus, there is a signal intensity difference in the anterior cingulate and putamen between dementia and normal control patients [46]. Because the early diagnosis of AD will enable early treatment of dementia and may prevent progression into dementia, some studies have also investigated the feasibility of using APTw to detect the pathophysiology of the earlier stage, such as amnestic mild cognitive impairment (aMCI) of dementia. APTw signal intensities of the hippocampus and amygdala are higher in aMCI patients than in the normal elderly population [45]. By acquiring more slices during imaging, another human study revealed that the APT values in the hippocampus, gray and whiter matter in the temporal and occipital lobes, and white matter in the frontal lobe, thalamus, putamen, and pons of the aMCI patients are higher than normal controls [43].
Compared to animal studies, the results of human studies consistently showed higher APT signals in the brain regions of AD or MCI patients than in control groups. In addition to the defects of the above-mentioned animal models, the discrepancies between the results of human and animal studies may be due to the following reasons: 1) The pathophysiologic process of AD remains unclear, and in addition to Aβ pathology and tauopathy, various proteins involved in multiple molecular pathways are altered [47]. All these related soluble and small proteins contribute to the alteration of APT signal intensity. 2) There is inconsistency in reporting the acid-base alterations in AD, which lead to opposite results [42, 48–50]. 3) MT, NOE, and spillover effects interfere with the APT signal. 4) T1w changes contaminate the APTw. 5) In the late stage of dementia, atrophy of the brain leads to a tendency to contaminate the APT signal by the surrounding cerebral fluid, which presents as a low signal [17].
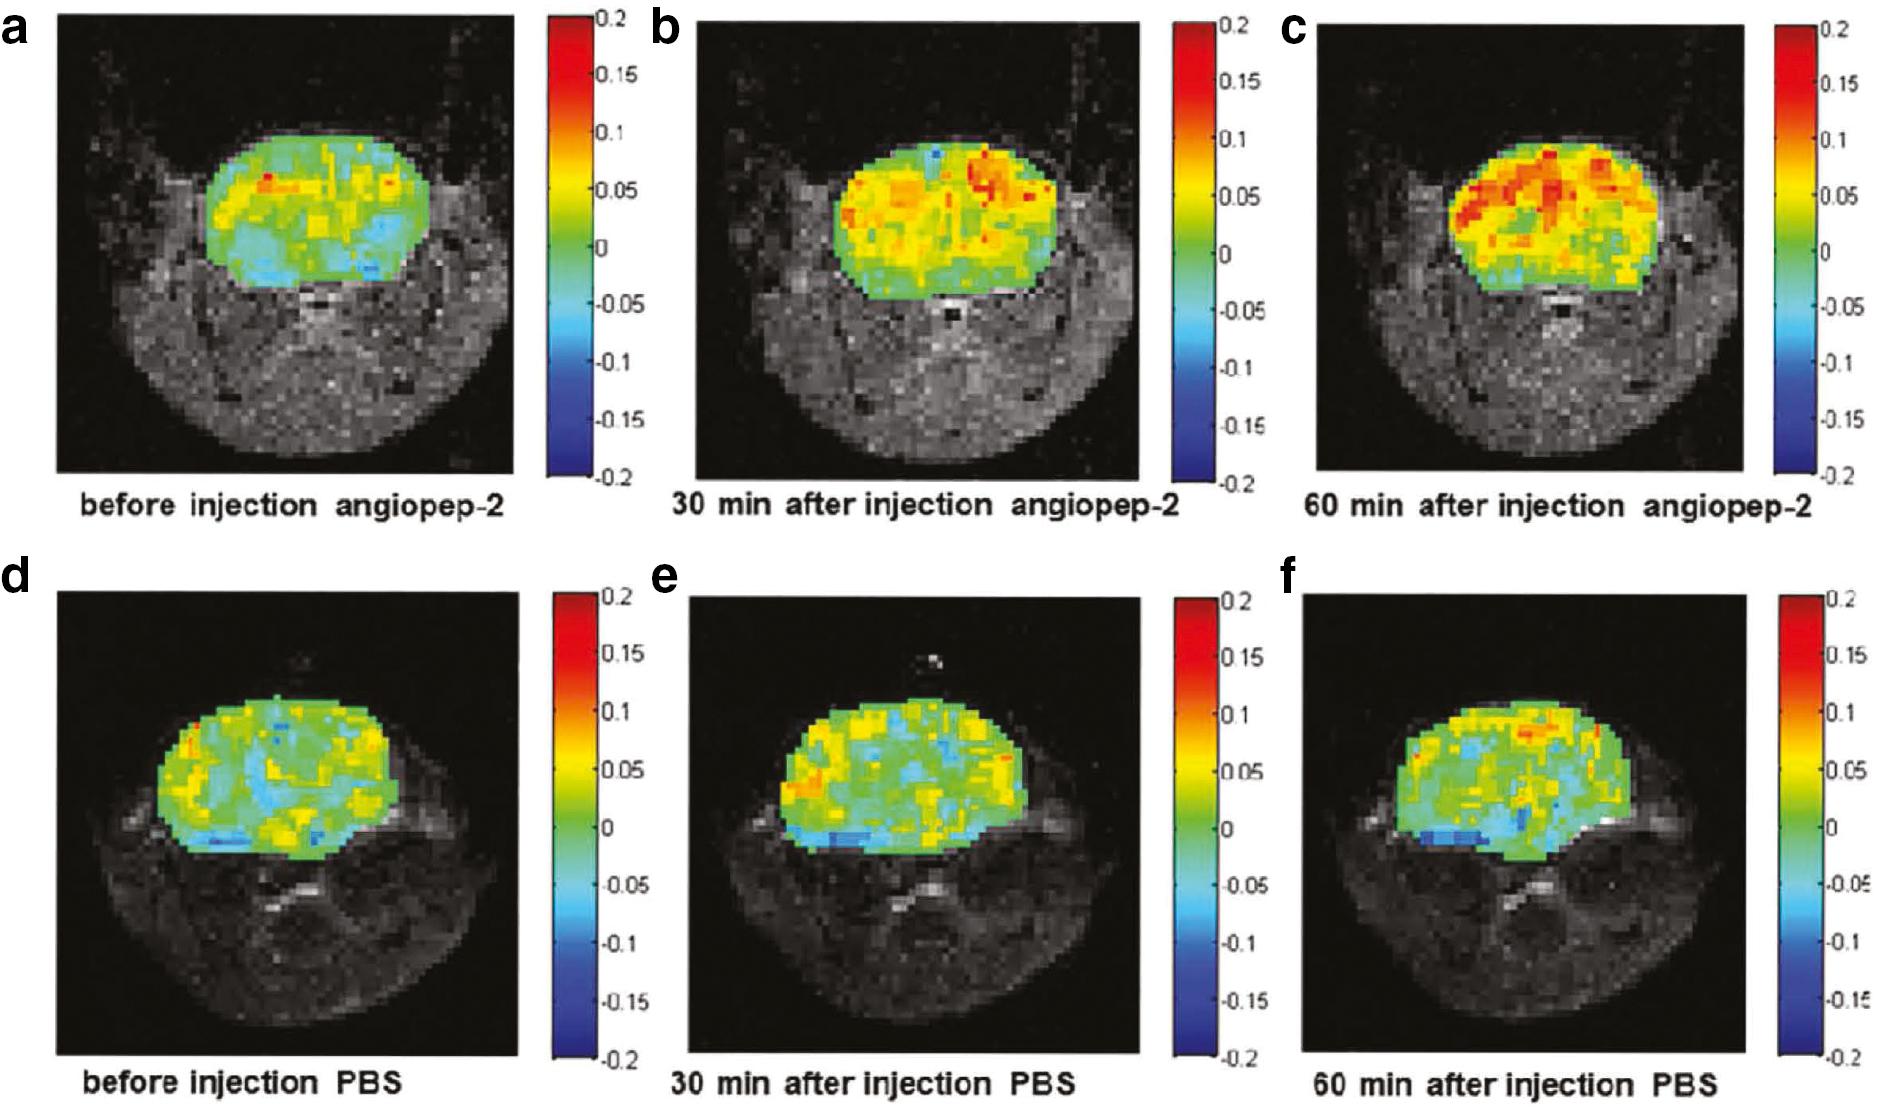
Wang et al. [51] demonstrated that Aβ aggregation in vivo can be detected using CEST by injecting angiopep-2 into APP/PS1 mice. Angiopep-2 is an artificial peptide that binds to Aβ with high affinity [51]. CEST imaging of angiopep-2 at pH 7.0 revealed a CEST effect that peaked at 3.2 ppm, which was not influenced by mixing with amyloid 1-40. After injecting angiopep-2 for in vivo imaging, the CEST signal in the cortex and hippocampus was significantly increased compared to the control group, indicating Aβ deposition ( Figure 3 ), as confirmed by histologic staining [52]. In addition, a longitudinal study showed that as the AD mice model aged, the CEST signal increased correspondingly, which indicated more extensive Aβ deposition [53].
CEST images of APP/PS1 mice injected with angiopep-2 and PBS.
(a, b, and c) Representative images of APP/PS1 mice pre- and post-injection of angiopep-2 are shown. The images were obtained before injection (a), 30 min after injection (b), and 60 min after injection (c). This shows that there was a great enhancement after the injection of angiopep-2. The CEST effect was strongest at 60 min, and it was mainly concentrated in the hippocampus and cortical regions. (d, e, and f) The corresponding images of APP/PS1 mice treated with PBS as controls before injection (d), 30 min after injection (e), and 60 min after injection (f) are shown. There were no significant differences among these time points. Reprinted with permission from [52]. Copyright {2019} American Chemical Society.
3.2 Impairments of the glutamate/GABA glutamine cycle
Glutamate is the primary excitatory neurotransmitter in the brain, while γ-aminobutyric acid (GABA) serves as an inhibitory neurotransmitter. Astrocytes synthesize and release glutamine from the neuron to replenish these two neurotransmitters. This glutamate/GABA-glutamine metabolic cycle is disturbed in patients with AD, which deprives neurons of metabolic support. Modulation of brain metabolism may therefore arrest or even revert the progression of AD [54].
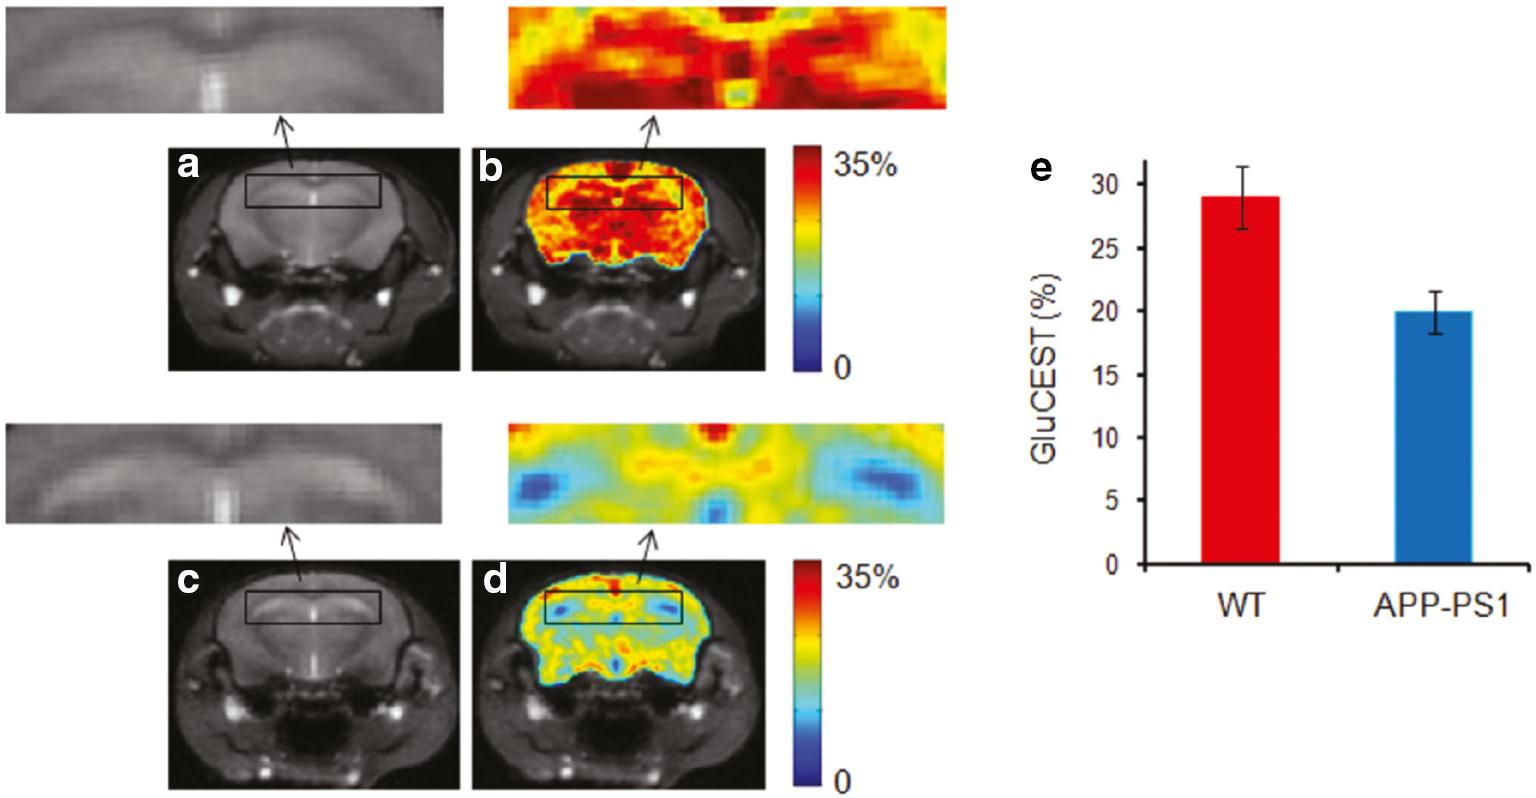
As a molecular technique, CEST has an inherent advantage in detecting metabolic disturbance and has been applied for glutamate (GluCEST) ( Table 2 ) and GABA imaging [GABA CEST] [62]. Compared with MRS, CEST imaging provides high resolution and maps the distribution of metabolites in the different regions of the brain. Amine protons on endogenous glutamate were labelled and exchanged with bulk water to produce contrast for GluCEST. The APP-PS1 transgenic mouse model of AD showed that GluCEST contrast was reduced in the whole brain, which was validated by proton magnetic resonance spectroscopy (1HMRS). In addition, compared to other brain regions, a more profound decrease in GluCEST contrast in the hippocampus was observed because GluCEST contrast is involved in the early stage of AD ( Figure 4 ) [55]. In another study using the P301S transgenic mouse PS19 line, which is an AD animal model that overexpresses the human P301S mutant tau, the changes in glutamate level to histologic measurements of pathology were correlated. The authors demonstrated that glutamate loss is associated with synapse loss in a mouse model of tauopathy. GluCEST contrast was shown to be reduced in the cornu ammonis sub-region of the hippocampus where synapse loss occurred. In contrast, glutamate differences were not significant in the dentate gyrus sub-region of the hippocampus where the synapse remained intact. Moreover, synapse loss and GluCEST reduction occurred earlier than neuronal dysfunction and tauopathy, which again indicated the potential of using GluCEST for the early diagnosis of AD [56, 63]. In addition to cross-sectional imaging of the alteration of glutamate, longitudinal measurements of the changes can provide information about AD progression and the correlation between dynamic glutamate change and other biomarkers of AD. The hippocampus volume was not significantly reduced in a mouse model of tauopathy until 13 months of age, whereas GluCEST contrast reduction and synapse loss were observed as early as 6-7 months of age. In contrast to various regions of GluCEST signal reduction, the dorsal hippocampus maintained high GluCEST throughout the lifetime of the mouse, where neurons are highly active. A trend towards a high glutamate level was also observed at 3 months of age in the tauopathy animal model. At this stage, synapse deficits had already occurred in the absence of phosphorylated tau [57]. One possible explanation for this finding is that a high glutamate level caused excitotoxicity [64]. Another longitudinal study showed that GluCEST effects were reduced before hypoperfusion occurred in a part of the cortex and hippocampus in a 5xFAD mouse model of AD [58]. Therefore, applying GluCEST for early and non-invasive diagnosis of AD is of great potential.
Brain GluCEST map across the hippocampus region.
(a) Anatomic brain image from a wild-type (WT) mouse. (b) The corresponding GluCEST map. (c & d) Anatomic image and corresponding GluCEST map from age-matched AD mice. Significantly decreased GluCEST contrast in hippocampus was observed in APP-PS1 mice compared to WT mice. The hippocampus regions are shown in the rectangular box in WT and AD mice (arrows). (e) The bar graphs show the mean hippocampus GluCEST contrast in WT and AD mice, respectively. ©Reprinted with permission from [55]. Copyright 2011 John Wiley & Sons, Ltd. (license number, 5463550876792).
Compared with GluCEST, limited studies have focused on GABA CEST, which may be related to the early observations that glutamatergic synapses in the AD brain were lost [65], whereas GABAergic synapses were less affected [66]. It was demonstrated, however, that GABAergic interneurons contribute to approximately 30% of the total plaque load in the hippocampus in an APP knock-in mouse model of AD. Neurotransmitter homeostasis is essential, and impairments of the inhibitory tone may play a crucial role in the AD neuronal network dysfunctions [67]. Therefore, it is necessary to develop a technique for in vivo GABA detection to reflect the pathophysiology of AD. The GABA concentration in a normal brain is only 1-2 mM [68], which is lower than glutamate [5-15 mM] [69]. Alteration of GABA concentration in AD has not been studied in vivo and remains unknown. In vivo GABA CEST was first demonstrated in a tumor model, in which the blood-brain barrier was disrupted, and the GABACEST effect was increased gradually over time after GABA injection [70]. Another study applied this technique to explore a drug effect on the modulation of the GABA level in Parkinson’s disease [71, 72]. This study was inspiring because it was shown that it is also possible to apply GABACEST in the treatment effect evaluation in another most common neurodegenerative disease (AD), especially for treatment targeting the modulation of GABAergic transmission [54, 73]. Nevertheless, these two studies were performed in a 7.0 T scanner, and whether it is feasible to detect the GABA CEST effect in clinical scanners (e.g., a. 0 T scanner) warrants further study.
3.3 Glucose metabolism
Although the human brain is only 2% of the body weight, the brain consumes 20% of an individual’s energy at rest and plays a crucial role in brain health, aging, and neurodegenerative disease [74]. Decreases in glucose and oxygen metabolic rates of brain cells occur in various neurodegenerative diseases, such as AD and Parkinson’s disease [75, 76]. Accumulating evidence implies that alterations in energy usage strongly influence the initiation and progression of these disorders [74, 76]. Compared with glial cells in the brain, neurons have high energy-demand and are more vulnerable to disturbances in glucose metabolism, which renders neurons susceptible to apoptosis [76].
Glucose metabolism can be evaluated by PET scan after injecting a radioactive glucose analog; however, patients with neurodegenerative diseases, such as AD, are required to have multiple follow-up studies. In addition, PET imaging has some drawbacks. Specifically, the spatial resolution is low and special infrastructures are needed to synthesize, distribute, and dispose of radioactive tracers, resulting in very high costs. Moreover, the radiation risk limits repeated measurements [77]. It has been shown that glucose can be used as a CEST contrast agent [GlucoCEST] [78]. After injecting this contrast agent in animal models of AD, metabolism in the brain can be evaluated. During this process, two main factors contribute to the change in GlucoCEST signal intensities in the brain parenchyma (glucose uptake and metabolism). In an APP/PS1 AD mouse model, increased glucose uptake in the parenchyma was detected in the early stage (6 months) compared to age-matched controls [79], which was consistent with the results from other studies using different imaging modules [80, 81]. In the later stage (16 months) and in Tau4RDK (7-8 months) and APP23 (20 months) AD mouse models, GlucoCEST signal intensities were significantly reduced [77, 79, 82], which may be due to reduced glucose uptake caused by reductions of both GLUT1 and GLUT3 expression at the blood-brain barrier [83]. Moreover, the result was validated by MRS [82] and it was demonstrated that GlucoCEST was positively correlated with myoinositol concentration detected by MRS, which reflects neuroinflammation [84]. Another study using the rTg4510 AD mouse model at approximately 10 months of age revealed higher CEST contrast in the cortex, but not in other regions compared with the control group, which may be explained by decreased glucose metabolism along with other pathologic changes, such as brain atrophy. A delay in obtaining the GlucoCEST images (approximately 1 h after glucose injection) may also contribute to this result because normal control mice may have a faster glucose metabolic rate [39] ( Table 3 ).
3.4 Acid-base imbalance/Creatine alteration
Our brain is highly energetic and requires an adenosine triphosphate (ATP) supply. Previous studies demonstrated altered energy metabolism in AD [85, 86]. Creatine is essential for resynthesizing ATP through the creatine kinase reaction. For most studies using MRS for in vivo metabolite quantification, the relative ratio of NAA:creatine (Cr), MI:Cr, or Cho:Cr were calculated based on the assumption that the concentration of Cr is stable [87–90]. It was shown, however, that the creatine level is altered in patients in different stages of AD [91–93], and creatine supplementation is potentially beneficial for AD [94].
Creatine chemical exchange saturation transfer (CrCEST) contrast is dependent on the creatine concentration and pH due to the fact that the creatine guanidinium proton exchange rate is strongly pH-dependent [95, 96]. Cerebral acid-base homeostasis is crucial for the brain to maintain ion channel functioning, cell activities, and protein folding [97, 98]. Some studies revealed an altered pH in different stages of AD [42, 48–50] using MRS or postmortem tissue for pH evaluation. Currently, one study used CrCEST to elucidate the pathophysiology of AD, which revealed decreased CrCEST contrast of the cortex and corpus callosum in the tauopathy and Aβ pathology animal models [59] ( Table 2 ). The authors used MRS to detect the creatine level in these two animal models and found equivalent creatine concentrations, suggesting that the CrCEST contrast change was mainly due to pH alterations. Moreover, the CrCEST contrast change may be related to neuroinflammation, which is a known factor that causes pH alteration [99]. It should be noted that considering the creatine concentration change in AD, the results from different studies varied [59, 91–93], which may be due to the application of different methods for metabolite quantification or the use of animal models versus clinical patients. When applied in animal models, it was shown that CrCEST detected pH alterations as early as 6-7 months. Therefore, it may be feasible to use CrCEST for the early diagnosis of AD.
3.5 Neuroinflammation/glial activation
Neuroinflammation contributes as much or more to the pathogenesis of AD as the classic amyloid cascade hypothesis [100], manifested by the activation of microglia and astrocytes, which can be detected using a TSPO PET probe. The TSPO level is low in normal brains, but when the brain has an injury from any etiology [101, 102], the TSPO level increased instantly. Using a PET scan for glial cell activity detection is of high sensitivity and specificity; however, a PET scan involves radiation, and there is limited equipment availability. Myo-inositol (MI), functioning as an osmolyte, is one of the most abundant metabolites in the human brain and is synthesized by or is present in glial cells. Based on the preliminary results of MRS, the feasibility of using MI quantification for the evaluation of glial cell activity of neuroinflammation was validated [93, 103, 104].
Compared with MRS, MICEST provides high resolution and a map of brain regions with high glial cell activity or neuroinflammation ( Table 2 ). It has been shown that MICEST is ˜ 700 times more sensitive than MRS [60]. Compared to the control group at 20 months of age, APP-PS1 mice at the same age showed ˜50% higher MICEST contrast when the MI concentration was measured using spectroscopy [60]. In contrast, changes in MICEST contrast levels after a mild inflammatory challenge with lipopolysaccharide indicated that CEST MRI is sensitive to detect the challenge in mice with a pronounced microglial response [61].
3.6 Glymphatic defect
The glymphatic system is a highly organized system that allows CSF and interstitial fluid exchange, facilitated by the aquaporin-4 water channels and perivascular spaces created by the astrocyte endfeet. The endfeet encompass the surrounding arteries, capillaries, and veins, and cause little resistance to flow. The pulsations of the arterial wall also drive the entry of CSF along the perivascular space [105–108]. One hypothesis related to AD is the disturbed balance between production and removal of beta-amyloid. It has been suggested that glymphatic failure may be the final common pathway to dementia [108]. Clearance of the abnormal proteins through the glymphatic system could potentially prevent the occurrence of AD. Different imaging techniques have been applied to investigate the glymphatic system, details for which have been provided by Klostranec et al. [109]. Among various imaging techniques for glymphatic system demonstration, CEST is gaining interest in non-invasive imaging. The in vitro CEST effect of lymph from a pig was evident at about 1.0 ppm and can be easily distinguished from blood and CSF from the same pig. After unilateral ligation of rat deep cervical lymph nodes, the CEST effect in the ipsilateral hippocampus was increased, which correlated with behavior changes. This finding demonstrated the feasibility of using CEST for non-invasive glymphatic function monitoring ( Figure 5 ) [110]. The function of the glymphatic system can also be evaluated by the CEST technique after injecting exogenous agents. After injecting D-glucose, delayed clearance was observed in a mouse model of tauopathy compared with the control group [82].
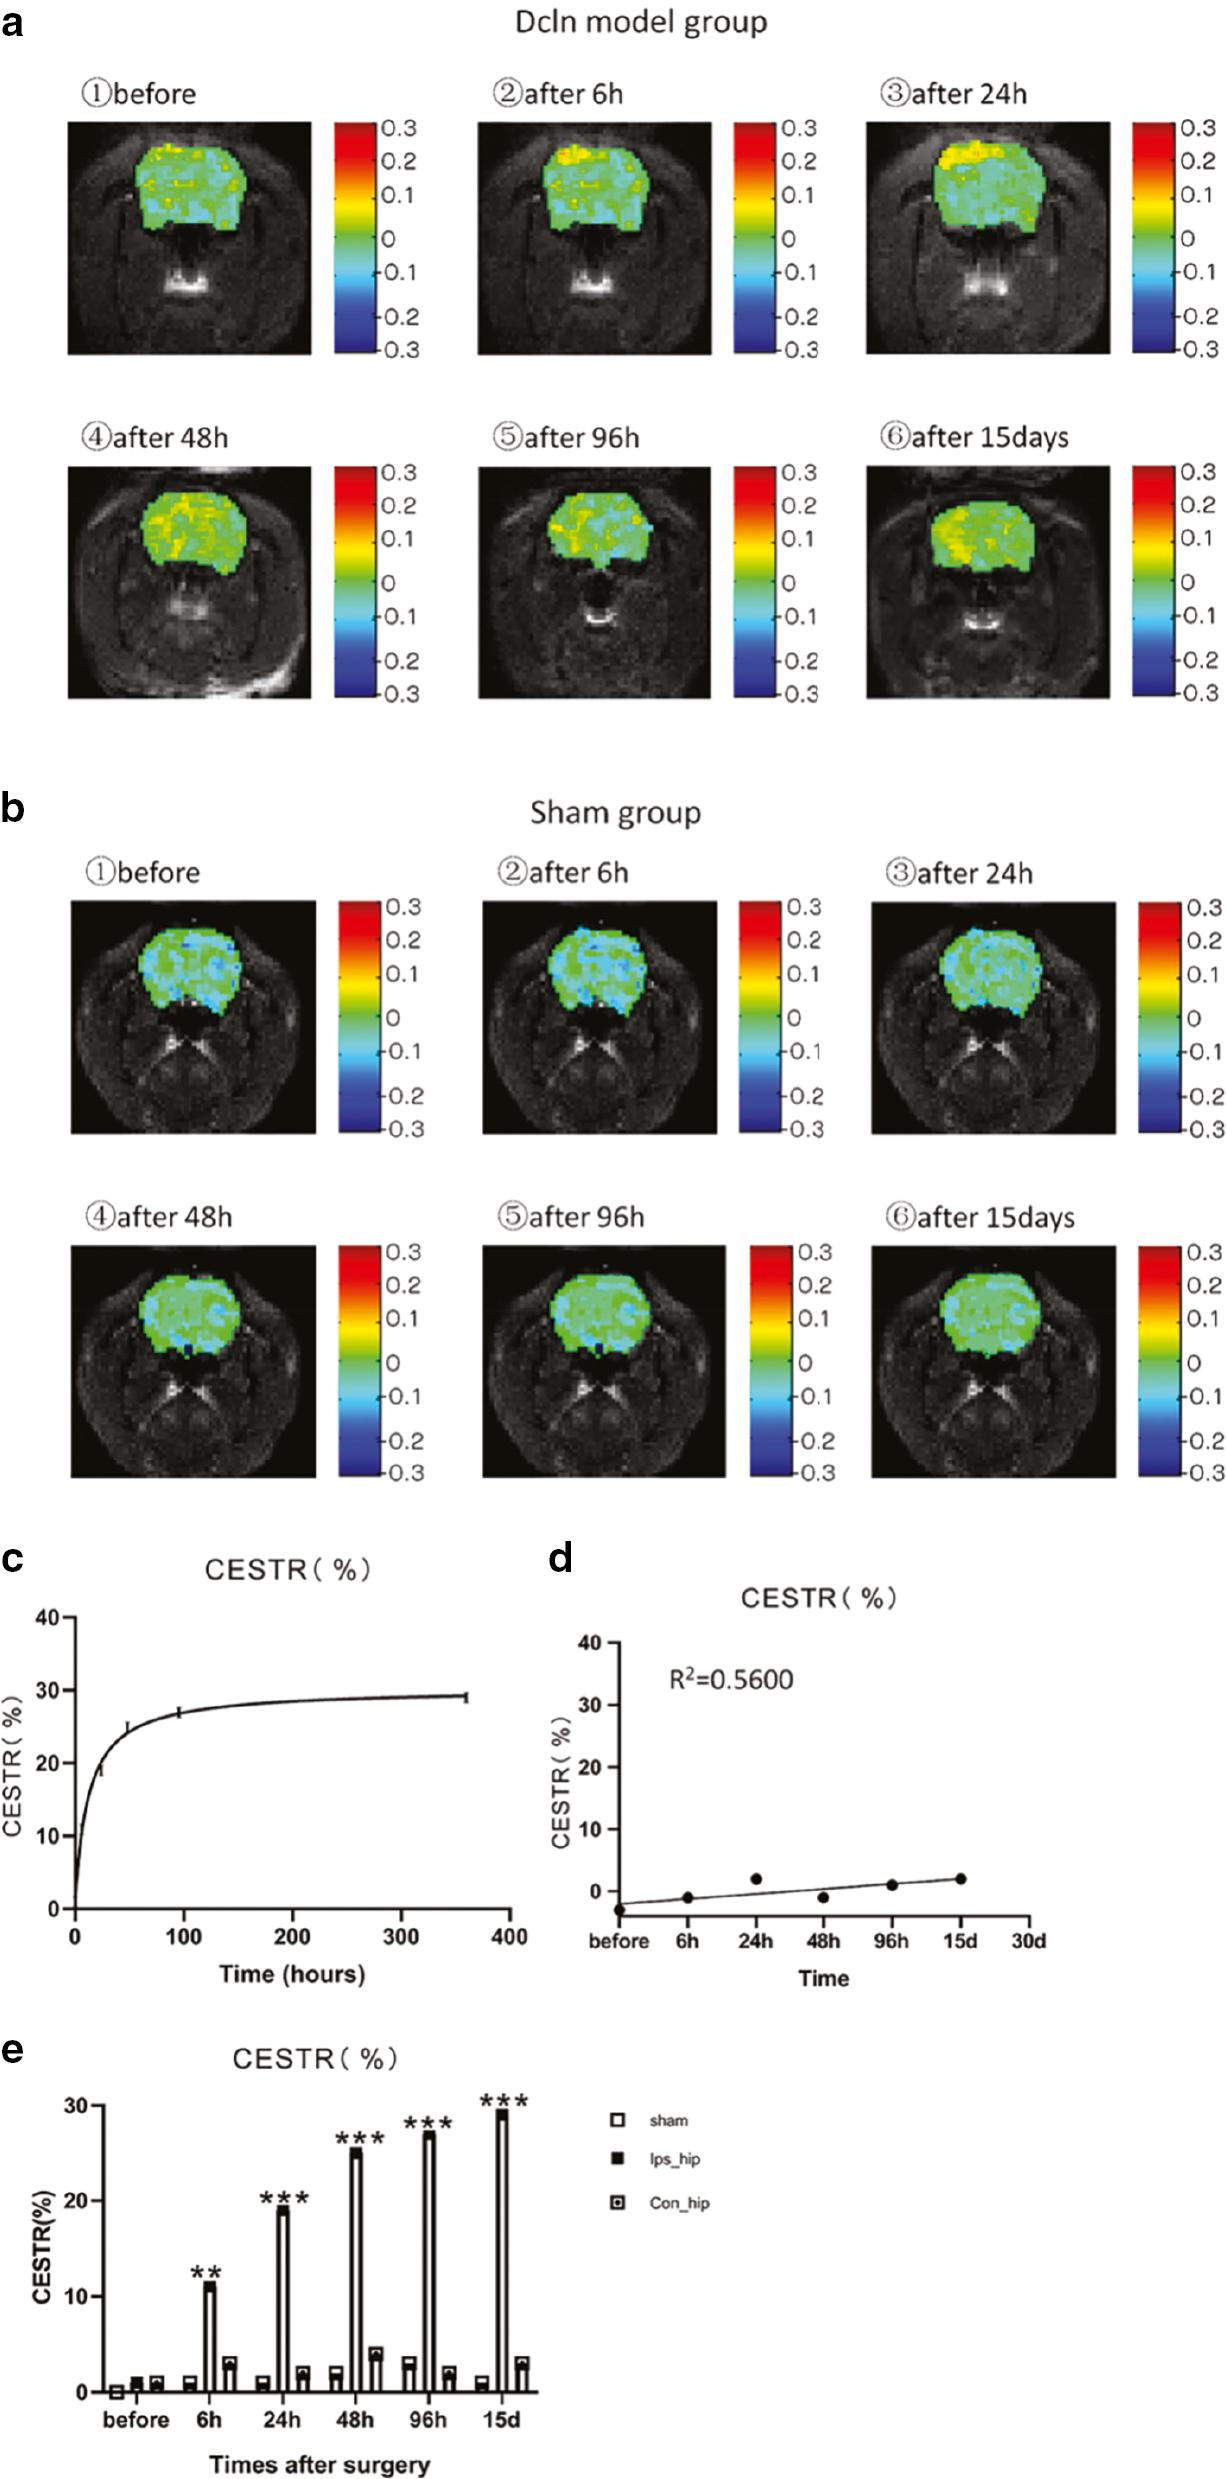
(a) Lym-CEST effects at different time points after deep cervical lymph node ligation.
The color bars on the right side of the images represent the chemical exchange saturation transfer rate (CESTR). (b) The representative Lym-CEST images at different time points after sham surgery. (c) In the Dcln model group, the CESTRs at different time points after surgery showed a trend of the function curve rising with the time in the correct quadrant. (d) CESTR of the brain at different time points after the sham surgery. Linear correlation R2 = 0.5600; P > 0.05. (E) The Lym-CEST effects at different time points after surgery for the ipsilateral hippocampus of sham surgery rats (Sham) and for the ipsilateral hippocampus (Ips_hip) and contralateral hippocampus (Con_hip) of Dcln model rats. Data are all expressed as the mean ± SEM; *P < 0.05, **P < 0.01, and ***P < 0.001. Reprinted with permission from [110]. Copyright {2020} American Chemical Society.
4. CONCLUSIONS AND PROSPECTS
Our understanding of AD pathophysiology is still limited. Preclinical studies applying CEST provide valuable information about the pathophysiologic process of AD, especially when correlating the CEST signals with histologic staining reflecting Aβ deposition, tauopathy, synaptic density, astrogliosis, and reactive microglia. Most of these studies were performed in 7T MRI scanners or higher fields ( Table 4 ). When applied in clinical scanners, the CEST effect may be influenced because power contributes to optimizing the CEST signal [111]. Moreover, the scan time is too long for clinical applications, and the CEST effect is susceptible to artifacts from various sources like breathing and movement; however, these limitations can be overcome by optimizing the methodologic aspects of this technique, although we are only scratching the surface of possible approaches [14, 19]. Another limitation of applying CEST on patients is that the CEST signal tends to be influenced by endogenous metabolites, resulting in low specificity. Unlike endogenous CEST, exogenous CEST minimizes the confounds from endogenous metabolites by comparing the CEST effect before and after the injection of the contrast ( Table 4 ). Exchange transfer contrast paves the road for precision medicine. Various contrasts can be designed for specific purposes, and repurposing the clinically available agents already approved by the FDA is of great potential. PET probes are currently regarded as the gold standard of molecular imaging, and different probes have been applied to detect the pathophysiologic process of AD. It is worth exploring whether it is feasible to repurpose the PET probes for CEST imaging, which maintains the inherent precision characteristic of the probe while avoiding radiation risk with improved availability in clinical settings.