Introduction
The prevalence of hypertension has risen annually in China [1–4], thus increasing cardiovascular disease-associated morbidity and mortality [5–9], and posing a substantial financial and health burden [2, 10–16]. Left ventricular hypertrophy is a marker of hypertensive target-organ damage and a principal pathological process in heart failure [17–20]. Reversing hypertensive left ventricular hypertrophy (HLVH) is a primary therapeutic goal to prevent heart failure, and an effective method to decrease the risk of cardiovascular disease [21–24]. However, the rate of reversal is generally low [25, 26]. Human neutrophil peptide-1 (HNP-1, sequence: ACYCRIPACIAGERRYGYCIYQGRLWAFCC), also called alpha-defensin 1, is usually produced by immune cells such as neutrophils, lymphocytes, monocytes, and eosinophils [27, 28]. By regulating nuclear factor-кB (NF-кB) signaling pathways, HNP-1 plays a critical role in autoimmune disorders, anti-infection, and peripheral nerve injury repair [29–40]. However, the role of HNP-1 in cardiovascular disease is debated. On the one hand, HNP-1 levels have been associated with the severity of coronary atherosclerosis [41], and may increase the risk of thrombosis by altering fibrin shape, structure, and stability [42]. On the other hand, HNP-1 may prevent atherosclerosis progression and decrease plasma low-density lipoprotein cholesterol levels [43], decrease atherosclerosis [44], and mitigate arterial thrombosis by inhibiting the aggregation of von Willebrand factor [45]. Whether HNP-1 plays a role in HLVH remains unclear. Thus, to potentially identify therapeutic targets for ameliorating HLVH, this study was aimed at exploring the association between HNP-1 and HLVH.
Materials and Methods
Study Participants
A total of 861 patients with hypertension were recruited from the Affiliated Hospital of Guizhou Medical University between May and December of 2021 in Guiyang, China. All patients were at least 18 years old and had been diagnosed with hypertension according to the 2018 Chinese Guidelines for Prevention and Treatment of Hypertension [46]. After exclusion of patients with secondary hypertension, infectious diseases, rheumatic immune diseases, tumors, diabetes, stroke, coronary atherosclerotic heart disease, heart failure, or chronic kidney disease, 216 patients with hypertension were included in the study. Ethics approval for the study was obtained from the Ethics Committee of the Affiliated Hospital of Guizhou Medical University (No. 2021-167, March 2, 2021).
Exposure and Control Groups
The 216 study participants were divided into exposure and control groups according to their left ventricular mass index (LVMI). The exposure group comprised 100 patients with HLVH whose LVMI was >115 g/m2 in men and >95 g/m2 in women [26]. The control group comprised 116 patients with hypertension and without left ventricular hypertrophy, whose LVMI was ≤115 g/m2 in men and ≤95 g/m2 in women.
Rats
Forty male Wistar rats 5–6 weeks of age were obtained from the Guizhou Medical University Laboratory Animal Center. All rats were fed SPF-rated feed and kept under 12-hour light-dark cycles at 25 ± 1 °C. After 1 week of adaptive feeding, 39 healthy Wistar rats were selected for this study. The animal study protocol was approved by the Animal Care and Welfare Committee of Guizhou Medical University (No. 2201437, March 31, 2022).
Establishment of the HLVH Rat Model
To establish the norepinephrine (NE)-induced HLVH model in rats, we divided 39 healthy male rats into control, NE, and NE plus HNP-1 groups. Rats in the control group received intraperitoneal injections with 0.9% saline for 18 weeks. Rats in the NE group received intraperitoneal injections with NE (R030760, Rhawn, Shanghai, China) at 1.5 mg/kg/day [47] for 10 weeks, then with 0.9% saline for 8 weeks. Rats in the NE plus HNP-1 groups received intraperitoneal injections with NE at 1.5 mg/kg/day for 10 weeks, then with HNP-1 (HSA10038, Hsynthbio, Hefei, China) at 10, 20, 30, or 40 μg, once every 2 days for 8 weeks.
Blood Pressure Monitoring in Rats
Blood pressure (BP) was measured with a non-invasive tail-cuff method (Non-Invasive Blood Pressure System, CODA, Kent Scientific Corp., Austin, TX, USA). BP was monitored weekly during NE injection administration and once every 2 weeks during HNP-1 injection administration. Before BP testing, rats were restrained on a warming table set to 35 °C and allowed to stabilize for 10 minutes. Next, BP measurements were taken for 15 cycles in conscious rats not under anesthesia, and the average value was used to calculate the BP.
Myocardial Tissue Staining in Rats
Before being embedded in paraffin and sectioned into 4–5 μm thick slices, cardiac ventricles were fixed with 10% paraformaldehyde for 24–48 hours. Then hematoxylin-eosin and Masson’s trichrome staining were performed according to the manufacturers’ instructions. Left ventricular HNP-1 expression was identified through immunohistochemistry staining, which was performed with rabbit anti-rat alpha-defensin 1 mAb (NBP3-05562, Novus, 1:80, Colorado, USA). Finally, the sections were digitized with a fully automatic digital slice scanner.
Establishment of the H9c2 Cell Hypertrophy Model
H9c2 cells (BNCC353655, BNCC, Beijing, China) were cultured in Dulbecco’s modified Eagle’s medium (HyClone, USA) at 37 °C in a 5% CO2 incubator (BPN-80CW, Shanghai, China). After the cell density reached 50%, the H9c2 cells were randomly divided into control, Ang II, and Ang II plus HNP-1 groups. Cells in the control group were treated with 10% fetal bovine serum (10099-141, Gibco, California, USA) for 5 days. Cells in the Ang II group were treated with 1 μM Ang II (HY-13948, MCE, New Jersey, USA) for 48 hours [24] and subsequently with 10% fetal bovine serum for 72 hours. Cells in the Ang II plus HNP-1 groups were treated with 1 μM Ang II for 48 hours and subsequently with a different dose of HNP-1 for 72 hours.
H9c2 Cell Viability Assays
A Cell Counting Kit-8 (CCK-8, KGA317, KeyGEN, Nanjing, China) was used to determine cell viability. After stimulation of cells with HNP-1 at 0, 5, 10, 15, or 20 μg/mL for 24, 48, or 72 hours, 10 μL CCK-8 reagent was added to each well at 37 °C and incubated for 2 hours. The absorbance was then measured at 450 nm.
H9c2 Cell Immunofluorescence Staining
After fixation in 4% paraformaldehyde for 15 minutes, the H9c2 cells were blocked with 5% bovine serum albumin for 30 minutes. Next, mouse anti-rat F-actin mAb (OM252288, OmnimAbs, 1:100, Shanghai, China) was added to the H9c2 cells. Finally, the H9c2 cells were observed under a fluorescence microscope (CKX53, OLYMPUS, Japan).
Western Blotting
HNP-1, BNP, and β-MHC levels were measured with rabbit anti-rat alpha-Defensin 1 mAb (NBP3-05562, Novus, 1:2000, Colorado, USA), rabbit anti-rat BNP mAb (WL02126, Wanlei, 1:1000, Shenyang, China), and rabbit anti-rat β-MHC mAb (NBP2-74079, Novus, 1:2000, Colorado, USA), respectively. IKKβ, p-IKKβ, IкBα, p-IкBα, p65, p-p65, and GAPDH levels were measured with rabbit anti-rat IKKβ, p-IKKβ, IкBα, p-IкBα, p65, p-p65 mAb (all 1:500, Affinity, USA), and GAPDH mAb (1:10000, Affinity, USA), respectively.
Real-Time Quantitative Polymerase Chain Reaction
Total RNA was extracted from H9c2 cells with TRIzol reagent (CW0580S, CWBIO, Beijing, China). Subsequently, total RNA was reverse-transcribed into first-strand cDNAs with HiScript II Q RT SuperMix (R223-01, Vazyme, Nanjing, China). Finally, real-time quantitative polymerase chain reaction (qPCR) was performed with ChamQ Universal SYBR qPCR Master Mix (Q711-02, Vazyme, Nanjing, China), and the fluorescence was captured by an iCycler IQ system (Chemi DocTM XRS+, Bio-Rad, CA, USA). The relative expression of mRNA was calculated according to Ct values. GAPDH was used as the reference gene. All primers are listed in Table 1.
Sequences of Primers Used in qPCR.
| Gene | Sequences (5′-3′) |
|---|---|
| BNP | Forward: TCCTGCTTTTCCTTAATCTGTC |
| Reverse: GCTTGAACTATGTGCCATCTTG | |
| β-MHC | Forward: AGGCTCATCCTTTCAGACCG |
| Reverse: TCACCCCTGGAGACTTCGT | |
| IKKβ | Forward: CAGAAGAGCGAAGTGGACATT |
| Reverse: TGAGATTATTGGGGAAGGGT | |
| IκBα | Forward: TGTCTACACTTAGCCTCTATCC |
| Reverse: GGGCAACTCATCTTCCGT | |
| p65 | Forward: GCAAAAGGACCTACGAGACC |
| Reverse: CGGGAAGGCACAGCAATA | |
| GAPDH | Reverse: GACAACTTTGGCATCGTGGA |
| Reverse: ATGCAGGGATGATGTTCTGG |
BNP, brain natriuretic peptide; β-MHC, β-myosin heavy chain.
Enzyme-Linked Immunosorbent Assays
An enzyme-linked immunosorbent assay (ELISA) kit (JL20063, JIANGLAI, Shanghai, China) was used to measure the concentration of serum HNP-1 in patients, according to the manufacturer’s instructions. ELISA kits (MM-0193R1, MM-0193R1, and MM-0180R1, MEIMIAN, Shanghai, China) were also used to measure interleukin (IL)-1α, IL-6, and tumor necrosis factor α (TNF-α) levels, in accordance with the manufacturer’s instructions.
Statistical Analysis
Statistical analyses were conducted in SPSS (21.0, IBM, USA) and GraphPad Prism 8.4 (CA, USA). The integrated density of images was calculated in ImageJ software (Media Cybernetics, USA). Student’s t-test, Wilcoxon signed rank test, and one-way ANOVA were used to assess between-group differences. Pearson or Spearman correlation analyses and regression analyses were used to compare associations among HNP-1, BP, and left ventricular hypertrophy indexes. P < 0.05 was considered to indicate statistical significance.
Results
Participants’ Descriptive Characteristics and HNP-1 Levels
No statistically significant differences were identified between the exposure and control groups in terms of age, sex, body mass index (BMI), and cardiovascular risk factors, including smoking, TG, TC, L-DLC, H-DLC, glucose, Hcy, and history of hypertension (Table 2). In addition, no statistically significant differences were observed in the proportion of patients taking anti-hypertensive drugs, including beta-blockers, CCBs, ACEI/ARB, and diuretics (Table 2). However, the BP and HLVH indexes were higher in the exposure than the control group (Figure 1, Table 3), whereas HNP-1 levels were significantly lower in the exposure than the control group (M (95% CI), 48.83 (45.64–52.26) vs. 59.03 (55.62–62.54), P = 0.000; Figure 1). Furthermore, HNP-1 levels were significantly negatively correlated with BP and left ventricular hypertrophy indexes (Table 4).
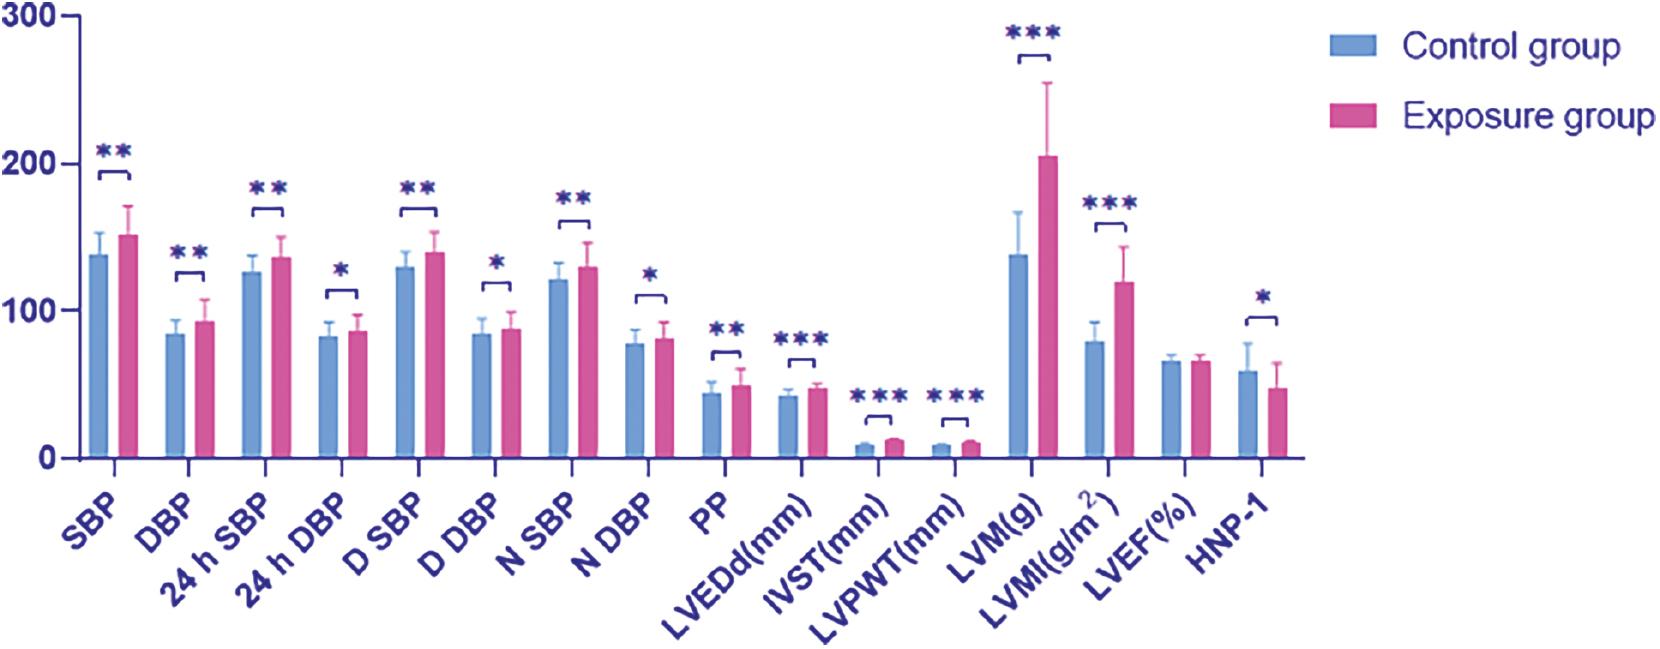
Blood Pressure, Left Ventricular Hypertrophy Indexes, and HNP-1 Level in the Two Groups.
*P < 0.05, **P < 0.01, ***P < 0.001. SBP, systolic blood pressure; DBP, diastolic blood pressure; 24 h SBP, 24 h systolic blood pressure; 24 h DBP, 24 h diastolic blood pressure; D SBP, daytime systolic blood pressure; D DBP, daytime diastolic blood pressure; N SBP, night systolic blood pressure; N DBP, night diastolic blood pressure; PP, pulse pressure; LEVDd, left ventricular end diastolic dimension; IVST, interventricular septal thickness; LVPWT, left ventricular posterior wall thickness; LVM, left ventricular mass; LVMI, left ventricular mass index; LVEF, left ventricle ejection fraction; HNP-1, human neutrophil peptide-1.
Descriptive Characteristics of Participants in the Two Groups.
| Variables | Exposure group (n = 100) | Control group (n = 116) | P |
|---|---|---|---|
| Age (years) | 51.66 (49.85–54.18) | 48.20 (45.86–50.73) | 0.076 |
| Males † | 42 (42%) | 61 (52.59%) | 0.132 |
| Smoking † | 39 (39%) | 47 (40.52%) | 0.889 |
| Body weight (kg) | 67.89 (65.23–70.27) | 69.53 (66.78–72.00) | 0.351 |
| BMI (kg/m2)* | 26.38 (3.87) | 25.86 (3.17) | 0.287 |
| TG (mmol/L) | 1.89 (1.69–2.10) | 1.98 (1.77–2.16) | 0.482 |
| TC (mmol/L) | 4.41 (4.26–4.59) | 4.43 (4.28–4.58) | 0.664 |
| LDL-C (mmol/L) | 2.70 (2.55–2.85) | 2.79 (2.63–2.92) | 0.308 |
| HDL-C (mmol/L) | 1.13 (1.08–1.19) | 1.13 (1.07–1.09) | 0.705 |
| Hcy (μmol/L) | 14.63 (12.99–16.81) | 15.22 (13.40–17.66) | 0.671 |
| Glucose (mmol/L)* | 7.80 (7.32–8.31) | 7.17 (6.84–7.52) | 0.151 |
| Hypertension history (years) | 8.42 (6.56–10.54) | 5.78 (4.35–7.33) | 0.304 |
| CCB † | 59 (59%) | 60 (51.72%) | 0.338 |
| ACEI † | 10 (10%) | 11 (10.09%) | 0.816 |
| ARB † | 22 (22%) | 21 (15.60%) | 0.500 |
| β-blockers † | 19 (19%) | 19 (16.38%) | 0.721 |
| Diuretics † | 9 (9%) | 4 (2.75%) | 0.149 |
*Results are given as mean (SD). †Results are given as number (%). All other results are given as median (95% CI).
BMI, body mass index; TG, triglyceride; TC, total cholesterol; LDL-C, low-density lipoprotein cholesterol; HDL-C, high-density lipoprotein cholesterol; Hcy, homocysteine; CCB, calcium-channel blocker; ACEI, angiotensin-converting enzyme inhibitors; ARB, angiotensin receptor blockers.
Comparative Analysis of Blood Pressure and Left Ventricular Hypertrophy Indexes in the Two Groups.
| Variables | Exposure group (n = 100) | Control group (n = 116) | P |
|---|---|---|---|
| SBP † | 152.53 (148.75–156.46) | 137.82 (135.08–140.99) | 0.001** |
| DBP | 94.02 ± 14.12 | 84.37 ± 9.68 | 0.001** |
| 24 h SBP | 136.62 ± 13.95 | 127.64 ± 10.25 | 0.001** |
| 24 h DBP | 86.60 ± 10.96 | 82.91 ± 9.65 | 0.03* |
| D SBP | 139.50 ± 14.34 | 130.47 ± 10.23 | 0.001** |
| D DBP | 88.76 ± 11.13 | 85.29 ± 9.81 | 0.045* |
| N SBP | 130.80 ± 15.87 | 121.30 ± 11.56 | 0.001** |
| N DBP | 81.83 ± 11.15 | 77.75 ± 10.08 | 0.020* |
| PP † | 50.02 (48.05–52.05) | 44.72 (43.20–46.29) | 0.001** |
| LVEDd (cm) † | 4.73 (4.65–4.80) | 4.40 (4.35–4.46) | 0.000*** |
| IVST (cm) † | 1.20 (1.16–1.24) | 0.97 (0.95–0.99) | 0.000*** |
| LVPWT (cm) † | 1.11 (1.08–1.14) | 0.93 (0.92–0.95) | 0.000*** |
| LVM (g) † | 205.68 (196.73–215.15) | 139.79 (134.76–144.77) | 0.000*** |
| LVMI (g/m2) † | 120.97 (116.95–125.40) | 80.48 (78.50–82.73) | 0.000*** |
| RWT † | 0.47 (0.46–0.48) | 0.42 (0.42–0.44) | 0.000*** |
| LVEF (%) † | 65.88 (64.98–66.82) | 67.21 (66.68–67.74) | 0.061 |
†Results are given as median (95% CI). All other results are given as mean (SD).
*P < 0.05, **P < 0.01, ***P < 0.001.
SBP, systolic blood pressure; DBP, diastolic blood pressure; 24 h SBP, 24 h systolic blood pressure; 24 h DBP, 24 h diastolic blood pressure; D SBP, daytime systolic blood pressure; D DBP, daytime diastolic blood pressure; N SBP, night systolic blood pressure; N DBP, night diastolic blood pressure; PP, pulse pressure; LVEDd, left ventricular end diastolic dimension; IVST, interventricular septal thickness; LVPWT, left ventricular posterior wall thickness; LVM, left ventricular mass; LVMI, left ventricular mass index; RWT, relative wall thickness; LVEF, left ventricle ejection fraction.
Correlations of HNP-1 Levels with Blood Pressure and Left Ventricular Hypertrophy Indexes in Patients with Hypertension.
| Variables | HNP-1 | |
|---|---|---|
| r | P value | |
| SBP (mmHg) † | −0.176 | 0.010* |
| DBP (mmHg) † | −0.196 | 0.004** |
| 24 h SBP (mmHg) † | −0.073 | 0.287 |
| 24 h DBP (mmHg) † | −0.010 | 0.890 |
| D SBP (mmHg) † | −0.082 | 0.233 |
| D DBP (mmHg) † | −0.024 | 0.727 |
| N SBP (mmHg) † | −0.052 | 0.447 |
| N DBP (mmHg) † | 0.021 | 0.758 |
| PP (mmHg) ‡ | −0.161 | 0.018* |
| LVEDd (cm) † | −0.218 | 0.001** |
| IVST (cm) ‡ | −0.083 | 0.225 |
| LVPWT (cm) ‡ | −0.122 | 0.074 |
| LVM (g) ‡ | −0.186 | 0.006** |
| LVMI (g/m2) ‡ | −0.259 | 0.000** |
| RWT † | −0.019 | 0.780 |
| LVEF (%) ‡ | 0.054 | 0.434 |
†Indicates Pearson correlation analysis. ‡Indicates Spearman correlation analysis.
*indicates significant correlation at the 0.05 level (two tailed); **indicates significant correlation at the 0.01 level (two tailed).
HNP-1, human neutrophil peptide-1; SBP, systolic blood pressure; DBP, diastolic blood pressure; 24 h SBP, 24 h systolic blood pressure; 24 h DBP, 24 h diastolic blood pressure; D SBP, daytime systolic blood pressure; D DBP, daytime diastolic blood pressure; N SBP, night systolic blood pressure; N DBP, night diastolic blood pressure; PP, pulse pressure; LVEDd, left ventricular end diastolic dimension; IVST, interventricular septal thickness; LVPWT, left ventricular posterior wall thickness; LVM, left ventricular mass; LVMI, left ventricular mass index; RWT, relative wall thickness.
Diminished HNP-1 is a Risk Factor for HLVH in Patients
Multiple linear regression analyses revealed that diminished HNP-1 was significantly correlated with LVMI after adjustment for age, sex, SBP, DBP, 24 h SBP, 24 h DBP, D SBP, D DBP, N SBP, N DBP, and PP (Table 5). Binary logistic regression analyses indicated that diminished HNP-1 was significantly correlated with HLVH after adjustment for the aforementioned variables (Table 6).
Multiple Linear Regression Analysis of Multiple Factors Associated with LVMI and RWT in Patients with Hypertension.
| Variables | LVMI | RWT | ||
|---|---|---|---|---|
| t | P | t | P | |
| Age (years) | 0.100 | 0.921 | 0.158 | 0.874 |
| Sex | −1.342 | 0.181 | −1.033 | 0.303 |
| HNP-1 (ng/mL) | −2.996 | 0.003* | −0.237 | 0.813 |
| SBP (mmHg) | 0.781 | 0.436 | 0.675 | 0.500 |
| DBP (mmHg) | 0.509 | 0.611 | −0.367 | 0.714 |
| 24 h SBP (mmHg) | 1.325 | 0.187 | 0.672 | 0.502 |
| 24 h DBP (mmHg) | −0.953 | 0.342 | 0.696 | 0.487 |
| D SBP (mmHg) | 1.437 | 0.152 | 0.203 | 0.840 |
| D DBP (mmHg) | −0.863 | 0.389 | 0.956 | 0.340 |
| N SBP (mmHg) | 1.160 | 0.247 | −1.175 | 0.241 |
| N DBP (mmHg) | 0.892 | 0.373 | 0.987 | 0.325 |
| PP (mmHg) | 1.163 | 0.246 | 0.662 | 0.509 |
*Indicates significant correlation at the 0.05 level (two tailed).
HNP-1, human neutrophil peptide-1; SBP, systolic blood pressure; DBP, diastolic blood pressure; 24 h SBP, 24 h systolic blood pressure; 24 h DBP, 24 h diastolic blood pressure; D SBP, daytime systolic blood pressure; D DBP, daytime diastolic blood pressure; N SBP, night systolic blood pressure; N DBP, night diastolic blood pressure; PP, pulse pressure.
Binary Logistic Regression Analysis of Risk Factors for Left Ventricular Hypertrophy in Patients with Hypertension.
| Variables | β | OR (95% CI) | P |
|---|---|---|---|
| Age (years) | −0.001 | 0.999 (0.965–1.033) | 0.969 |
| Sex | −0.881 | 0.952 (0.224–0.902) | 0.077 |
| HNP-1 (ng/mL) | −0.027 | 0.974 (0.956–0.995) | 0.011* |
| SBP (mmHg) | 0.046 | 1.047 (0.996–1.101) | 0.072 |
| DBP (mmHg) | 0.006 | 1.006 (0.950–1.066) | 0.839 |
| 24 h SBP (mmHg) | 0.055 | 1.056 (0.823–1.356) | 0.667 |
| 24 h DBP (mmHg) | −0.232 | 0.793 (0.535–1.175) | 0.248 |
| D SBP (mmHg) | 0.203 | 1.225 (0.932–1.610) | 0.146 |
| D DBP (mmHg) | −0.109 | 0.896 (0.732–1.099) | 0.292 |
| N SBP (mmHg) | 0.099 | 1.104 (0.957–1.274) | 0.174 |
| N DBP (mmHg) | −0.013 | 0.987 (0.858–1.136) | 0.859 |
| PP (mmHg) | −0.056 | 1.045 (0.730–1.113) | 0.647 |
*Indicates significant correlation at the 0.05 level (two tailed).
HNP-1, human neutrophil peptide-1; SBP, systolic blood pressure; DBP, diastolic blood pressure; 24 h SBP, 24 h systolic blood pressure; 24 h DBP, 24 h diastolic blood pressure; D SBP, daytime systolic blood pressure; D DBP, daytime diastolic blood pressure; N SBP, night systolic blood pressure; N DBP, night diastolic blood pressure; PP, pulse pressure.
HNP-1 Treatment Decreases BP in NE-Induced HLVH Rats
After injection with NE, in the fifth week, the SBP and DBP began to be significantly higher in the NE group than the control group (Figure 2A and B). In the NE group, SBP increased by 22.43 mmHg, and DBP increased by 25.96 mmHg (from baseline BP) after injection with NE for 10 weeks (Figure 2E). However, after HNP-1 injection, SBP and DBP decreased over time (Figure 2C and D). Finally, SBP and DBP were considerably lower in each NE plus HNP-1 treatment group than in the NE group (Figure 2F).
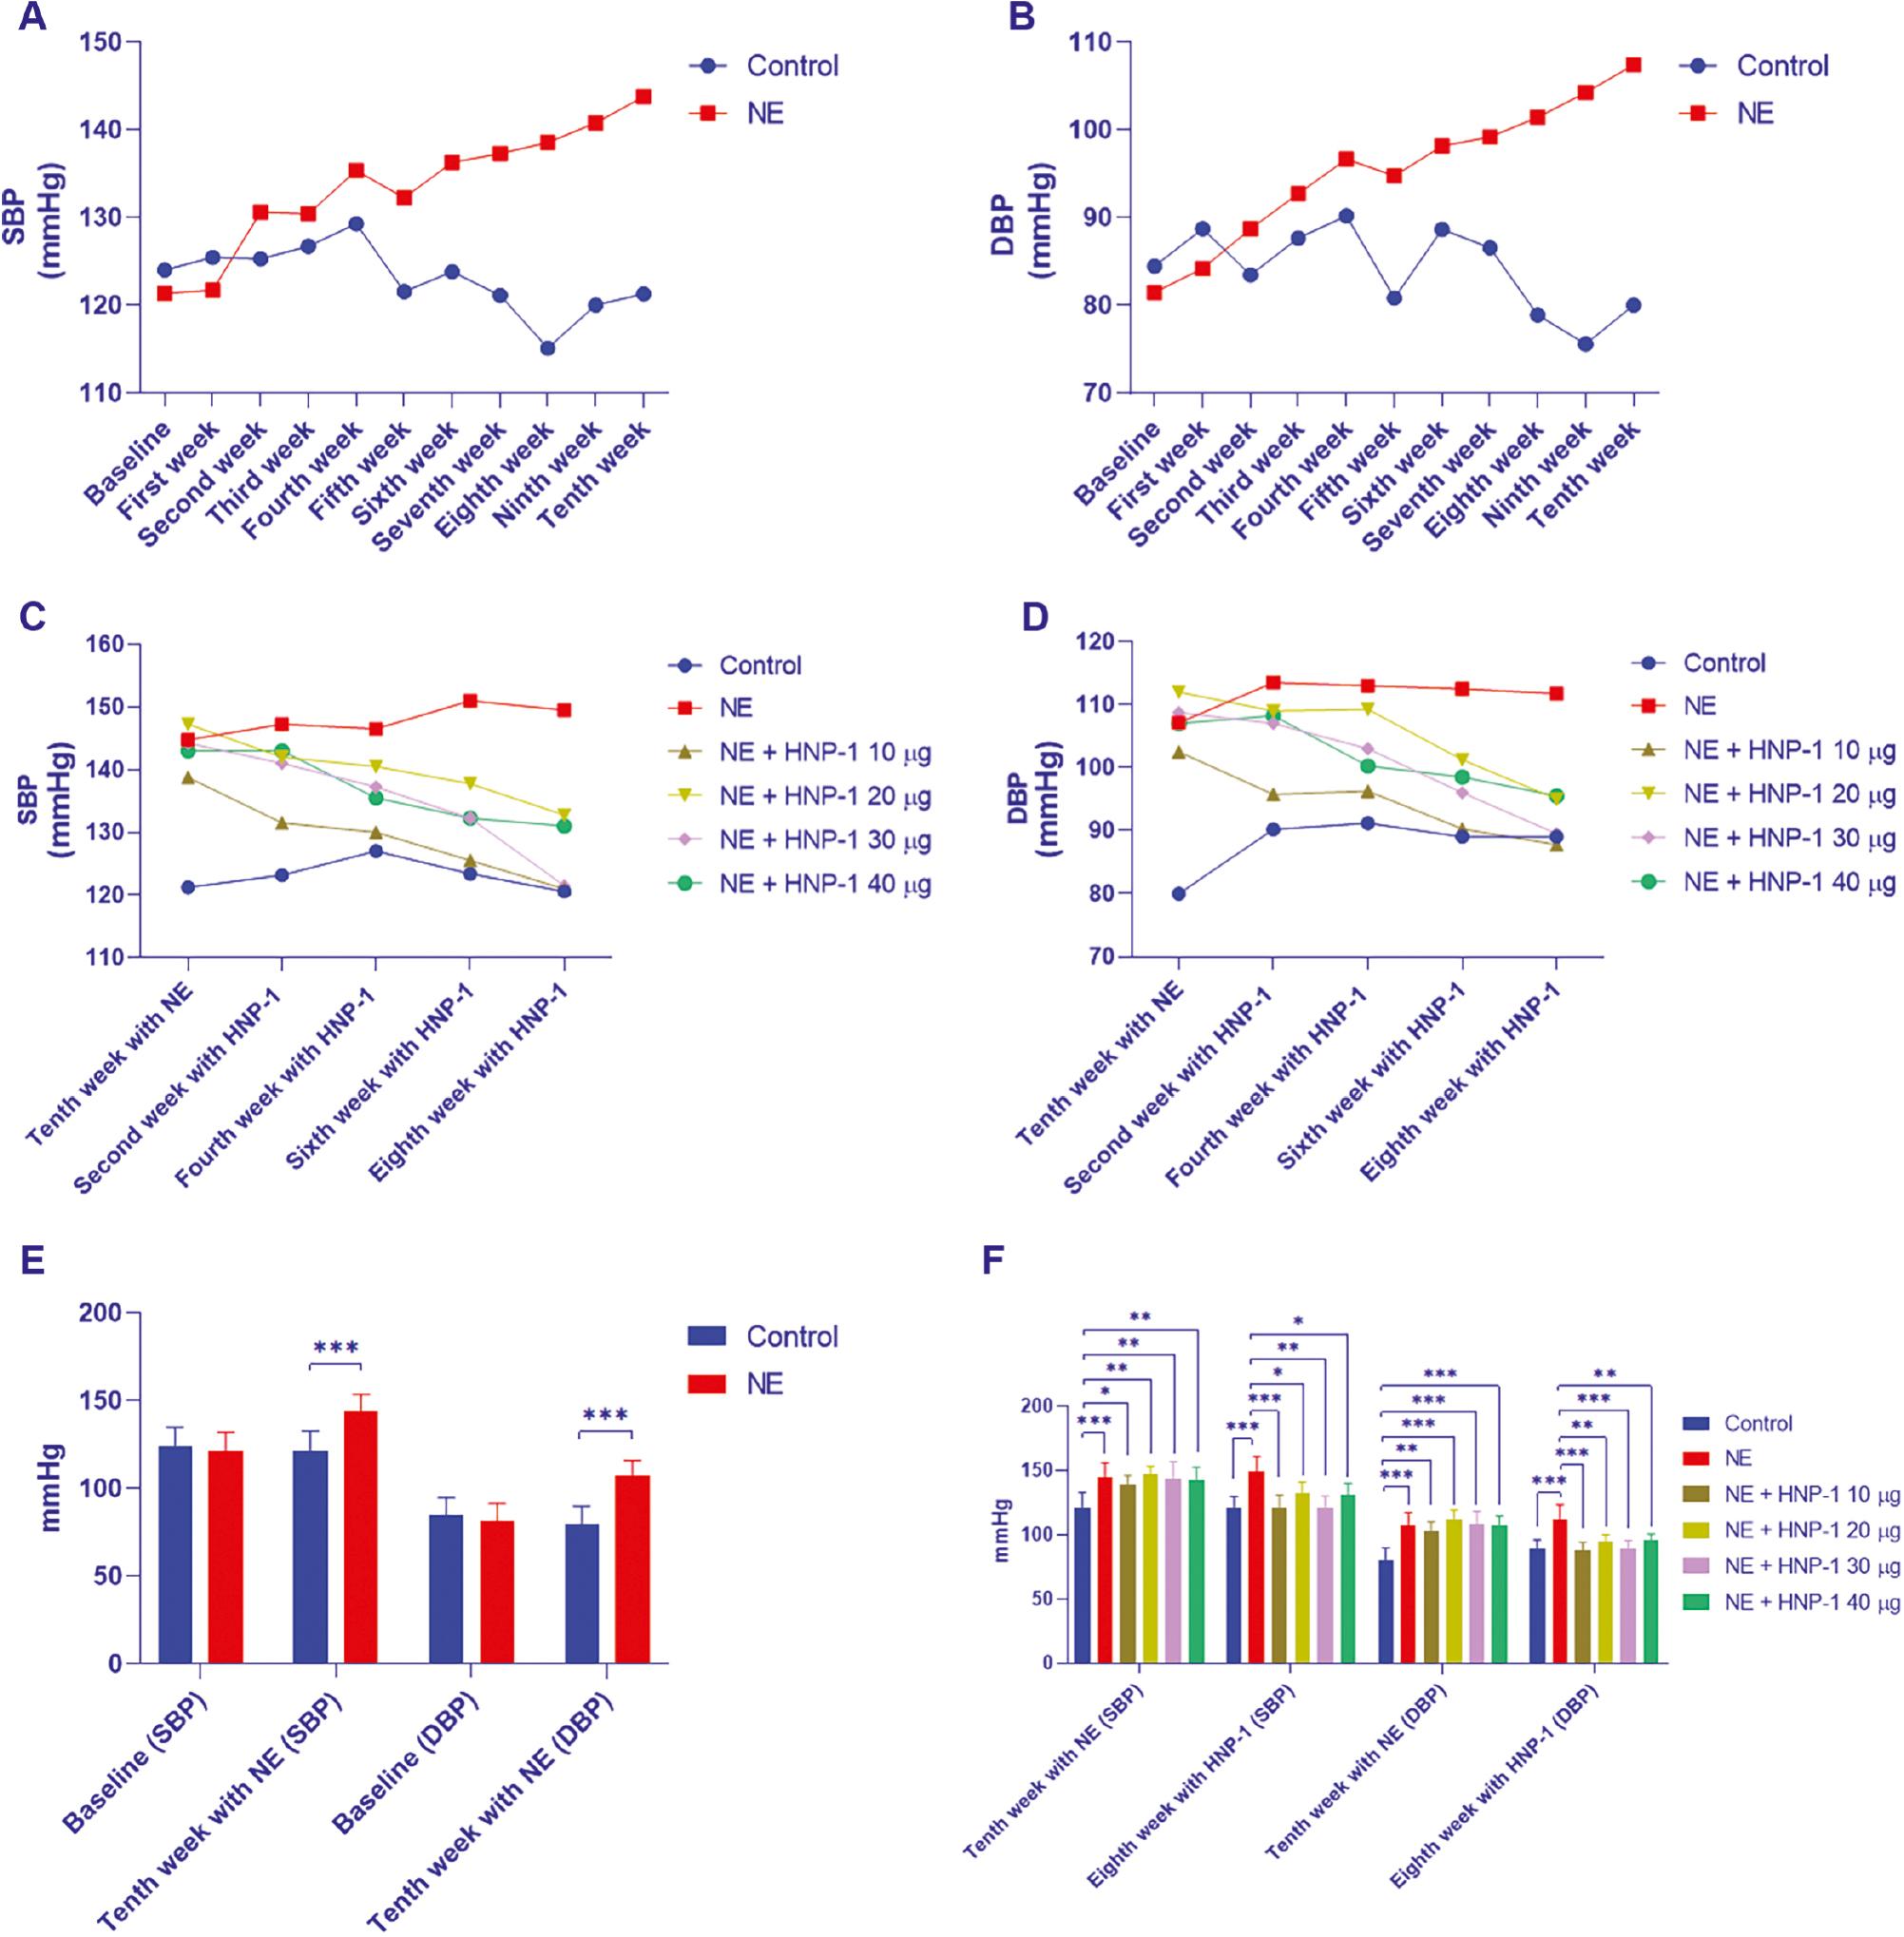
Levels of SBP and DBP.
A and B, SBP and DBP levels during injection with NE; C and D, SBP and DBP levels during injection with HNP-1; E, SBP and DBP levels between baseline and the tenth week of NE injection; F, SBP and DBP levels between the tenth week of NE injection and eighth week of HNP-1 injection. *P < 0.05, **P < 0.01, ***P < 0.001. SBP, systolic blood pressure; DBP, diastolic blood pressure.
HNP-1 Treatment Increases Left Ventricular HNP-1 Expression in NE-Induced HLVH Rats
Immunohistochemistry staining indicated that HNP-1 was expressed primarily on the cardiomyocyte membranes in the left ventricle in rats. Furthermore, left ventricular HNP-1 expression decreased in the NE group than the control group. Left ventricular HNP-1 expression was greater in the NE plus HNP-1 groups than the NE group, and the effect was dose-dependent (Figure 3).
HNP-1 Treatment Ameliorates Ventricular Hypertrophy and Fibrosis in NE-Induced HLVH Rats
The HW/BW and HW/TL ratios were significantly higher in the NE group than the control group, and significantly lower in each NE plus HNP-1 treatment group than the NE group (Figure 4A). Hematoxylin-eosin staining revealed that left ventricular single cardiomyocyte surface area was greater in the NE group than the control group. Furthermore, the left ventricular single cardiomyocyte surface area was smaller in each NE plus HNP-1 treatment group than the NE group (Figure 4B). In addition, Masson’s trichrome staining indicated that the left ventricular fibrosis area was greater in the NE group than the control group. However, compared with that in the NE group, the left ventricular fibrosis area was lower, to varying degrees, in each NE plus HNP-1 treatment group (Figure 4B).
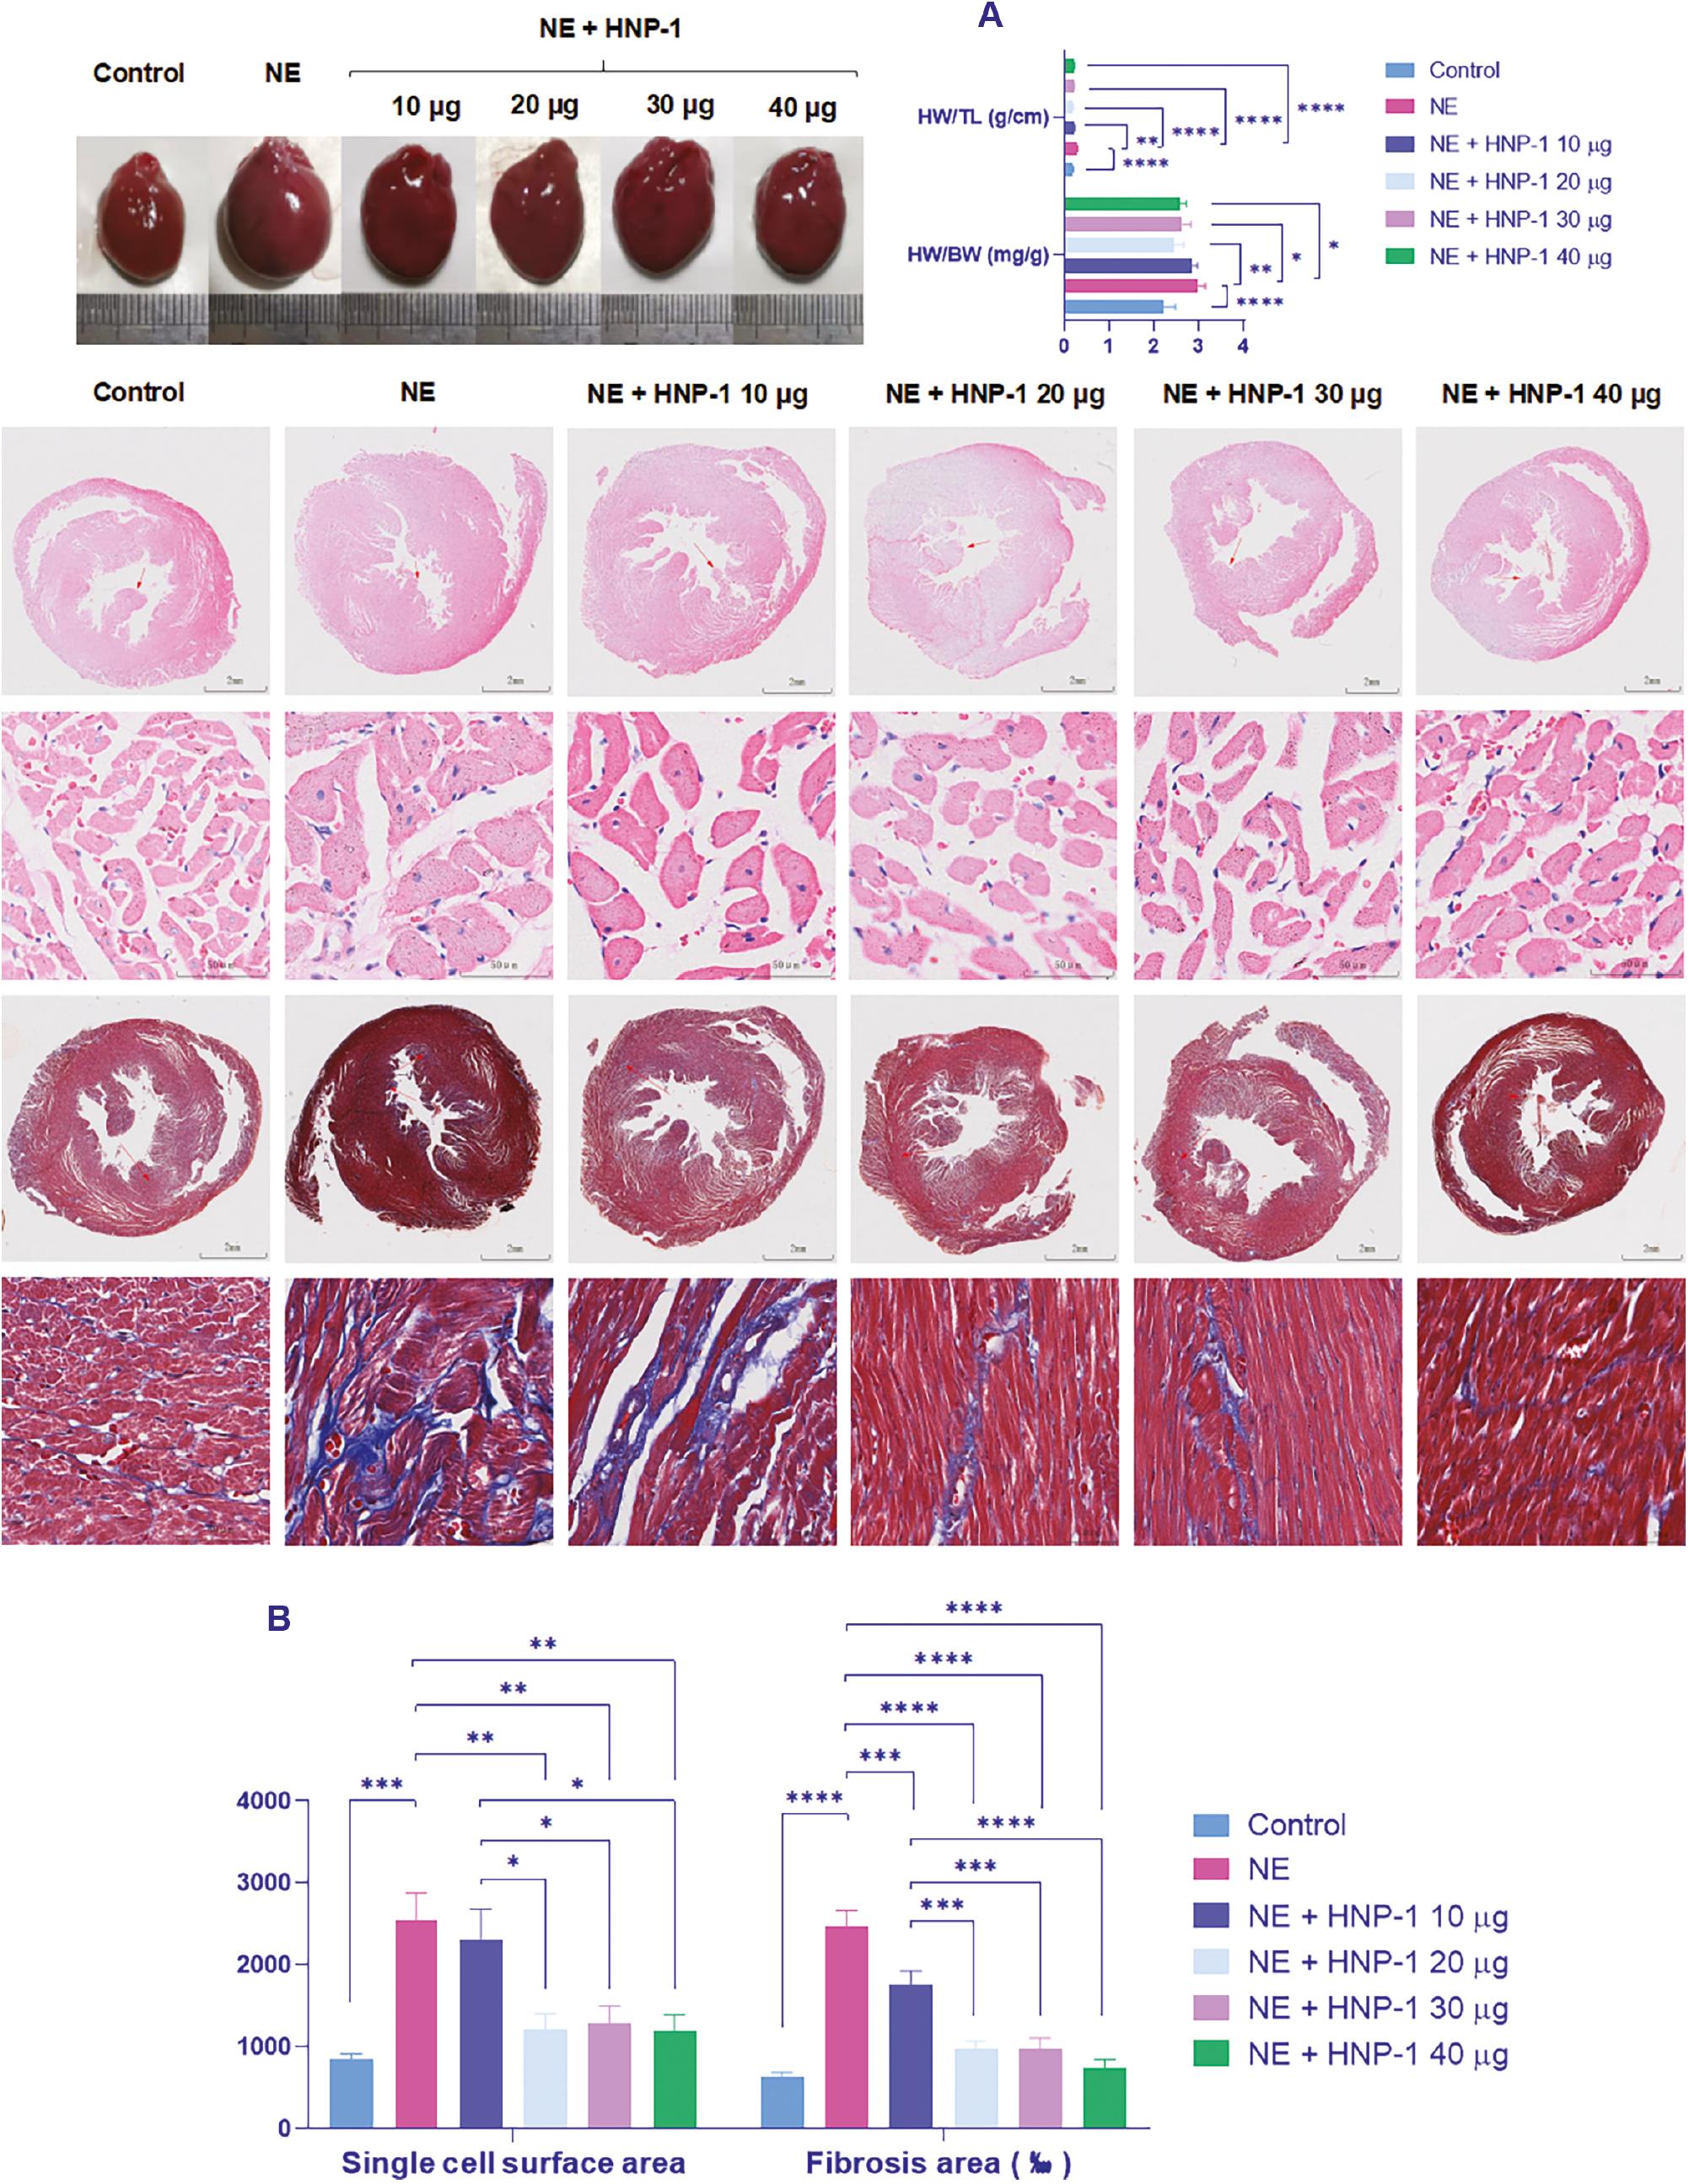
Left Ventricular Myocardial Cell Surface Area and Fibrosis Area.
A, Quantitative analysis of HW/BW and HW/TL; B, left ventricle single cell surface area and fibrosis area. *P < 0.05, **P < 0.01, ***P<0.001, ****P < 0.0001. HW/BW, heart weight to body weight ratios; HW/TL, heart weight to tibia length ratios.
HNP-1 Treatment Decreases the Expression of BNP, β-MHC, and NF-кB in NE-Induced HLVH Rats
Western blotting (WB) revealed that the left ventricular expression of BNP, β-MHC, and NF-кB signaling factors (including p-IKKβ/IKKβ, p-IкBα/IкBα, and p-p65/p65) was higher in the NE group than the control group. However, compared with that in the NE group, the expression of the aforementioned proteins was lower, to varying degrees, in the NE plus HNP-1 treatment groups (Figure 5).
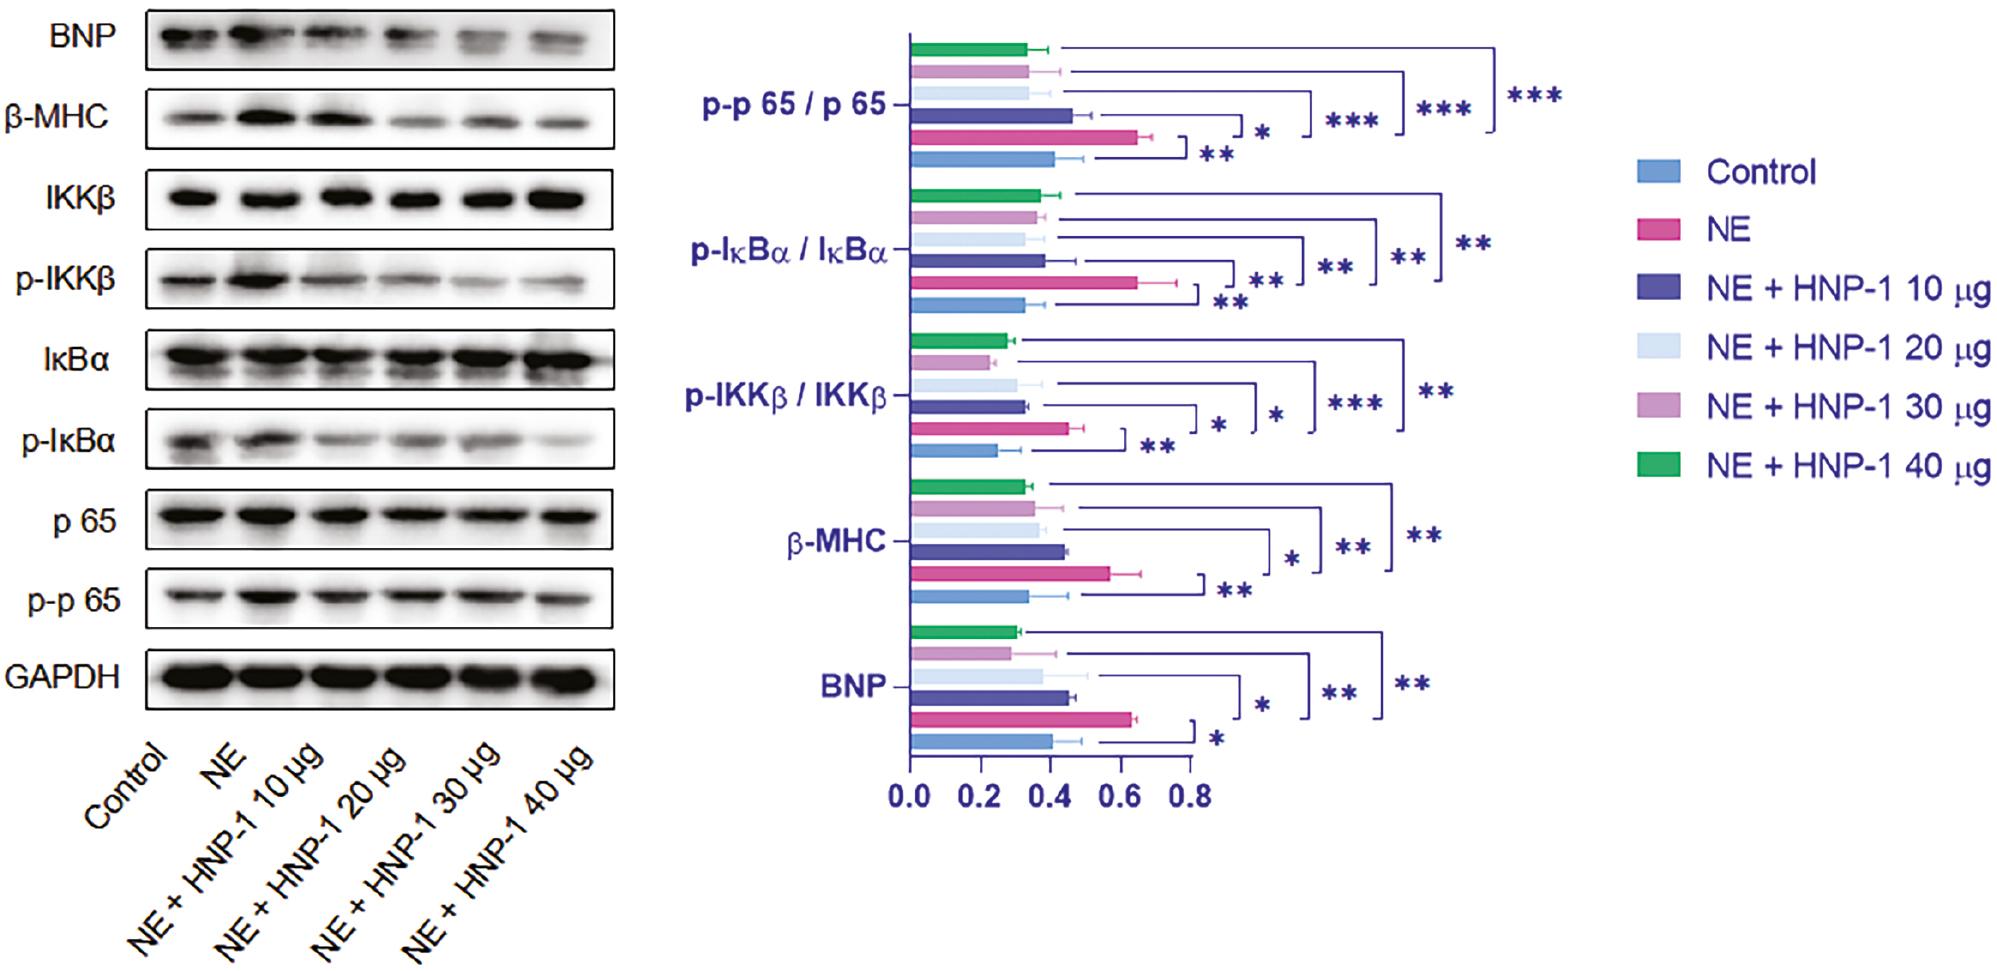
Protein Levels of BNP, β-MHC, and NF-κB Signaling Factors in the Left Ventricle.
Representative Images of WB and Quantitative Analysis for the Protein Expression of BNP, β-MHC, and NF-κB in the Left Ventricle. *P < 0.05, **P < 0.01, ***P < 0.001. BNP, brain natriuretic peptide, β-MHC, beta-myosin heavy chain.
HNP-1 Treatment Promotes H9c2 Cell Growth Activity and Reverses Ang II-Induced H9c2 Cell Hypertrophy
CCK8 assays indicated that HNP-1 promoted H9c2 cell growth viability. Indeed, H9c2 cell growth activity was higher after stimulation with HNP-1 at 10 and 15 μg/mL for 72 hours than after stimulation with HNP-1 at 5 and 20 μg/mL for 24 and 48 hours, respectively (Figure 6A). Immunofluorescence analysis revealed that the single-cell surface area was greater in the Ang II group than the control group. However, compared with that in the Ang II group, the single cell surface area was smaller, to varying degrees, in each Ang II plus HNP-1 group (Figure 6B).
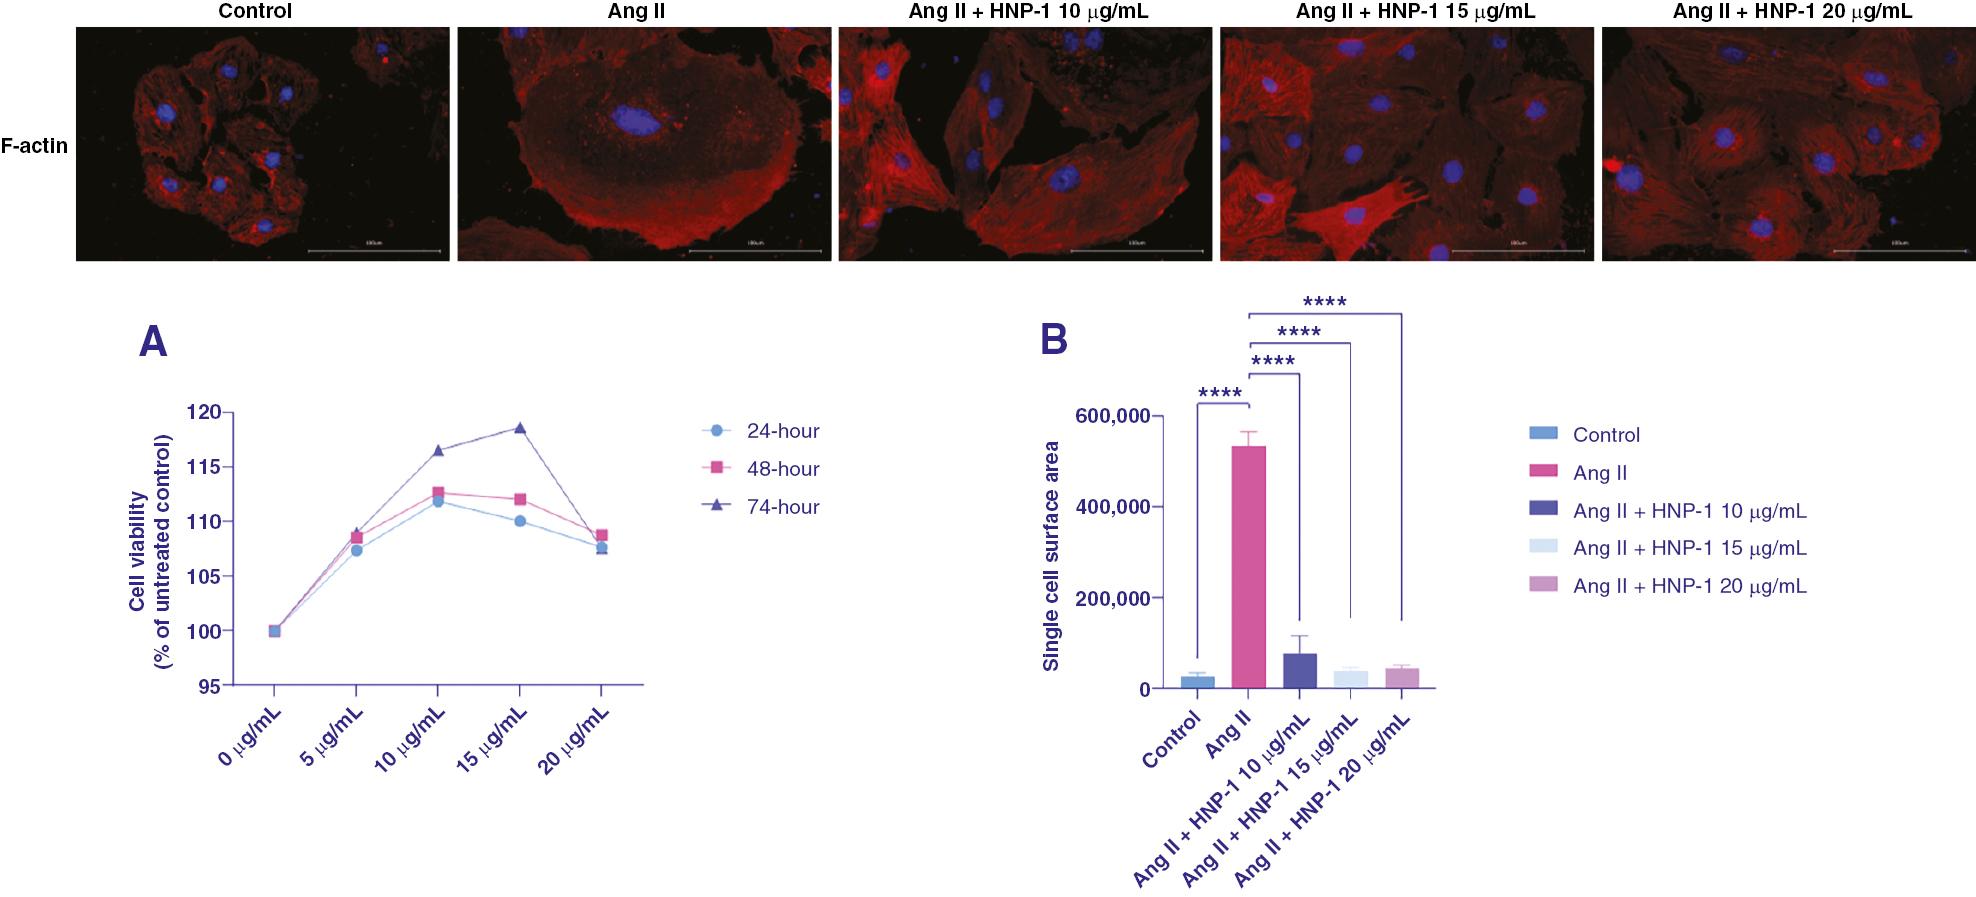
Cell Viability and Single Cell Surface Area.
A, Cell growth viability measured with CCK8 assays after treatment with HNP-1 for 24, 48, or 72 hours. B, Quantitative analysis of single cell surfaces. Cells were stained with an anti-F-actin antibody (red), and nuclei were stained with DAPI (blue). ****P < 0.0001.
HNP-1 Treatment Decreases the Expression of BNP, β-MHC, NF-кB, and Inflammatory Factors in Ang II-Induced H9c2 Cell Hypertrophy
WB analysis indicated that HNP-1 levels decreased in the Ang II group compared with the control group, but it increased in the Ang II plus HNP-1 treatment groups compared with the Ang II group (Figure 7A). WB and qPCR also revealed that BNP, β-MHC, p65, and p-p65/p65 expression increased in the Ang II group compared with the control group, but those indexes decreased in each Ang II plus HNP-1 group to varying degrees compared with the Ang II group (Figure 7A and B). Additionally, the IL-1α, IL-6, and TNF-α levels were lower in the Ang II plus HNP-1 groups than the Ang II group, particularly after treatment with HNP-1 at 15 μg/mL and 20 μg/mL (Figure 7C).
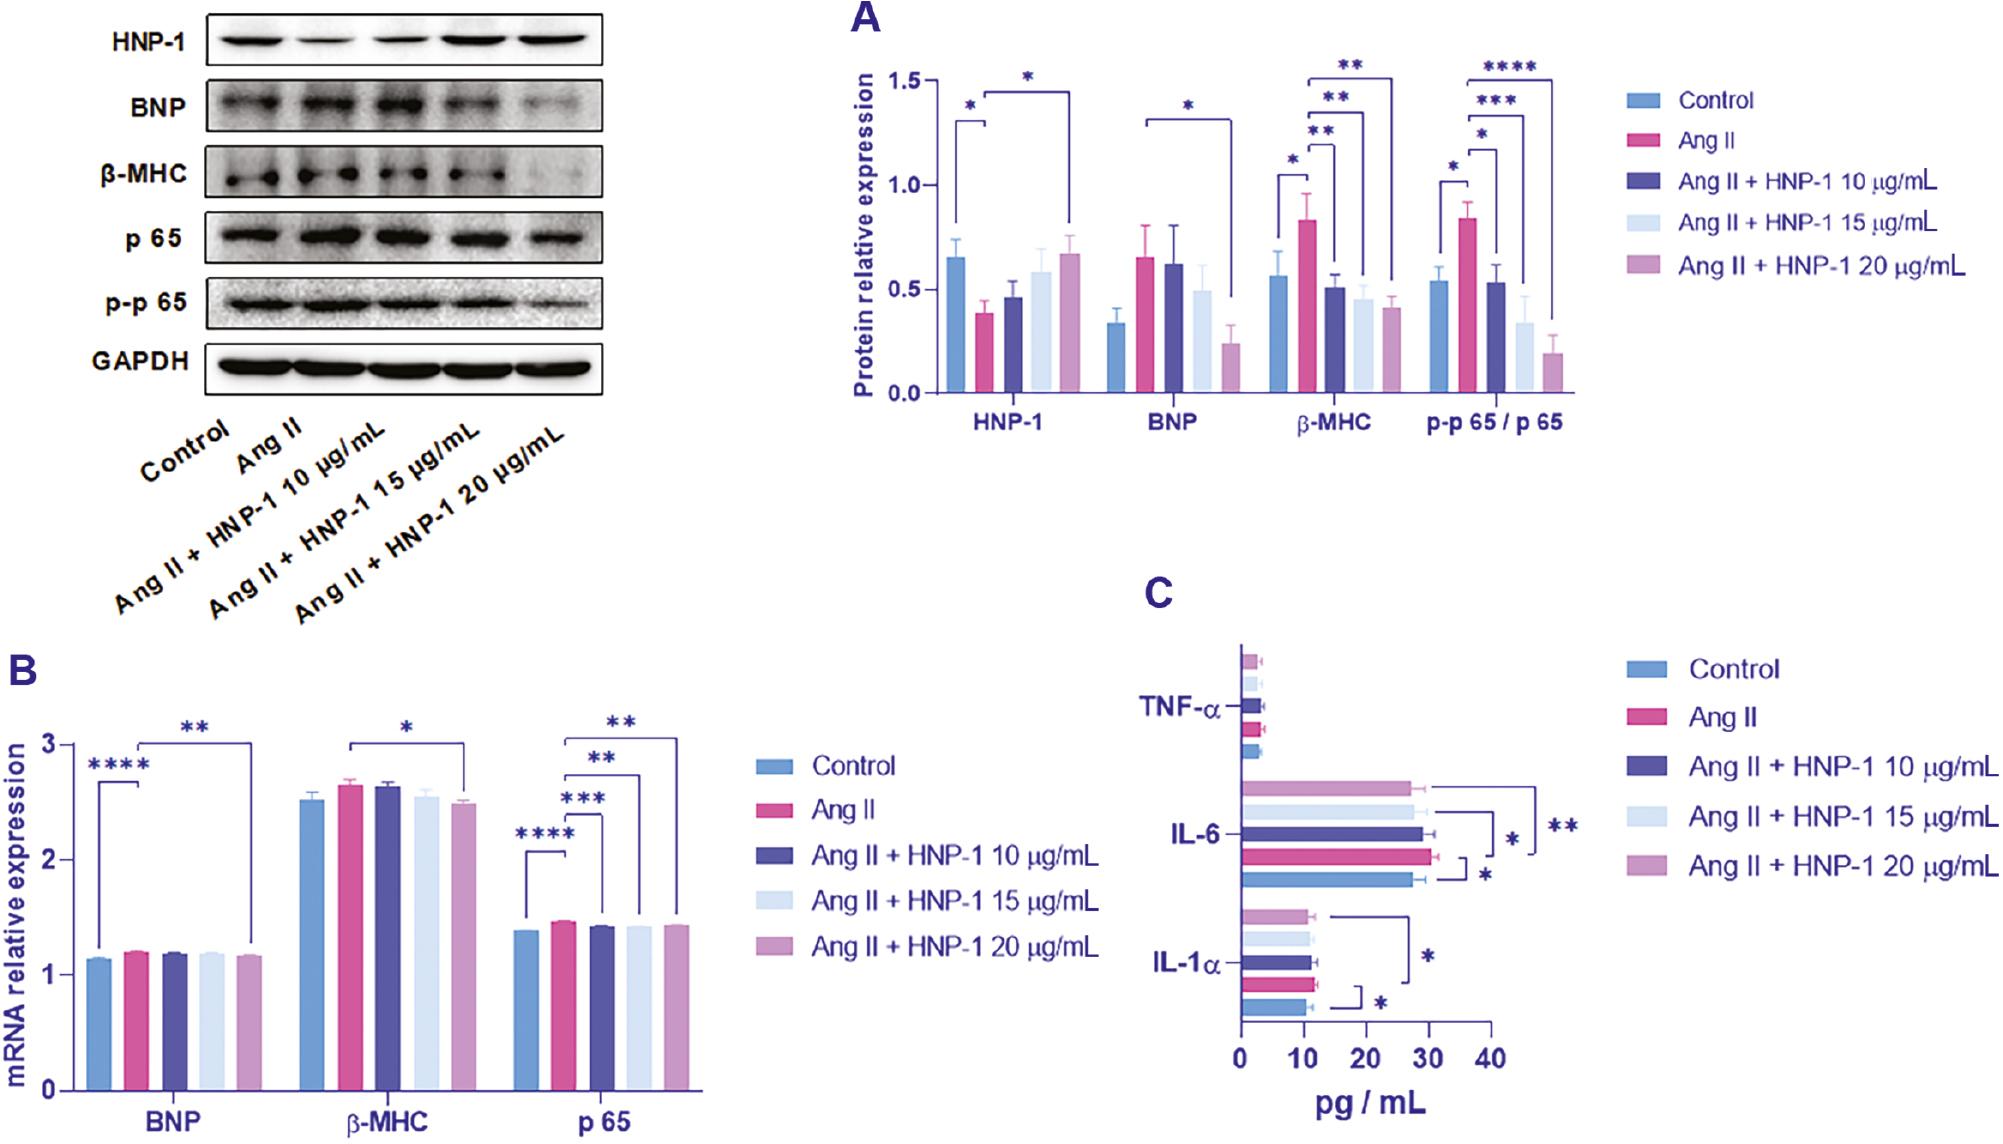
Expression of HNP-1, BNP, β-MHC, p65, and Inflammatory Factors in H9c2 cells.
A, WB and quantitative analysis of the protein expression of HNP-1, BNP, β-MHC, and p-p65/p65 in H9c2 cells. B, qPCR and quantitative analysis of the mRNA expression of BNP, β-MHC, and p65 in H9c2 cells. C, ELISA and quantitative analysis of IL-1α, IL-6, and TNF-α levels in H9c2 cells. *P < 0.05, **P < 0.01, ***P < 0.001, ****P < 0.0001.
Discussion
This study demonstrated that HNP-1 levels were diminished in patients with HLVH and were a risk factor for HLVH. In the experimental HLVH model, HNP-1 treatment decreased NF-кB and other heart hypertrophy markers. These findings indicated that HNP-1 reverses HLVH and may be a potential therapeutic target for cardiovascular disease. HNP-1 is the first cell-synthesized peptide demonstrated to directly enter a target cell, and subsequently affect translation and regulate protein expression [48]. Furthermore, HNP-1 is widely found in various tissues and organs but is expressed primarily in human neutrophil lineage cells [29, 49–54]. The HNP-1 gene is located on chromosome 8p23.1 [54–57]. In neutrophil lineage cells, HNP-1 is translated into a 94-amino-acid precursor form in promyelocytes and is sequentially cleaved into a 30-amino-acid mature HNP-1 in the Golgi apparatus [58, 59]. The mature HNP-1 is stored in the blue granules, and can be released by cell degranulation or secretion [54].
Previous studies have reported diminished HNP-1 levels in older people, smokers, people who are toothless or have tooth decay, and people with lipid metabolism disorders or vasodilation responses [60–62]. Decreased HNP-1 is associated with aging, decreased immune resistance, lipid metabolism disorders, and a diminished vasodilation response [63, 64]. Similarly to previous studies, this study indicated that HNP-1 levels were diminished in patients with HLVH and were a risk factor for HLVH.
This current study also demonstrated that HNP-1 treatment may decrease BP in HLVH rats, although the BP did not change in a dose-dependent manner. This finding has three possible explanations. First, HNP-1’s BP-lowering effect might potentially be associated with baseline BP levels. Second, HNP-1 may have a “bipolar effect,” such that inflammatory factor expression may be enhanced by a high dose of HNP-1 (100 μg/day) and inhibited by a healthy dose of HNP-1 (5 μg/day or 10 μg/mL) [65]. Third, studies have reported that regulation of the inflammatory response effectively controls BP and ameliorates HLVH [65–71]. However, NF-кB is a key regulatory signaling pathway in inflammatory immune responses [72–75], and NF-кB inhibition may ameliorate hypertension and HLVH [76–86]. We determined that HNP-1 may inhibit NF-кB activation, but this inhibitory effect may not be dose-dependent.
According to our study, HNP-1 treatment increased HNP-1 expression in a HLVH rat model. In contrast, Kou et al. [34] have reported that HNP-1 treatment does not increase HNP-1 expression in RSC 96 cells. Two possible explanations may be responsible for this difference in findings. The first is associated with differences between experimental models. Specifically, Kou et al. [34] studied RSC 96 cells in the nervous system, whereas our study focused on rat left ventricular tissue and H9c2 cells. Second, the HNP-1 treatment dose and duration differed between studies. Kou et al. [34] treated RSC 96 cells with HNP-1 at 4 or 8 μg/mL for 36 hours. In contrast, we treated HLVH rats with HNP-1 at 10, 20, 30, or 40 μg for 8 weeks, and H9c2 cells with HNP-1 at 10, 15, or 20 μg/mL for 72 hours. Furthermore, HNP-1 expression was notably associated with the treatment dose of HNP-1. HNP-1 expression was weak when the HNP-1 treatment dose was 10 μg in rats and 10 μg/mL in H9c2 cells, and was enhanced as the treatment dose of HNP-1 increased. Future studies are warranted to explore whether this effect might be due to increased endogenous HNP-1 or exogenous HNP-1.
This current study indicated that HNP-1 treatment inhibited the activation of NF-кB in an HLVH model. However, other studies have reported differing effects of HNP-1 on NF-кB signaling pathways. For example, Kou et al. and Wang et al. [29, 34] have found that p65 expression increases in Schwann cells and CAL-1 cells after treatment with HNP-1. However, mRNA expression of AKT in Schwann cells shows lower activity when treated with 8 rather than 4 μg/mL of HNP-1. Other studies have reported that A549 cells and CD4 lymphocytes show no differences in p65 expression after treatment with HNP-1 [33, 43]. Finally, studies have indicated that HNP-1 may enhance [87] or inhibit [88] the activation of complement classical pathways. Therefore, we speculate that HNP-1 might have different regulatory effects on NF-кB signaling pathways in various tissues and cells under different experimental conditions. This study identified HNP-1’s protective role in HLVH; however, the specific underlying mechanisms warrant further study.


