Introduction
Cardiac transplantation is an efficient therapy for end-stage heart failure. Unfortunately, immune-mediated allograft rejection not only promotes graft failure but also impairs survival [1]. During the pathogenesis of transplantation-related immune reactions, various immune cells in both the innate and adaptive immune systems, including alloreactive T cells, B cells, and antigen-presenting cells (APCs), have been found to be activated. This activation results in cardiac inflammation and subsequent allorejection. Among the activated cells, T cells are essential mediators of allograft rejection. The priming and activation of alloreactive T cells in lymph nodes (LNs) is the main factor limiting long-term allograft survival [2–5]. However, although T cell-mediated organization of immune responses and influences on allogeneic organ transplant tolerance have been reviewed, the transcriptional programs of allogeneic T cells at the single-cell level remained unknown. Therefore, single-cell RNA sequencing (scRNA-seq) is necessary to better understand the global transcript levels and heterogeneity of immune cells, particularly T cells, after graft transplantation. The findings may support the development of novel therapeutic strategies for allograft rejection. The advent of scRNA-seq has enabled the profiling of specific cell populations at single-cell resolution. Unlike conventional bulk RNA sequencing methods, scRNA-seq is a powerful technique enabling unbiased identification of transcriptional changes in individual cell types across different conditions. Recently, considerable evidence has emerged regarding the use of scRNA-seq to elucidate the heterogeneity of different cells, including immune cells, in the contexts of cancer and other diseases [6–9]. Nevertheless, no research has focused on the single-cell transcriptomes of immune cells in LNs after cardiac transplantation. Therefore, we used scRNA-seq to gain deeper insights into the effects of allograft transplantation on the transcriptional signatures and heterogeneity of immune cells.
Here, we investigated the heterogeneity of several hundred individual immune cells isolated from LNs through scRNA-seq after cardiac transplantation. We first used scRNA-seq to construct a reference map and investigated the effects of cardiac transplantation on the transcriptional signatures and heterogeneity of immune cells, particularly T cells, in a syngeneic transplantation mouse model. Subsequently, we identified unique subsets through unsupervised clustering based on T cell transcriptomes, and analyzed the regulatory networks and signaling pathways in mice subjected to syngeneic and allogeneic cardiac transplantation. In addition, we identified and confirmed genes associated with allograft cytotoxic CD8+ T cells and activated CD4+ T cells, and discovered that regulatory T cells (Tregs) are dysfunctional under allorejection conditions. Moreover, we investigated Treg differentiation into Th17 cells under specific conditions and found that JunB might contribute to this process. Overall, we aimed to contribute to a growing area of research by exploring the heterogeneity of T cells during cardiac allograft rejection, to aid in the development of effective immunotherapy strategies. Our findings should guide biomedical research and inspire the next generation of transplantation-related therapies.
Methods
Data Availability
Transcriptional data generated in this study have been deposited in the National Center for Biotechnology Information Gene Expression Omnibus database under accession no. GSE160199.
Mice and Cardiac Transplantation
Male Balb/c or C57BL/6 mice (6–8 weeks of age, 18–20 g) were purchased and housed according to previously described protocols [10]. The donor aorta was sutured to the end to the side of the recipient abdominal aorta, and the donor pulmonary artery was anastomosed to the inferior vena cava of the recipient. In the allogeneic group, the donors were C57BL/6 mice, and the recipients were Balb/c mice. In the syngeneic group, both the donors and recipients were Balb/c mice. Graft survival was monitored through daily abdominal palpation postoperatively. When the heartbeat had completely ceased, graft rejection was considered to have occurred. Graft rejection was further confirmed through direct visualization and histologic examination of the graft. Each group included at least three mice. Some of the mice receiving cardiac transplantation were administered PX-478 (50 mg/kg, MCE, HY-10231) in phosphate-buffered saline (PBS) via intraperitoneal injection. The mice received injections once daily for 1 week before sacrifice. Subsequently, all mice were sacrificed and processed for immune cell isolation. Each group contained at least three mice.
Preparation of Single-Cell Suspensions
LNs were isolated from axillary region of the three BALB/c mice and ground in PBS. Through mechanical disruption of the tissues and passage through a 40 μm cell strainer (Corning, New York, NY, USA), single-cell suspensions of axillary LNs were produced from syngeneic and allogeneic groups (n=1). Erythrocytes were removed with red blood cell (RBC) lysis buffer, and the remaining cells were repeatedly washed and resuspended.
scRNA-seq, Library Preparation, and Alignment
The samples were processed with a Chromium Single Cell 3′ Library & Gel Bead Kit (10× Genomics, v2 and v3), according to the manufacturer’s protocol. The libraries were sequenced on an Illumina NovaSeq 6000 instrument. The raw sequencing data were processed in Cell Ranger (10× Genomics; v2.2.0 and v3.0.2). The CellRanger function “count” was used to align the raw reads with the STAR Aligner against the GRCm38 reference [11]. After the nonredundant unique molecular identifiers were counted, single-cell digital-expression matrices were obtained. Library preparation and sequencing were performed at OE Biotech Co., Ltd (Shanghai, China).
Single-Cell Clustering with Seurat
The CellRanger output matrices were loaded into the Seurat package (v2.3.4) by using R (v3.5.1). Library size normalization was performed with the “NormalizeData” function in Seurat to obtain normalized counts. The global-scaling normalization method “LogNormalize” was used to normalize the gene expression measurements for each cell to the total expression multiplied by a scaling factor (10,000 by default), and the results were log-transformed. A canonical correlation analysis performed to align the datasets with the “RunCCA” function, and calculation of the t-distributed stochastic neighbor embedding (t-SNE) projections and clustering (with the “FindClusters” function) were performed in the aligned subspace. Here, we used the R package SingleR with the reference transcriptomic dataset “scmca” to infer the cell of origin of each of the single cells and to identify the cell types.
Differential Gene Expression Analysis and Subpopulation-Specific Signature Generation
We used Seurat software to perform differential gene expression analyses, construct violin plots, and plot heatmaps (unless indicated otherwise). Differential expression analysis was conducted with a nonparametric Wilcoxon rank sum test. The gene signatures defining subpopulations within the analyzed cells were generated through differential expression analysis with an adjusted P threshold<0.05 and a |log2 (fold change)| threshold > 0.58. The resulting gene signatures for T cells, B cells, dendritic cells, natural killer (NK) cells, and nuocytes are listed in Table S1. Heatmaps of the top differentially expressed genes (DEGs) were plotted with Seurat’s “DoHeatmap” function with the following RGB color scheme: col.low=#0038e6, col.mid=#000000, and col.high=#FFFF00. The genes present in more than one gene signature were plotted only once in the heatmaps. Differential expression scatter plots were generated with the R ggplot2 package. Gene Ontology (GO) and Kyoto Encyclopedia of Genes and Genomes (KEGG) analyses were performed on DEGs with adjusted P values < 0.05 and |log2 (fold change)| values > 0.58. The Pearson correlation coefficients between clusters were calculated with the “cor” function in R and then visualized with the “corrplot” function.
GO Enrichment Analysis of DEGs
After obtaining the DEGs, we analyzed their GO enrichment and functions (according to GO annotations). The DEGs enriched in each GO entry were counted. The significance of DEG enrichment in each GO entry was calculated with a hypergeometric distribution test, which returned a P value of enrichment significance. A small P value indicated that a DEG was enriched in the GO entry. The formula for the test was
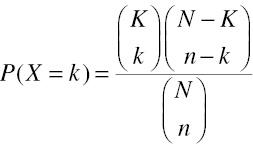
The formula for the enrichment score was as follows:
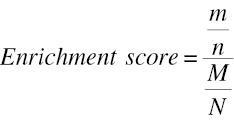
In these equations, N is the number of genes with GO annotations among all genes, n is the number of genes with GO annotations among the DEGs, M is the number of genes annotated with a specific GO term among all genes, and m is the number of DEGs annotated with the specific GO term. According to the results of the GO analysis and biological significance, we selected genes for follow-up analyses.
Single-Cell Trajectory Reconstruction and Pseudotemporal Ordering of T Cells
Pseudotime trajectory analysis was conducted with Monocle2. The raw count in the Seurat object was first converted into a CellDataSet with the “importCDS” (object, import_all=F) function in Monocle. Subsequently, we precalculated information about the data by using the “estimateSizeFactors()” and “estimateDispersions()” functions. We subsequently normalized the differences in mRNA recovery across cells according to size factors, then performed differential expression analysis with “dispersion” values. The “DifferentialGeneTest” function (fullModelFormulaStr=“~clusters”) in the Monocle2 package was used for ordering the selected genes (qval<0.01). The “SetOrderingFilter()” function was used to mark the ordered genes. Dimensionality reduction clustering analysis was performed with the “reduceDimension()” function with the following parameters: max_components=2 and reduction_method = “DDRTree”. Trajectory inference (the “orderCells” function) was performed with the default parameters [12].
Cell Culture and Transfection
T cells were purified from LNs through sorting, and then RBC lysis buffer (Beyotime, Shanghai, China) was used to remove the RBCs. We further obtained CD4+ T cells with magnetic-activated cell sorting with a mouse CD4+ T cell isolation kit (Miltenyi Biotec, Bergisch Gladbach, Germany). Subsequently, CD4+ T cells were stimulated at 37°C with 4 μg/mL plate-bound anti-Cd3 (eBioscience, San Diego, CA, USA) and 2 μg/mL soluble anti-Cd28 monoclonal antibodies (eBioscience, San Diego, CA, USA) for T cell receptor stimulation. For Th17 cell culture, CD4+ T cells were also treated with IL-6 (1.25 ng/mL) and TGFβ1 (0.3 ng/mL). After 72 h, the Th17 cell cultures continued to receive T cell receptor stimulation. CD4+ T cells were treated with JunB siRNA (siRNA-JunB) to knock down the expression of JunB or with negative control siRNA (siRNA-NC) (GenePharma, Shanghai, China) transfected with Lipofectamine 2000 (Invitrogen, Carlsbad, CA, USA).
Antibodies and Flow Cytometry
CD4+ T cells were immunolabeled with anti-CD4-FITC, anti-JunB-AF647, anti-CD69-PE, anti-Foxp3-PE, and anti-IL17A antibodies (BD Biosciences, San Jose, CA, USA) at 4 °C for 30 min. For IL17A staining, T cells were prestimulated with phorbol 12-myristate 13-acetate, ionomycin, and GolgiPlug (Sigma-Aldrich Corp., St. Louis, MO, USA) for 4–5 h. Subsequently, we washed the cells with PBS and acquired data with a FACSCanto II system (BD Biosciences, San Jose, CA, USA). The data were analyzed in FlowJo software.
qRT-PCR
We used TRIzol to extract RNA from CD4+ T cells or CD4+ T cells cultured under Th17 cell conditions. To quantify the amount of mRNA, we used a Transcriptor first-strand cDNA synthesis kit (Roche, Basel, Switzerland) according to the manufacturer’s instructions [13]. Reverse transcription was conducted for 60 min at 50 °C and for 5 min at 85 °C. PCR was conducted with Bestar SYBR Green qPCR Master Mix (DBI Bioscience, Germany) with the following program: 40 cycles of 10 s at 95 °C, 30 s at 60 °C, and 30 s at 72 °C.
BrdU ELISA for Human T Cell Proliferation
We maintained the T cells for 5 days in 96-well round-bottom microplates to assess T cell proliferation. Subsequently, we used a BrdU ELISA kit to quantify BrdU incorporation after incubation of the cultures with 10 mM BrdU for 24 h.
T Cell Metabolic Profile Determination
CD4+ T cells were sorted from the LNs and stimulated with anti-CD3/28 antibodies. Subsequently, the cells were plated at a concentration of 4 × 10⁶ cells/well in XFe24 plates (Seahorse Bioscience, North Billerica, MA, USA) and cultured for 12 h in RPMI 1640 medium, as previously described [14]. We used an XFe24 Extracellular Flux Analyzer (Seahorse Bioscience, North Billerica, MA, USA) to obtain the real-time oxygen consumption rate (OCR) and extracellular acidification rate (ECAR) values. XF Base Medium with 1 mM metabolic inhibitors (oligomycin, FCCP, rotenone, and antimycin A) (Seahorse Bioscience, North Billerica, MA, USA) was used to measure the OCR. XF Base Medium with 10 mM glucose, 1 μM oligomycin, and 50 mM 2-DG (Seahorse Bioscience, North Billerica, MA, USA) was used to measure the ECAR. Experiments were performed after 3 min of mixing, 3 min of waiting, and 3 min of measurement.
Statistical Analysis
The data are expressed as means ± standard deviations (SDs), n=5. The data were analyzed in SPSS 23.0 and GraphPad Prism 8. Some data were analyzed with analysis of variance with the Pyan method or Student’s t-test. A P value <0.05 was considered to indicate statistical significance. We used R to determine the correlations between two variables by calculating the Pearson correlation coefficient.
Results
Global Transcriptional Profiling of Immune Cells in LNs and Cell Type Identification in Mice Subjected to Syngeneic Cardiac Transplantation
LNs can confer an immediate and organized immune responses to fight against invading pathogens. Sterile inflammation occurs under syngeneic and allogeneic conditions after organ transplantation. For example, ischemia/reperfusion injury induces intragraft inflammation, which can have detrimental effects on long-term allograft function [15, 16].
However, how the gene profiles of immune cells change in LNs after transplantation was unknown. Therefore, we performed scRNA-seq with the 10× Genomics platform on immune cells in LNs from mice after syngeneic cardiac transplantation (Figure 1A). Most of the cells passed quality control, and 1665 genes were detected per cell. Saturation analysis indicated that important classes of genes including cytokines and transcription factors were detectable at the sequencing depth used. Alterations in the levels of biomarkers were visualized with an unsupervised hierarchical clustering heatmap. Eleven clusters of lymphoid cells were identified and visualized with unsupervised hierarchical clustering with t-SNE (Figure 1B). We used reference transcriptomic datasets to identify the cells in the different clusters (Figure 1C), such as T cells, B cells, dendritic cells, NK cells, and nuocytes. We were able to identify clusters belonging to all major cell populations in LNs. Four clusters (clusters 0, 1, 3, and 5) containing T cells represented the largest population of cell types, in agreement with T cells being the main immune cell components in LNs; in addition, three clusters (clusters 2, 4, and 6) were classified as B cells. The heatmap in Figure 1D the t-SNE maps in Figure 1F–1I show the expression of known marker genes, thus further confirming the presence of T cells (Figure 1F), B cells (Figure 1G), dendritic cells (Figure 1H), NK cells (Figure 1I), and nuocytes. In addition, we assessed which genes were differentially expressed within each cluster compared with all other clusters (Figure 1E, Table S1).
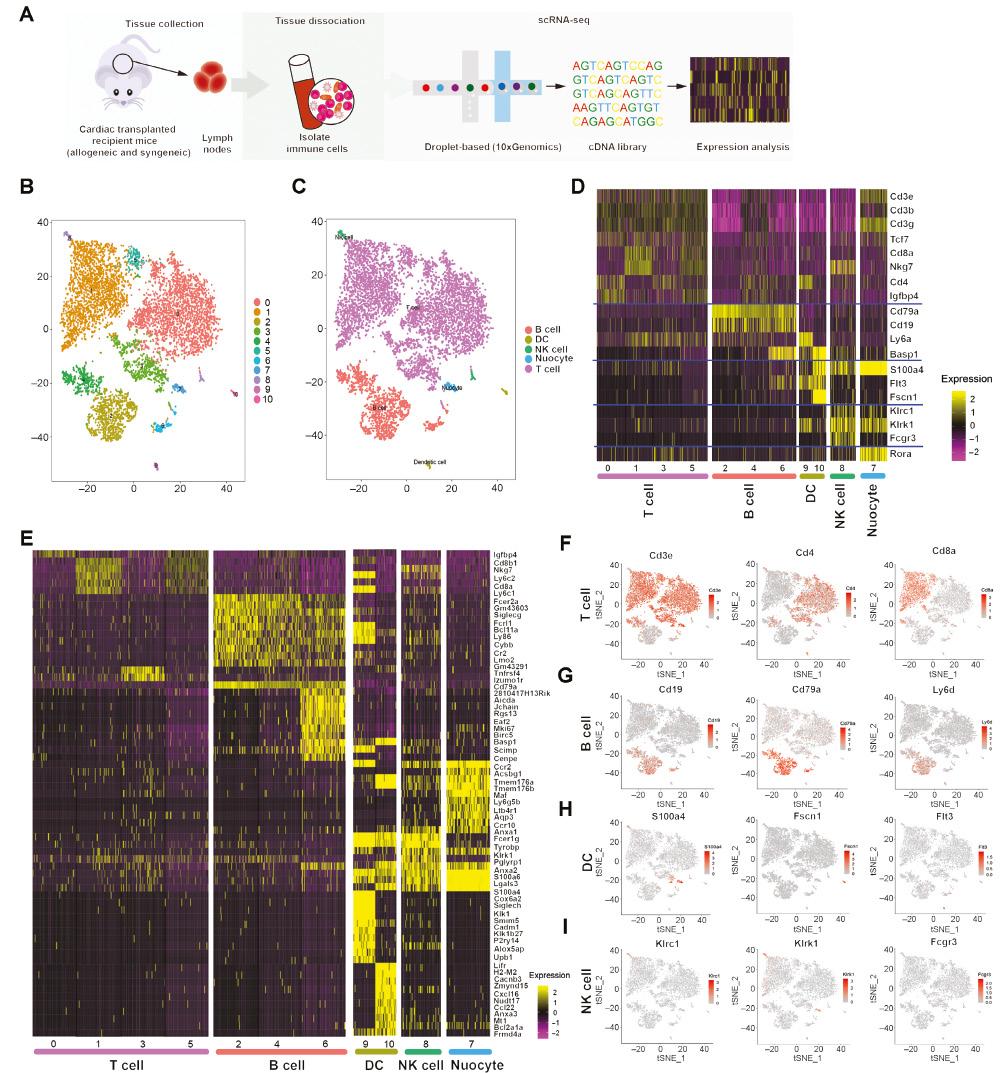
Single-Cell RNA Sequencing of Immune Cells in Lymph Nodes Reveals the Presence of 11 Cell Clusters.
A. Scheme of the overall study design. Single-cell RNA sequencing was applied to immune cells of lymph nodes derived from cardiac transplanted mice, and the output data were used for expression analyses. B. t-SNE projection of 7967 single immune cells (each point represents a single cell) in lymph nodes from syngeneic cardiac transplanted mice sharing similar transcriptome profiles, grouped by color according to unsupervised clustering results. C. Cluster map showing the assigned identity for each cluster defined in (B). D. Heatmap analysis with known gene expression profiles of T cells, B cells, DC cells, NK cells, and nuocytes. E. Top ten upregulated DEGs (ranked by log fold change) of each cluster in immune cells, plotted in a heatmap. F-I. t-SNE maps indicating the expression of selected well-established cellular markers in cell populations identified as (F), T cells, (G), B cells, (H), DC cells, and (I), NK cells.
Through this analysis, we generated single-cell gene expression profiles of immune cells in mice subjected to syngeneic cardiac transplantation and identified all major cell types in LNs. We also identified sets of characteristic DEGs corresponding to the functions of these immune cells. Our immune map depicts the baseline landscape of the composition and functional states of immune cells in LNs and provides a framework for understanding the cellular basis of syngeneic cardiac transplantation.
scRNA-seq Identification of a Distinct Gene Expression Signature in T Cells of Mice Subjected to Syngeneic Cardiac Transplantation
To further resolve the intrinsic T cell heterogeneity in the LNs of mice subjected to syngeneic cardiac transplantation, we applied unsupervised clustering based on T cell transcriptomes and identified ten clusters. Each cluster of T cells was classified according to the expression of the well-established markers Cd8a and Cd4 (Figure 2A). We identified three CD8+ clusters, six CD4+ clusters, and a CD4+CD8+ cluster (Figure 2B). We also identified characteristic genes with different features and functions among the T cell subpopulations (Figure 2C, Table S2).
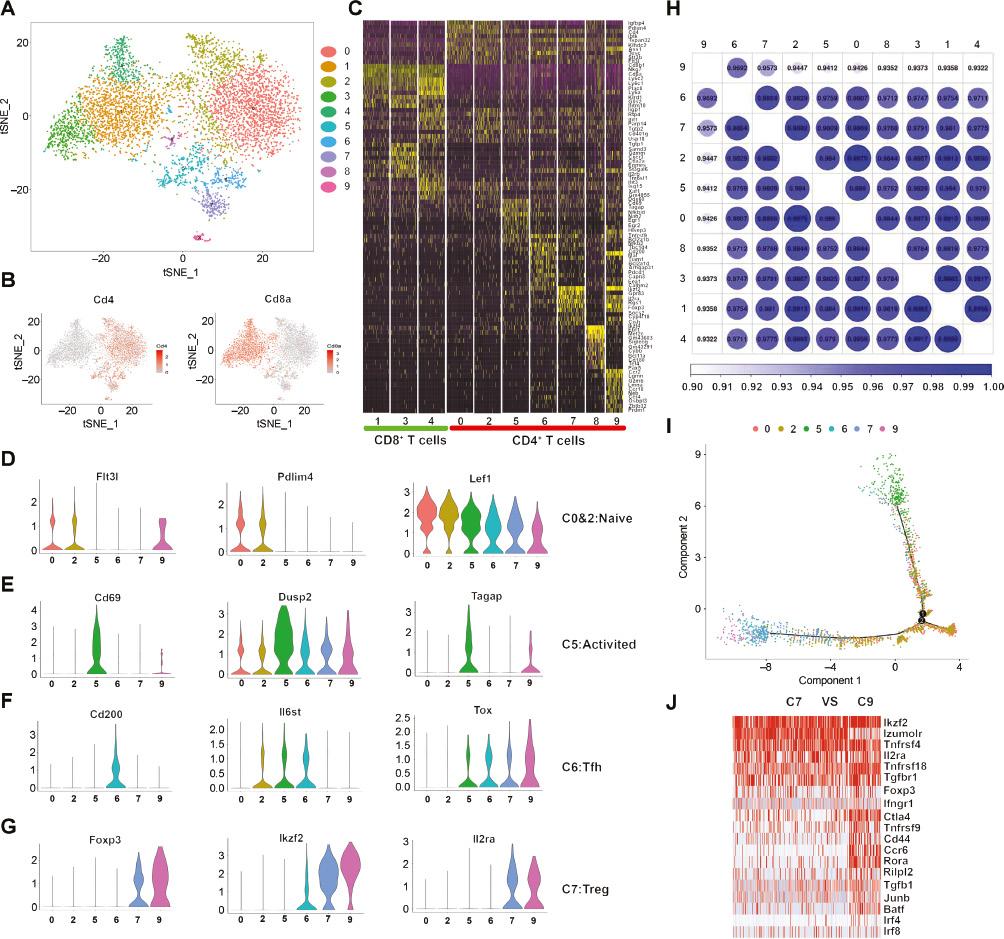
T Cell Subtype Analysis in Syngeneic Cardiac Transplanted Mice, on the Basis of Single-Cell Gene Expression.
A. t-SNE projection of the T cell cluster identified in the syngeneic cardiac transplanted mice, indicating the formation of nine main clusters, shown in different colors. B. t-SNE maps showing expression of Cd4 and Cd8a. C. Top ten upregulated DEGs (ranked by log fold change) of each cluster in T cells, plotted in a heatmap. D-G. Violin plots of key significant genes for clusters 0 and 2 (D), 5 (E), 6 (F), and 7 (G). H. Globular diagram showing the transcriptional similarity between CD4+ T cell subsets from allogeneic cardiac transplanted mice. The color depth and numerical value are in direct proportion to the transcriptional similarity. I. The branched trajectory of the CD4+ T cell state transition in a two-dimensional state-space, inferred by Monocle 2. Each dot corresponds to a single cell and is colored according to its cluster label. J. Heatmap showing expression of DEGs associated with Th17 or Treg cells between cluster 9 and cluster 7.
Traditionally, CD8+ T cells are classified as cytotoxic or noncytotoxic, according to their surface marker expression or cellular function. Our scRNA-seq analysis similarly identified two distinct populations of CD8+ T cells (Figure S1A and B): population 1 (cluster 3; Figure 2A) and population 2 (cluster 1 and cluster 4; Figure 2A). CD8+ T population 1 was characterized by enriched expression of Ctla2a and Gzmm, thus suggesting that this cluster might represent cytotoxic T lymphocytes [17]. To further verify the function of population 1, we compared the DEGs between populations (Table S3). Population 1 had significantly higher expression of Ccl5, Ctla2a, Itm2a, Xcl1, Cxcr3, Samd3, Nkg7, Il2rb, Cst7, H2afz, Slamf6, Ahnak, and St3gal6 (the top DEGs) than population 2. In agreement with the earlier findings, the DEGs in this cluster suggested that these CD8+ T cells were cytotoxic. For example, XCL1, a C class chemokine also known as lymphotactin, plays an important role in the immune-cell-mediated cytotoxic response. Similarly, CCL5 is critical for the chemotaxis and infiltration of T cells [18, 19]. GO analysis confirmed the unique functionality of population 1, and revealed that the upregulated genes were enriched in terms associated with cytotoxicity (Figure S1C). Our data revealed the presence of two distinct populations of CD8+ T lymphocytes that appeared to segregate into cytotoxic and noncytotoxic phenotypes.
Violin plots were constructed to display the three characteristic genes in four subsets of CD4+ T cells (Figure 2D–2G). Cluster 0 and cluster 2 shared similar gene signatures, and most resembled naive T cells, because they were enriched in both Pdlim4 and S1pr1, which mediate T cell egress from the thymus and migration to secondary lymphoid organs [20]. Lef1 and Flt3l, which are involved in early T cell development [21, 22], were also expressed in these two clusters (Figure 2D). Activated cells were observed in cluster 5, as characterized by the expression of Cd69, Dusp2, and Tagap [23, 24] (Figure 2E). Cluster 6 highly expressed genes associated with Tfh cells, such as IL6st, Tox, Cd200, and Rilp12 [21] (Figure 2F). Cluster 7 was enriched in Ikzf2, Il2ra (Cd25), and Foxp3 mRNA (Figure 2G), which are indicative of a Treg phenotype. Furthermore, cluster 3 contained CD4+ and CD8+ T cells and lacked clear DEGs, thus potentially indicating that the cells had mixed phenotypes. Interestingly, cluster 9 was transcriptionally similar to Treg cluster 7, as indicated by a correlation analysis between these two clusters (Figure 2H). We examined the DEGs and found that cluster 9 was enriched in Treg-like signatures (e.g., Ikzf2, Ctla4, Foxp3, and Il2ra) and Th17-like signatures (e.g., Ccr6, Rora, Tgfb1, and Batf) (Table S4). Compared with cluster 7 (Treg), cluster 9 had lower expression of Izumo1r and higher expression of Ccr6, Rora, and Batf (Figure 2J). Trajectory mapping of these cells further indicated that cluster 9 represented an intermediate stage differentiated from Tregs under syngeneic transplantation conditions (Figure 2I). Collectively, these data identified and confirmed the presence of a unique Treg cluster under syngeneic transplantation conditions.
In conclusion, we used scRNA-seq to establish the heterogeneity of T cells in LNs from mice subjected to syngeneic cardiac transplantation. Our scRNA-seq data provide deeper insights into the effects of syngeneic cardiac transplantation on the signatures and heterogeneity of T cells in LNs. The unique transcriptomes of T cells might provide ideas for understanding the origins and functions of these two major populations (CD8+ and CD4+ T cells) under syngeneic cardiac transplantation conditions.
Single-Cell Sequencing of Lymphoid Cells from Mice Subjected to Allogeneic Cardiac Transplantation
T cells form an important driver of the adaptive immune response to allografts. The alloimmune response mediated by T cells results in acute allorejection and contributes to decreased allograft survival [2, 5]. To better reveal the mechanism of the T cell-mediated alloimmune response and explore the influences of heart graft mismatch on inter- and intracellular changes in gene expression at the single-cell level, we sequenced cells from mice subjected to allogeneic cardiac transplantation, at an average depth of 1.8 million uniquely mapped read pairs per cell, thereby enabling reliable detection of weakly expressed cytokines and transcription factors. We combined all single-cell transcriptomes of LN immune cells from mice subjected to syngeneic and allogeneic cardiac transplantation (Figure S2A-D). Because T cells were the largest immune cell population in LNs, showing a profound transcriptional response to cardiac transplantation, we next reclustered the total T cell population and identified nine cell clusters through unsupervised analysis (Figure 3A). After examining the library origin, we observed that cells in clusters 2, 4, and 7 were predominantly from the allogeneic group, whereas the rest of the clusters contained cells from the syngeneic group (Figure 3B and 3C).
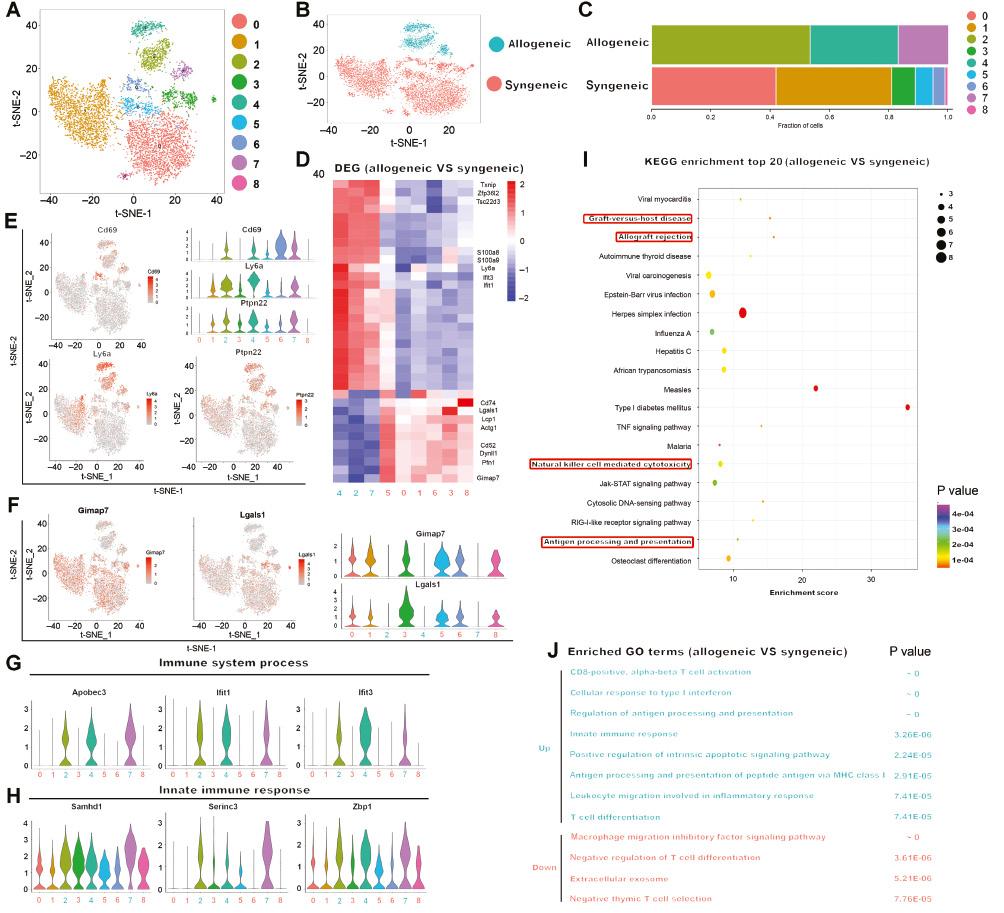
Single-Cell Sequencing of T Cells in Lymph Nodes from Syngeneic and Allogeneic Cardiac Transplanted Mice.
A-B. t-SNE map indicating transcriptomic similarities of T cells in lymph nodes between isografts and allografts. Numbers in (A) highlight the clusters identified in isografts and allografts. Colors in (B) highlight the conditions of the lymph nodes from which the cells were derived (isografts in red and allografts in green). C. Bar plot showing the proportions of cells in each of the identified T cell populations, colored according to cluster designation. Identified cell types are shown on the right. D. Heatmap showing differentially expressed genes of T cells between syngeneic and allogeneic cardiac transplanted mice. Selected characteristic genes associated with T cells are denoted at right. E-F. t-SNE plots, color-coded by expression of the upregulated genes (E) or downregulated genes (F) in the allograft. Violin plots in the top right corners show the distribution of these upregulated or downregulated genes in various cell clusters. G-H. Violin plots demonstrating the expression of genes associated with “immune system process” (G) and “innate immune response” (H) for each cluster. I. Top 20 upregulated enriched KEGG pathways in allogeneic groups compared with syngeneic groups. Dot size represents the number of genes, and color represents the P value. J. Enriched GO terms and P values of DEGs from allogeneic groups vs syngeneic groups are indicated in two distinct colors (up-regulation: green; down-regulation: red).
A total of 467 significant DEGs were identified in the allogeneic group compared with the syngeneic group (Table S5, Figure 3D). Some genes were highly expressed in the allogeneic group, such as Ifit3, and Ifit1, which are signature transcripts associated with interferon-stimulated genes. The expression of additional genes that are characteristic of inflammatory conditions, such as S100a8 and Cd69 (Figure 3E), was also elevated in the allogenic group, thus indicating immune activation and acute allorejection [25–27]. In addition, the allogeneic group expressed relatively lower levels of genes associated with the survival and suppressive function of T cells than the syngeneic group (Figure 3F). For example, Gimap7 is a member of the GTPase IMAP family, which crucially regulates the survival of T cells during development, selection, and homeostasis [28, 29]. In addition, blockade of Lgals1 (galectin-1) significantly decreases the inhibitory effects of human and mouse CD4+CD25+ T cells [30]. GO and KEGG analyses were performed for these DEGs between the syngeneic and allogeneic groups (Figure 3I, Figure 3J), and the highly expressed genes were found to be involved in acute allograft rejection and the active immune response. The upregulated genes in the allogeneic group were enriched in the terms “cellular response to type I interferon,” “positive regulation of interferon-beta secretion,” and “positive regulation of type I interferon-mediated signaling pathway.” This finding is consistent with the abovementioned finding of interferon-stimulated genes in the allogeneic group. Some genes associated with immune system processes and the innate immune response were also upregulated in the allogeneic group (Figure 3G, 3H). Terms such as “CD8-positive, alpha-beta T cell activation” and “positive regulation of CD8-positive, alpha-beta T cell proliferation” were also prominent, thus indicating the activation and proliferation of CD8+ T cells in the allogeneic group. In addition, the GO term “leukocyte migration involved in inflammatory response” was enriched in the allogeneic group. All these enriched pathways in the allogeneic group strongly indicated an ongoing active inflammation state.
Identification of Genes Uniquely Associated with Cytotoxic CD8+, Activated Conventional CD4+, and Dysfunctional Tregs in Mice Subjected to Allogeneic Cardiac Transplantation
T cell clones produce different sets of cytokines or cell surface markers and have different biological functions in different immune microenvironments. To better understand the diverse heterogeneity and specific functions of T cell subsets under allorejection conditions, we identified three CD8+ clusters, six CD4+ clusters, and a cluster not well defined in our scRNA-seq database, according to the expression of Cd8a or Cd4. Analysis of the expression of signature genes and known functional markers suggested the existence of clusters of CD8+ (naive, effector) cells, conventional CD4+ (naive, effector) cells, and CD4+ Tregs (Figure 4A), each with unique signature genes.
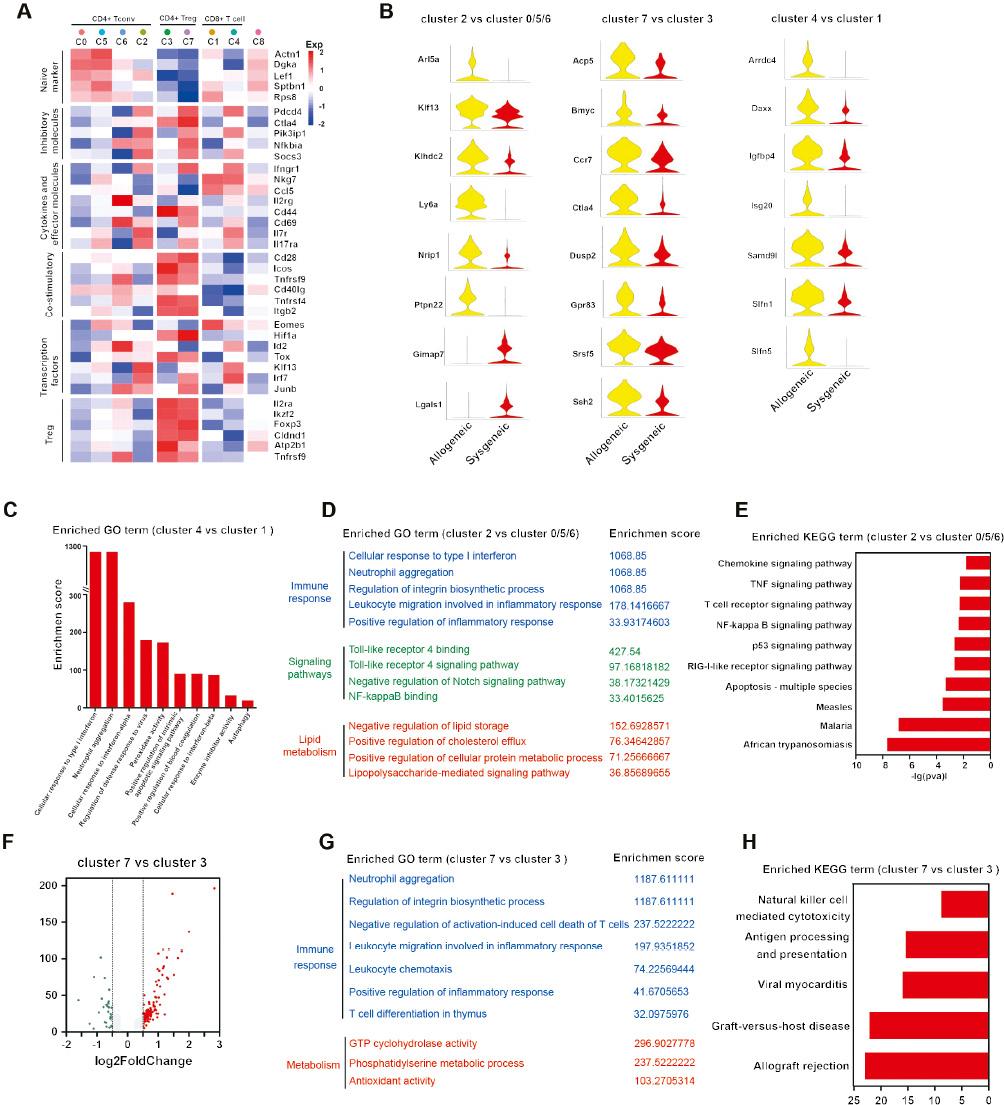
Association of Transplant Rejection with the Preferential Enrichment of Cytotoxic CD8+ T, Activated CD4+ T, and Dysfunctional Treg Cells in the Allograft Microenvironment.
A. Heatmap showing the expression of selected T cell function-associated genes in each cell cluster. Black boxes highlight the prominent patterns defining known T cell subtypes. B. Violin plots showing the expression of characteristic genes in different T cell subtypes between allografts and isografts. C. Graph of P values for selected upregulated GO terms enriched in CD8+ T cells, according to GO analysis. D. GO term and KEGG pathway analysis. E. Enrichment analysis of DEGs significantly upregulated in allogeneic conventional CD4+ T cells. F. Volcano plot showing differentially expressed genes between the cluster 7 (allogeneic Treg) and cluster 3 (syngeneic Treg) populations. G. GO term and KEGG pathway analysis (H) enrichment on DE genes that were significantly up-regulated in allogeneic conventional CD4+ T cells.
Among the CD8+ T cell subsets, cluster 1 expressed Sptbn1 and Rps8, indicative of a naive phenotype. However, the cluster 4 cells were highly enriched in genes associated with effector functions. Among CD4+ T cells, clusters 0 and 5 were dominant in the syngeneic group and highly expressed naive cell marker genes such as Lef1 and Actn1. The CD4+ clusters 2 and 6, the former of which was composed predominantly of cells from the allogeneic group, were characterized by high expression of the Ccl5 and Ifngr1 genes, which are commonly associated with T cell effector functions. Clusters 3 and 7 expressed high levels of the regulatory markers Foxp3, Il2ra, and Ikzf2, which are representative of CD4+ Tregs. To study CD4+ T cells in greater detail, we used pseudotime analysis to infer the developmental trajectories of CD4+ T cells. The results suggested a branched structure, in which the syngeneic and allogeneic groups were located nearly at opposite ends (Figure S2E and F). Tregs were positioned at the end opposite from both naive and effector T cells. Thus, pseudotime analysis suggested that the states of CD4+ T cells in the immune microenvironment shape two distinct processes – activation of T cells and differentiation of Tregs – in agreement with previous reports. Our database demonstrated the preferential enrichment of activated CD4+ and effector CD8+ cells in the allograft microenvironment. T cells exhibit various transcriptional profiles under different pathological conditions.
We further compared the DEGs in each T cell subset (the CD4+ and CD8+ T cell subsets) between the allogeneic and syngeneic groups. Among these allograft CD8+ T cell-specific genes, Daxx, a DNA-binding transcription factor, was highly expressed in allogeneic cardiac grafts. Recent research has shown that Daxx overexpression leads to enhancement of Fas-mediated apoptosis, which might be involved in the survival of T cells in mice subjected to allogeneic cardiac transplantation. Compared with cluster 1 (containing syngeneic CD8+ T cells), cluster 4 (containing allogeneic CD8+ T cells) had more genes that were enriched in the terms “positive regulation of intrinsic apoptotic signaling pathway” and “negative regulation of activation-induced cell death of T cells” (Figure 4C), thus indicating that the cells were cytotoxic CD8+ T cells. This finding is consistent with the abovementioned finding of activated or effector CD8+ T cells in the allogeneic group. Among conventional CD4+ T cells, cluster 2 (containing allogeneic CD4+ T cells), as compared with cluster 0/5/6 (containing syngeneic CD4+ T cells), exhibited 486 up- or downregulated genes (Figure 4B, Table S6). These included genes associated with the activated T cell phenotype, such as Cd69, Ly6a, and Ptpn22. Recent research has shown that Ptpn22 is expressed in response to the activation of naive CD4+ T cells. Similarly, the expression of Nrip1 was elevated in the allogeneic group; this protein has been found to promote the secretion of inflammatory cytokines in CD4+ T cells [31]. GO and KEGG analyses were performed for these DEGs (Figure 4D, Figure 4E). GO terms associated with interferon and inflammatory infiltration and responses were enriched in the allogeneic CD4+ cluster. In addition, terms such as “Toll-like receptor 4 signaling pathway” and “NF-kappa B binding” were also prominent in the allogeneic CD4+ cluster. Aseptic inflammation responses have been found to be initiated through TLR4-dependent signaling after cardiac transplantation [32]. In addition, terms associated with lipid metabolism, such as “negative regulation of lipid storage” and “positive regulation of cholesterol efflux,” were enriched in cluster 2. Likewise, the highly expressed genes in cluster 2 were found to be enriched in the terms “TNF signaling pathway,” “NF-kappa B signaling pathway,” and “p53 signaling pathway” in KEGG analysis. These findings suggest that innate signaling pathways and metabolic pathway reprogramming accelerate the activation of conventional CD4+ T cells in the context of allogeneic cardiac transplantation. Finally, compared with cluster 3 (in the syngeneic group), cluster 7 (allogeneic Tregs) had high expression of a set of 87 genes (P value<0.05, fold change >1.5) (Figure 4F, Table S7). Among these DEGs, Dusp2 expression was significantly upregulated in cluster 7 in the allogeneic group (Figure 4B). Dusp2hi effector T cells may lose their effector functions and proliferative ability and then become exhausted [33]. Furthermore, cluster 7 had diminished expression of Ikzf2 (Figure 4A), which encodes Helios, a transcription factor suggested to function as a Treg marker in mice [34]. Additional genes associated with immunosuppressive functions had diminished expression. For example, Tnfrsf9 (a known activation marker for antigen-specific Tregs) and Cxcr6 (which is necessary for the optimal recruitment of Tregs to sites of Th17-mediated inflammation) exhibited lower levels of expression in the allogeneic group than the syngeneic group [35, 36]. The changes in the differential expression profiles of genes indicated that decreases in Treg populations and attenuation of immunosuppressive functions contributed to acute allorejection. GO analysis indicated that the genes from cluster 7 in the allogeneic group were enriched in the terms “neutrophil aggregation,” “leukocyte migration involved in inflammatory response,” and “leukocyte chemotaxis” (Figure 4G), thus indicating that the ability to suppress leukocyte migration and aggregation was diminished in the allogeneic group. KEGG analysis further supported this finding, revealing gene set enrichment in pathways including “allograft rejection” and “antigen processing and presentation” in the allogeneic group compared with the syngeneic group (Figure 4H).
In summary, single-cell analysis of T cells in LNs from mice subjected to syngeneic and allogeneic cardiac transplantation revealed marked transcriptional heterogeneity; characteristic signature genes; and unique functional states including mixtures of cytotoxic, effector, regulatory, and naive T cells.
Allogeneic-Derived T Cell Clustering and Subtype Analysis
To reveal the intrinsic structures and potential functional subtypes of the overall T cell populations in LNs from mice subjected to allogeneic cardiac transplantation, we further performed unsupervised clustering of all T cells from the allogeneic group. Five stable clusters emerged, including four clusters for CD4+ cells and a cluster for CD8+ cells (Figure 5A and 5B). Each cluster could be strictly distinguished from the other clusters according to several genes. Cluster 0 specifically expressed genes associated with naive CD4+ T cells, such as Pdlim4, S1pr1, and Lef1 (Figure 5C). Cluster 2 was characterized by high expression of Ctla4, Ikzf2, and Foxp3, thus suggesting that the cells were Tregs (Figure 5D). Cluster 3 highly expressed mRNA encoded by interferon-stimulated genes (Figure 5E), such as Ifi44, Ifit1, Isg15, Isg20, and Usp18, which were indicative of the presence of Th1 cells (Figure 5F). The last cluster, cluster 4, characterized by specific expression of Il17a, Rora, Ccr6, and Batf, was composed largely of Th17 cells. Monocle was used to determine the temporal order of appearance of CD4+ T cells. The unsupervised pseudotime analysis revealed the developmental trajectory of CD4+ T cells from the allogeneic group (Figure 5G). Cluster 4 appeared later than cluster 2 and was transcriptionally similar to cluster 2 (Figure 5H), thus indicating a connection between Th17 cells and Tregs under alloimmune conditions. Unexpectedly, we detected an intermediate state of Tregs sharing a Th17-like signature under syngeneic cardiac transplantation conditions. Hence, we hypothesized that Treg differentiation into Th17 cells was induced in the alloimmune microenvironment. To analyze the differentiation between Tregs and Th17 cells, we combined four clusters of single-cell transcriptomes of T cells associated with Tregs and Th17 cells from the syngeneic and allogeneic groups into one analysis (Figure 5I-K). Trajectory analysis with Monocle revealed that clusters 7 and 2 contained Tregs from the syngeneic and allogeneic groups, respectively. Cluster 9 contained an intermediate stage from the syngeneic group, and cluster 4 contained Th17 cells from the allogeneic group. The trajectory analysis revealed a differentiation process from Tregs to Th17 cells during the immune response to allogeneic cardiac transplantation and passage through an intermediate stage during the immune response to syngeneic cardiac transplantation.
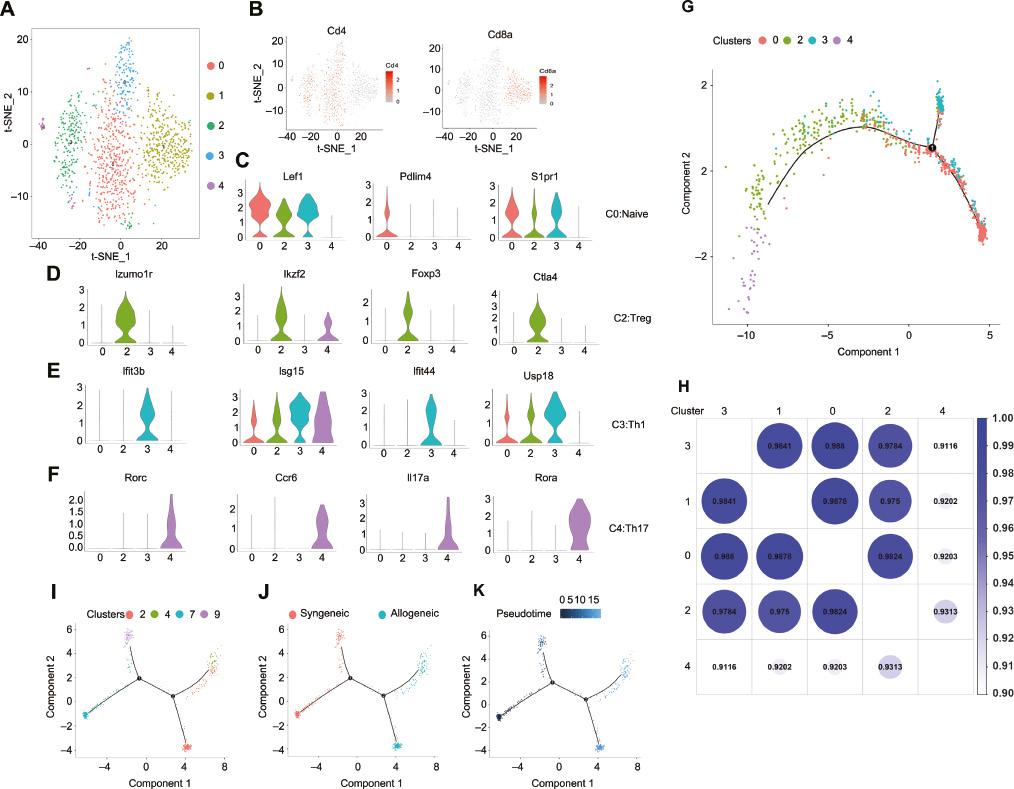
T Cell Subtype Analysis in Allogeneic Cardiac Transplanted Mice, on the Basis of Single-Cell Gene Expression.
A. t-SNE projection of the T cell cluster identified in the allogeneic cardiac transplanted mice, showing the formation of five main clusters, indicated in different colors. B. t-SNE maps showing expression of Cd4 and Cd8a. C-F. Violin plots of key significant genes for clusters 0 I, 2 (D), 3 I, and 4 (F). G. Branched trajectory of CD4+ T cell state transition in a two-dimensional state-space, as inferred by Monocle 2. Each dot corresponds to a single cell and is colored according to its cluster label. H. Globular diagram showing the transcriptional similarity between T cell subsets from allogeneic cardiac transplanted mice. The color depth and numerical value are in direct proportion to the transcriptional similarity. I-K. Trajectory analysis in Monocle 2 on cleaned syngeneic Treg (cluster 7), syngeneic Th17-like Treg (9), and allogeneic Treg (2) and allogeneic Th17 (4) cell clusters. (I) Trajectory plot showing the differentiation from Treg to Th17 cells. Colors in (J) indicate the T cell origin (red: isograft; green: allograft). Colors in (K) highlight the pseudotime trajectory of T cells.
JunB Partially Controls the Cell Fate Decision between Th17 Cell and Treg Development
To determine the causes of Treg differentiation into Th17 cells under allogeneic cardiac transplantation conditions, we compared the genes of cluster 7 Tregs and cluster 9 Th17-like Tregs from the syngeneic group and of cluster 2 Tregs from the allogeneic group. Among the 141 common DEGs from these three Treg/Th17 cell clusters, we identified 49 shared DEGs between cluster 7 Tregs and cluster 3 Tregs in the allogeneic and syngeneic groups (Figure 6A, B). Among these DEGs, the core transcription factor JunB was highly expressed in Tregs from allografts (Figure 6C). JunB, an activator protein-1 (AP-1) factor, has recently been reported to promote Th17 cell identity and coordinately represses genes controlling Treg fate [37]. On the basis of our data, we speculated that JunB might contribute to the differentiation of Tregs into Th17 cells.
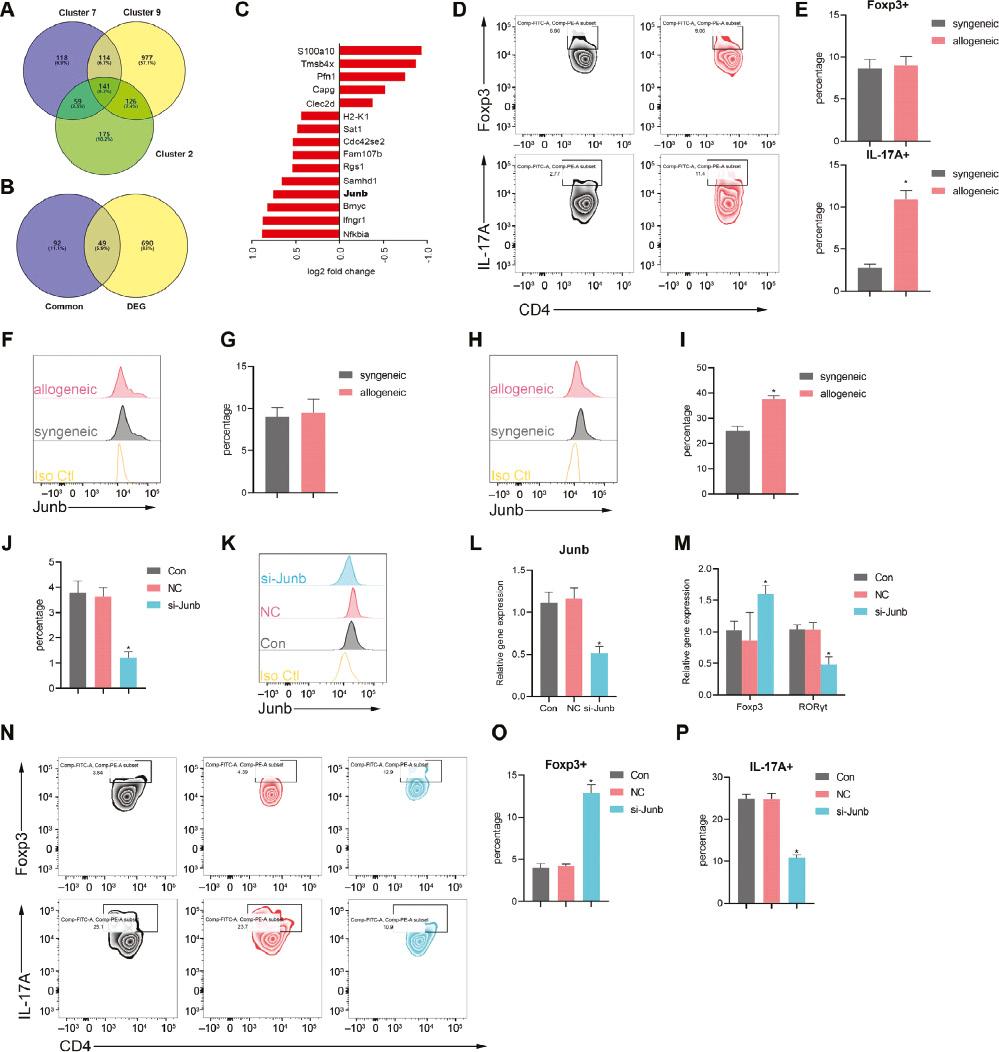
JunB Mediates the Differentiation of Treg to Th17.
A. Venn diagram showing the overlap of Treg-associated genes identified in cluster 7 and cluster 9 from isografts and cluster 2 from allografts. B. Venn diagram showing the overlap among the common Treg-Th17 signature genes identified in Figure 7A and DEGs in Tregs from isografts and allografts. C. Bar chart showing the top ten upregulated and top five downregulated genes in Figure 7B. D-E. Representative flow cytometric plots indicating the percentage of Th17 cells and Treg cells in lymph nodes of the isogeneic and allogeneic groups. F-I. Flow cytometry analysis of JunB expression in Th17 cells (F-G) and Treg cells (H-I) in lymph nodes of the isogeneic and allogeneic group. J-P. Naive CD4+ T cells isolated from the lymph nodes were stimulated with Th17-differentiating cytokines (IL-6 and TGF-β). (J) Relative level of JunB, determined by qRT-PCR in the control, si-JunB, and NC groups. (K-L) Flow cytometry of JunB expression in the control, si-JunB, and NC groups. (M) Expression of FoxP3 and RORγt, determined by qPCR. (N-P) Flow cytometry of sorting-purified CD4+ T cells cultured under Th17 conditions for 72 h (N), and percentages of Foxp3+ cells (O) and IL-17+ cells (P). Data are expressed as mean±SD; n=5 biological replicates; *P<0.05.
To further elucidate the role of JunB in Th17 cells and Tregs, we used flow cytometry to detect the proportions of Th17 cells and Tregs isolated from the LNs in mice with allogeneic and syngeneic heart grafts. Compared with the syngeneic group, the allogeneic group showed a greater percentage of Th17 (CD4+IL-17A+) cells; however, the percentages of Tregs (CD23+Foxp3+) were similar (Figure 6D, E). In agreement with the results obtained above, the expression of JunB was upregulated in allogeneic-group Tregs (Figure 6F-I). Given this finding, we wondered whether JunB might partially control development between Th17 and Tregs. To test this hypothesis, we performed gain- and loss-of-function experiments on naive CD4+ T cells stimulated with Th17-differentiating cytokines (IL-6 and TGF-β). We constructed siRNAs targeting JunB and transfected them into cells under Th17 differentiation conditions. Ablation of JunB resulted in overexpression of Foxp3 but diminished expression of RORγt (Figure 6M). JunB siRNA effectively suppressed the expression of JunB mRNA and protein (Figure 6J-L). In agreement with the quantitative real-time PCR (qRT-PCR) results, Foxp3 expression increased in the absence of JunB (Figure 6N, O), whereas IL-17A expression was abrogated in JunB-deficient cells (Figure 6N, P). Together, these findings indicated that JunB induces Th17 cell differentiation and limits Treg development.
Metabolic Heterogeneity of T Cells in LNs in the Allograft Microenvironment
Accumulating evidence suggests that the differentiation of T cells into distinct effector subsets is often accompanied by differential metabolic programming, and the metabolic programs used by T cells play essential roles in regulating the extent and characteristics of the immune response [38, 39].
To explore the metabolic transcriptomic changes in T cells in contrasting immune microenvironments, we selected numerous metabolic genes according to KEGG analysis and analyzed metabolic gene expression profiles at the single-cell level. We assessed the metabolic genes that were relatively differentially expressed in each cluster compared with all other clusters (Figure S3A). Subsequently, we identified changes in common and major metabolic pathways in T cells after cardiac transplantation (Figure 7A). Heatmap analysis revealed that most T cells in LNs from allografts exhibited different metabolic transcriptome signatures and significant metabolic heterogeneity. We also noted that activated CD4+ T cells and Tregs expressed additional metabolic genes and exhibited a variety of metabolic patterns, thereby suggesting that these T cells had elevated metabolic demand to execute their biological functions. We observed that Tregs in the allogeneic group (cluster 7) expressed additional metabolic genes associated with carbohydrate metabolism, lipid metabolism, and amino acid metabolism, whereas genes associated with energy metabolism were scarcely expressed. Interestingly, CD8+ T cells (cluster 4/1) from the syngeneic and allogeneic cardiac transplantation groups exhibited distinct and inverse metabolic transcriptome signatures. Focusing on glycan biosynthesis and metabolism (Figure S3B), we observed that Tregs in LNs from the allogeneic group exhibited upregulated expression of metabolic genes involved in glycosylphosphatidylinositol and O-glycan biosynthesis. In contrast, N-glycan biosynthesis genes were downregulated in Tregs from the allogeneic group. N-glycan, a common posttranslational modification, negatively regulates T cell proliferation and Th1 cell differentiation [40]. The downregulation of N-glycan in Tregs further confirmed the impairment of inhibition in Tregs from the allogeneic group, in agreement with previous findings. Additionally, cluster 4 (containing CD8+ T cells from the allogeneic group) expressed O-glycan biosynthesis genes more highly than cluster 1 (containing CD8+ T cells from the syngeneic group). The upregulation of O-glycan biosynthesis was strongly correlated with the acquisition of effector and cytotoxic functions in CD8+ T cells [41], thus again suggesting a cytotoxic status of CD8+ T cells under allogeneic cardiac transplantation conditions. Furthermore, T cells from the allogeneic group exhibited upregulation of transcripts of genes involved in sphingolipid metabolism (Figure S3C), such as members of the ceramide synthase family and Degs1. The products of these genes increase the production of sphingolipids, which contribute to the differentiation of inflammatory phenotypes in T cells and regulate the production of proinflammatory cytokines [42, 43]. We further determined the differences in metabolism-associated transcription factor pathways among clusters (Figure S3D). Interestingly, activated CD4+ T cells in the allogeneic group exhibited upregulated expression of genes in the PI3K-Akt signaling pathway, the HIF-1 signaling pathway, and the MAPK signaling pathway, thus indicating modulation of glycolysis in activated CD4+ T cells. In allogeneic Treg genes in the cAMP signaling pathway, the PPAR signaling pathway, and the AMPK signaling pathway were downregulated, thus suggesting the occurrence of low levels of oxidative phosphorylation (OXPHOS) and fatty acid oxidation in impaired Tregs. Notably, HIF-1α, which was overexpressed in both allogeneic CD4+ T cells and Tregs (Figure7B), is a potent transcriptional regulator involved in the control of glycolysis [44, 45]. Therefore, although glycolytic gene signatures were upregulated in activated CD4+ T cells and impaired Tregs in the allogeneic group, the metabolic transcriptome profiles of other T cells differed.
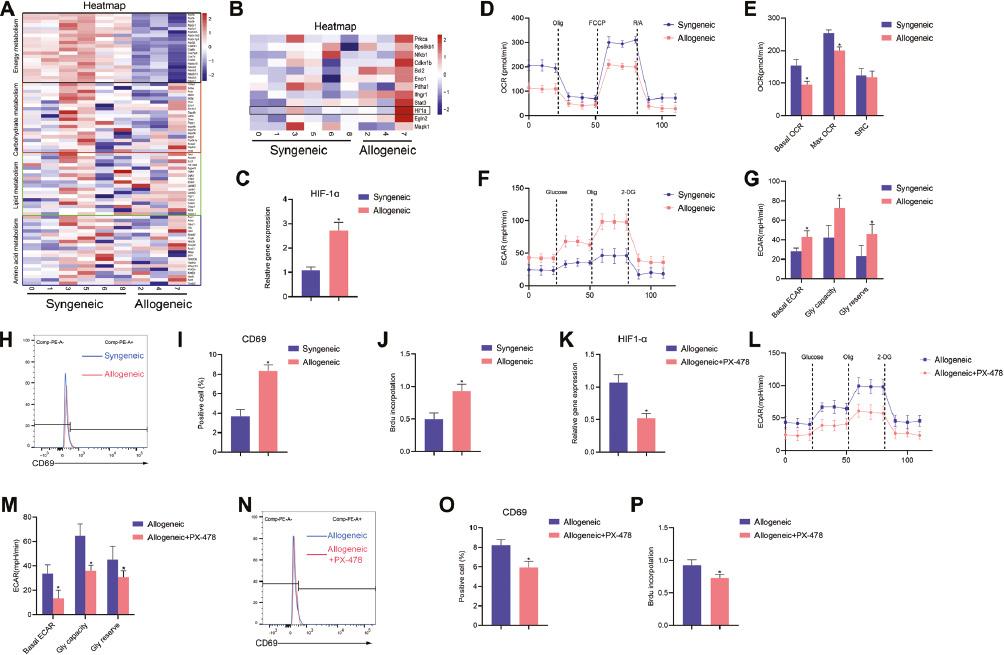
Metabolic Heterogeneity and Global Metabolic Reprogramming in the Transplant Microenvironment.
A. Heatmap of the gene expression levels of the major metabolic pathways of T cells in allogeneic and syngeneic subpopulations. Genes were grouped according to metabolic pathways through KEGG analysis. Cells in clusters 0/1/3/5/6/8 were from isografts, and those from clusters 2/4/7 were from allografts. B. Heatmap of gene expression levels of the indicated genes associated with the HIF-1α signaling pathway. C. Relative level of HIF-1α, determined by qRT-PCR in the isogeneic and allogeneic groups. D-E. The extracellular acidification rate (ECAR) of CD4+ T cells, measured at basal state and after the injection of glucose, oligomycin, and 2-DG at the indicated times. F-G. Oxygen consumption rate (OCR) measured at basal state and after the addition of oligomycin (olig), FCCP, and a mixture of rotenone and antimycin A (R/A) at the indicated times. H-I. CD69 expression on CD4+ T cells isolated from the isogeneic and allogeneic groups. Representative flow cytometry results are presented. J. Proliferation of CD4+ T cells, measured with the BrdU method after stimulation with anti-CD3/CD28 antibodies, compared between isogeneic grafts and allogeneic grafts. K-P. CD4+ T cells isolated from lymph nodes in isogeneic and allogeneic grafts treated with PX-478. (K) Relative level of HIF-1α, determined by qRT-PCR in the isogeneic and allogeneic groups. (L-M) Calculated ECAR levels in CD4+ T cells. (N-O) CD69 expression, on the basis of flow cytometry. (P) Proliferation of CD4+ T-cells, measured according to BrdU incorporation. Data are expressed as mean±SD; n=53 biological replicates; *P<0.05.
To verify these findings, we investigated the functional and metabolic reprogramming of CD4+ T cells isolated from LNs from mice subjected to syngeneic and allogeneic transplantation. As shown in Figure 7C, qRT-PCR analysis confirmed that HIF-1α was upregulated in CD4+ T cells in the allogeneic group, as compared with the syngeneic group. To target T cell metabolism, we used a Seahorse Extracellular Flux Analyzer to analyze glycolysis and OXPHOS by measuring the ECAR and OCR, respectively (Figure 7D-G). The allogeneic CD4+ T cells exhibited high levels of glycolysis, whereas the syngeneic CD4+ T cells exhibited low levels of glycolysis (Figure 7F and G). In contrast, the rate of OXPHOS in the allogeneic group was lower than that in the syngeneic group (Figure 7D and E). In addition, we detected the expression of CD69 and found that it increased in allogeneic CD4+ T cells, which represented activated T cells (Figure 7H and I). Furthermore, T cell proliferation in the allogeneic group was higher than that in the syngeneic group, as assessed by BrdU incorporation (Figure 7J). These results confirmed the higher level of glycolysis and activation of CD4+ T cells in the allogeneic group than the syngeneic group. To further investigate whether the functional and metabolic reprogramming of CD4+ T cells might be regulated by HIF-1α, we treated syngeneic and allogeneic grafts with PX-478, an inhibitor of HIF-1α. As shown in Figure 7K, the expression of HIF-1α was inhibited by PX-478. In addition, the CD4+ T cells in the allogeneic group treated with PX-478 exhibited altered ECARs (Figure 7L and M), downregulation of CD69 gene expression (Figure 7N and O), and diminished proliferation (Figure 7P).
Overall, we characterized the metabolic heterogeneity of different T cells from mice subjected to syngeneic and allogeneic cardiac transplantation at the single-cell level, and revealed how T cells reprogram their metabolic transcriptome signatures during transplantation-associated immune responses. In addition, we identified HIF-1α as an important regulator of the functional and metabolic reprogramming of allogeneic CD4+ T cells.
Discussion
ScRNA-seq is increasingly being used to define cell types, investigate developmental stages or biologically meaningful cellular heterogeneity, and explore potential target genes associated with immune system process [46–49]. The advent of scRNA-seq technologies has enabled expression profiling of individual cells. Exploration of immune cells, including T cells, at single-cell resolution can demonstrate the variations within and between distinct cell populations. After organ transplantation, a complex immunoregulatory network is activated that involves mutual recognition and regulation between donor and recipient immune cells. Existing immunosuppressants often induce severe adverse effects that prevent long-term graft survival [50, 51]. Each cell in the transplanted tissue is likely to have a different transcriptional status and a different function; however, the alloimmune mechanism associated with cardiac transplantation at the single-cell resolution has not been reported. Herein, we used scRNA-seq to create an immune map and elucidate the gene transcription profiles of immune cells after cardiac transplantation. The central findings of this study are that the transcriptional profiles of immune cells in LNs are profoundly altered under allograft rejection conditions. Single-cell analysis of immune cells in LNs enables elucidation of detailed information about these cells in the highly complex transplantation microenvironment.
After transplantation, T cells with varying differentiation outcomes and functions play important roles in mediating transplant rejection or acceptance, and accurate assessment of T cell composition is critical for ascertaining the respective roles of T cells during transplantation-associated immune processes [2, 52, 53]. We identified cytotoxic CD8+ T and activated CD4+ T cells in our allogeneic cardiac transplantation model, in agreement with these findings. In addition, Tregs were dysfunctional in the allogeneic transplantation microenvironment. Moreover, in-depth analysis of T cells in LNs revealed that the inflammatory signature and terms associated with the innate immune response and leukocyte migration were commonly altered in T cells after transplantation. The increased proinflammatory state of T cells observed in the present study is reminiscent of the findings from other clinical studies on patients with transplanted organs. These results suggest that activation of effector T cells and dysfunction of Tregs aggravate acute allograft rejection. Furthermore, Th17-like Tregs have been demonstrated to express both Treg and Th17 cell transcription factors [54]. Interestingly, we identified a unique subpopulation of Th17-like Tregs that exists during the Treg developmental program. On the basis of the unsupervised pseudotime analysis results and transcriptional similarity, we speculate that the Th17 cells generated after allogeneic cardiac transplantation might be differentiated from Tregs. Recent studies have suggested that Th17 cells play an indispensable role in acute allograft rejection. For example, one study has suggested that IL-17 increases early allograft-associated inflammatory responses and leads to severe Th17-driven allograft rejection responses in murine cardiac transplant models [55, 56]. Notably, to our knowledge, this is the first study to observe Th17-like Tregs in LNs after cardiac transplantation at the single-cell level.
To further explore the differentiation mechanism of T cell subsets, we identified key transcription factors that regulate differentiation between Treg and Th17 cells. JunB, a member of the AP-1 family of transcription factors, plays an important role in Th17 cell differentiation at distinct stages of inflammation. This transcription factor is necessary during the initiation and induction of the Th17 cell effector program and suppresses the potential of Th1 cells and Tregs37. However, the functions of JunB in the differentiation of T cell subsets after allograft transplantation have not been studied. Our findings support JunB as a critical regulator of Treg transdifferentiation into Th17 cells in the context of cardiac transplantation. The transcriptome data and subsequent in vitro data can serve as rich resources for deeper investigation of transplantation-induced lymphocytes in general. Targeted modulation of JunB to attenuate conversion from Tregs to Th17 cells might also promote transdifferentiation of Tregs into anti-inflammatory regulatory cells for transplantation therapeutic intervention.
In the past several years, evidence has emerged indicating that interfering with the metabolic reprogramming pathways of T cells can influence their differentiation and effector function [38, 39, 57]. Consequently, we characterized the rewiring of T cell metabolic transcription in the allograft microenvironment at single-cell resolution. These cells display extensive metabolic heterogeneity and high metabolic plasticity, thus allowing their metabolism to adapt to acute allograft microenvironmental contexts. The metabolic programs used by each T cell subtype appear to have different characteristics that are important for sustaining their proliferative ability and effector function [57–60]. We found that, compared with those from syngeneic grafts, T cells from allografts expressed relatively low levels of metabolism-associated molecules but showed high expression of members of signaling pathways associated with glycolysis, such as the HIF-1a signaling pathway. HIF-1a increases glucose uptake and diverts glucose away from OXPHOS toward aerobic glycolysis [61]. Subsequent in vitro experiments confirmed that the T cells from allografts existed in a high-glycolysis state, and that HIF-1a reprograms the function and metabolism of allograft CD4+ T cells. However, the differences between the metabolic gene profiles and the in vitro experimental results indicated that the transcription levels of metabolic genes are not equivalent to metabolic fluxes or metabolite abundance, because gene expression involves not only transcription but also protein translation and modification.
In summary, this article reports the first scRNA-seq dataset of immune cells from LNs from mice after cardiac transplantation. We revealed the extensive heterogeneity and distinctive functional composition of T cells associated with transplantation-associated immune processes. This study also provides the first report of the developmental trajectories of T cell subpopulations in LNs under transplantation-associated immune conditions. Second, we found preferential enrichment of cytotoxic CD8+ T cells, activated CD4+ T cells, and dysfunctional Tregs in the allograft microenvironment. We identified a key transcription factor, JunB, mediating the differentiation of Tregs into Th17 cells. We further demonstrated that T cells display metabolic transcriptome heterogeneity during transplantation immunity. Finally, we identified another important transcription factor, HIF-1a, involved in the metabolism and function of T cells. In brief, we present a comprehensive immune map and observable metabolic features of T cells in LNs from allografts at single-cell resolution. In addition, we provide a theoretical basis for the development of novel therapeutic targets for allograft rejection.
Limitations
Our study has several limitations that should be acknowledged. Because only early single-cell sequencing technology was available at the time of our study, we were unable to perform batch correction during sequencing; consequently, batch effects might have been introduced and confounded our analysis. Additionally, the number of cells identified in the allogeneic group was relatively limited, thus potentially limiting our ability to identify infrequent cell types or subpopulations that might substantially influence the rejection process. Furthermore, our analysis was limited to lymph node cells, but other cell types in the heart or peripheral tissues might possibly contribute to the rejection response. Despite these limitations, our study provides valuable insights into the cellular and molecular mechanisms of cardiac allograft rejection and highlights potential therapeutic targets for future investigation.

