
Introduction
Cardiac surgery-associated acute kidney injury (CSA-AKI) is a complication after cardiac surgery that is associated with increased morbidity and mortality, hospital stays and health care costs [1, 2]. A meta-analysis investigating the global incidence and prognosis of CSA-AKI over the period from 2004 to 2014 has indicated that the incidence of all stages of AKI is approximately 22%, and the combined short-term and long-term mortality rates are 10.7% and 30%, respectively [3, 4]. The two main types of surgical treatment for coronary artery disease are coronary artery bypass grafting with extracorporeal circulation and nonexternal circulation coronary artery bypass grafting (on-pump and off-pump CABG). Previously, off-pump CABG was believed to avoid the second strike of extracorporeal circulation in high-risk patients, and to decrease perioperative complication rates and mortality [5].
However, in recent years, several large randomised controlled studies have concluded that off-pump CABG has no significant advantage over on-pump CABG in terms of perioperative complications and mortality [6]. The pathophysiological mechanisms underlying CSA-AKI are not fully understood and may involve a variety of factors that act in different ways, and to different degrees, in different patients. The development of CSA-AKI may involve several major pathways of injury, including underperfusion, ischaemia-reperfusion injury, neurohumoural activation, inflammation, oxidative stress, nephrotoxins and mechanical factors [7, 8]. The main risk assessment systems currently available for cardiac surgery are the Chinese Cardiac Surgical Risk Evaluation System (SinoSCORE), the new European Cardiac Surgical Risk Evaluation System (EuroSCORE II) and the Society of Thoracic Surgeons Adult Cardiac Surgery Risk Calculator (STSscore) [9]. However, a targeted off-pump CABG perioperative risk predictive model is lacking. Accurate prediction of patients at risk of CSA-AKI would facilitate interventions to prevent or minimise the consequences of CSA-AKI [10].
Machine learning has been applied to medical fields such as outcome prediction, diagnosis, medical image interpretation and treatment [11, 12]. Machine learning techniques do not require assumptions regarding input variables and their relationships with outputs. Moreover, models built by machine learning methods enable early dynamic monitoring based on all available patient datasets, thus saving clinicians time [13]. Fan’s team has collected data on approximately 600 cardiac surgery patients and successfully built a CSA-AKI risk predictive model with a machine learning approach [14]. Therefore, in this study, we applied machine learning methods to develop a more targeted off-pump CABG perioperative risk predictive model that accurately predicts CSA-AKI. Preoperative variables and intraoperative time series physiological data were used to optimise the predictive model. With the high computing power of today’s computers and a variety of novel algorithms, machine learning can learn and analyse big medical data to discover potential connections within data, thereby increasing models’ predictive and generalisation capabilities [15].
Methods
Study Population
In this retrospective cohort study, we analysed 477 patients who underwent off-pump CABG in the Department of Cardiac Surgery at the First Affiliated Hospital of Guangxi Medical University (No. 6 Shuangcang Road, Nanning, Guangxi Zhuang Autonomous Region, China) between 2012 and 2021. The exclusion criteria were as follows: 1. other concomitant surgical procedures, such as surgery combining valve and coronary artery bypass; 2. death within 48 hours after surgery; 3. emergency surgery; and 4. preoperative renal replacement therapy and renal transplantation.
Data Collection
We collected data on demographic characteristics, clinical status, preoperative biochemistry, preoperative medications, intraoperative blood product transfusions, intraoperative medication use, and postoperative biochemistry, such as weight, blood cell infusion, total adrenaline, pre-WBC, emergency postoperative-HCT and 1 day postoperative-MONO%.
Definition of Cardiac Surgery–Associated Acute Kidney Injury
The development of postoperative AKI was defined according to the KDIGO criteria during the first 7 days after surgery. Postoperative AKI was defined by an elevation of at least 50% within 7 days, or 0.3 mg/dL within 48 hours, with respect to the reference serum creatinine level, with the preoperative serum creatinine level as the reference value [16].
Data Preprocessing
The following data preprocessing protocol was performed before data analysis: 1) data cleaning to identify missing values, outliers and duplicates, with missing values interpolated with the mean value, and 2) feature selection and extraction, in which the features (feature selection) or combinations of features (feature extraction) that were most useful/relevant for predictive model building were identified in the dataset.
Model Construction and Validation
The dataset was constructed from 477 patients and 293 variables. A total of 70% of the data was used for training, and 30% was used for validation. All analyses were developed in Python (version 3.5). The following machine learning methods were used to develop predictive models: logistic regression, simple decision trees, random forests, support vector machines, extreme gradient boosting and gradient boosted decision trees (GBDT). To evaluate the prediction and accuracy of the various machine learning models, we calculated and compared the area under the ROC curve enclosed by the coordinate axes (AUC). We used the Shapley additive expansion (SHAP) values for each predictive model [17] in each feature to provide consistent and locally accurate imputation values. This unified approach can be used for explaining the outcome of any machine learning model.
Results
Patients’ demographic data and perioperative variables are listed in Table 1 (with abbreviations explained in the Table footnotes). Among 477 admitted patients, 88 had a CSA-AKI event within 7 days postoperatively (18.45%) cases. The following variables were more common in the CSA-AKI group than the non-AKI group: higher post-operative transfusion of red blood cells or plasma, longer duration of ventilator use and higher levosimendan dosage.
General Patient Characteristics and Perioperative Variables.a
| Variables | Non-AKI | AKI | z/χ2 | P |
|---|---|---|---|---|
| Sex (n, %) | 320 (83.551) | 73 (82.955) | 0.02 | 0.892 |
| Diabetes (n, %) | 281 (73.368) | 68 (77.273) | 0.57 | 0.451 |
| Hypertension (n, %) | 165 (43.081) | 30 (34.091) | 2.38 | 0.123 |
| Smoking history (n, %) | 198 (51.832) | 49 (55.682) | 0.43 | 0.514 |
| History of alcohol consumption (n, %) | 277 (72.324) | 59 (67.045) | 0.98 | 0.323 |
| Postoperative atrial fibrillation (n, %) | 375 (97.911) | 81 (92.045) | 7.99 | 0.005** |
| CRRT (n, %) | 379 (98.956) | 76 (86.364) | 34.58 | 0.000*** |
| Secondary surgery (n, %) | 373 (97.389) | 83 (94.318) | 2.19 | 0.139 |
| Age (years, Md [IQR]) | 61.000 (55.000, 66.000) | 63.000 (57.250, 67.000) | −2.12 | 0.034* |
| Height (cm, Md [IQR]) | 165.000 (160.000, 170.000) | 163.000 (158.000, 169.000) | −1.55 | 0.120 |
| Weight (kg, Md [IQR]) | 64.000 (57.000, 72.000) | 63.000 (55.000, 69.750) | −1.38 | 0.169 |
| Intraoperative red blood cell infusion (U, Md [IQR]) | 4.000 (3.000, 6.000) | 4.000 (3.000, 6.000) | −0.41 | 0.682 |
| Intraoperative plasma transfusion (mL, Md [IQR]) | 400.000 (190.000, 600.000) | 400.000 (262.500, 600.000) | −0.90 | 0.370 |
| Postoperative plasma transfusion (mL, Md [IQR]) | 400.000 (0.000, 700.000) | 600.000 (200.000, 1050.000) | −3.63 | 0.000*** |
| Ventilator use time (h, Md [IQR]) | 23.488 (19.830, 32.500) | 26.580 (20.270, 73.348) | −2.57 | 0.010* |
| Total dopamine (mg, Md [IQR]) | 1100.000 (660.000, 1680.000) | 1090.000 (490.000, 2260.000) | −0.90 | 0.368 |
| Total adrenaline (mg, Md [IQR]) | 1.000 (0.250, 3.000) | 1.000 (0.250, 3.000) | −1.61 | 0.108 |
| Total norepinephrine (mg, Md [IQR]) | 2.000 (0.000, 4.000) | 4.000 (2.000, 15.075) | −5.26 | 0.000*** |
| Time of IABP (h, Md [IQR]) | 0.000 (0.000, 29.000) | 33.500(0.000, 72.000) | −4.72 | 0.000*** |
| Pre-WBC (L−1, ×109, Md [IQR]) | 6.740 (5.730, 7.880) | 6.760 (5.635, 8.287) | −0.40 | 0.693 |
| Pre-RBC (L−1, ×109, Md [IQR]) | 4.460 (4.060, 4.800) | 4.290 (4.022, 4.625) | −2.13 | 0.033* |
| Pre-HG (g·L−1, Md [IQR]) | 131.400 (119.400, 139.800) | 130.300 (116.100, 137.750) | −1.21 | 0.225 |
| Pre-PLT (L−1, ×109, Md [IQR]) | 226.000 (183.100, 263.100) | 222.350 (182.675, 273.525) | −0.12 | 0.908 |
| Pre-N% (%, Md [IQR]) | 0.579 (0.522, 0.645) | 0.643 (0.544, 0.700) | −3.71 | 0.000*** |
| Pre-L% (%, Md [IQR]) | 0.293 (0.238, 0.344) | 0.246 (0.196, 0.329) | −2.47 | 0.013* |
| Pre-MONO% (%, Md [IQR]) | 0.086 (0.072, 0.105) | 0.086 (0.072, 0.100) | −0.58 | 0.561 |
| Pre-EO% (%, Md [IQR]) | 0.038 (0.023, 0.062) | 0.034 (0.021, 0.071) | −0.32 | 0.752 |
| Pre-BASO% (%, Md [IQR]) | 0.005 (0.004, 0.007) | 0.005 (0.004, 0.008) | −0.01 | 0.990 |
| Pre-N (L−1, ×109, Md [IQR]) | 3.830 (3.060, 4.900) | 4.065 (3.163, 5.045) | −0.89 | 0.373 |
| Pre-L (L−1, ×109, Md [IQR]) | 1.950 (1.550, 2.370) | 1.600 (1.130, 2.165) | −3.81 | 0.000*** |
| Pre-MONO (L−1, ×109, Md [IQR]) | 0.570 (0.460, 0.710) | 0.530 (0.460, 0.700) | −1.07 | 0.285 |
| Pre-EOS (L−1, ×109, Md [IQR]) | 0.240 (0.140, 0.400) | 0.210 (0.103, 0.367) | −1.74 | 0.081 |
| Pre-BASO (L−1, ×109, Md [IQR]) | 0.040 (0.020, 0.050) | 0.030 (0.020, 0.050) | −1.91 | 0.056 |
| Pre-MCV (fL, Md [IQR]) | 89.610 (86.030, 92.730) | 90.495 (85.472, 93.450) | −0.89 | 0.373 |
| Pre-MCHpg, Md [IQR]) | 29.790 (28.400, 30.850) | 29.770 (28.157, 31.098) | −0.52 | 0.604 |
| Pre-MCHC (g·L−1, Md [IQR]) | 330.000 (322.800, 336.300) | 329.100 (324.200, 333.950) | −0.82 | 0.413 |
| Pre-HCT (L·L−1, Md [IQR]) | 0.393 (0.351, 0.419) | 0.381 (0.328, 0.416) | −1.25 | 0.212 |
| Pre-RDWCV (%, Md [IQR]) | 0.140 (0.130, 0.150) | 0.140 (0.130, 0.150) | −0.30 | 0.762 |
| Pre-PDW (fL, Md [IQR]) | 0.160 (0.160, 0.170) | 0.160 (0.160, 0.170) | −0.90 | 0.368 |
| Pre-PCT (%, Md [IQR]) | 0.190 (0.160, 0.220) | 0.180 (0.161, 0.220) | −0.21 | 0.835 |
| Pre-MPV (fL, Md [IQR]) | 8.500 (7.700, 9.160) | 8.420 (7.500, 9.398) | −0.46 | 0.649 |
| Pre-TBiL (umol·L−1, Md [IQR]) | 9.100 (6.600, 12.300) | 8.750 (6.800, 12.900) | −0.18 | 0.856 |
| Pre-Dbil (umol·L−1, Md [IQR]) | 2.900 (2.100, 3.800) | 2.800 (2.125, 3.700) | −0.30 | 0.763 |
| Pre-Ibil (umol·L−1, Md [IQR]) | 6.200 (4.300, 8.600) | 6.050 (4.500, 9.200) | −0.47 | 0.636 |
| Pre-DB/TB (%, Md [IQR]) | 0.300 (0.300, 0.400) | 0.300 (0.300, 0.400) | −1.09 | 0.275 |
| Pre-TP (g·L−1, Md [IQR]) | 66.700 (62.900, 70.400) | 65.200 (61.025, 69.450) | −2.28 | 0.022* |
| Pre-ALB (g·L−1, Md [IQR]) | 39.700 (37.200, 41.900) | 39.400 (36.250, 41.525) | −1.36 | 0.174 |
| Pre-GLO (g·L−1, Md [IQR]) | 26.800 (24.300, 30.300) | 26.600 (24.150, 29.150) | −0.63 | 0.530 |
| Pre-A/G (%, Md [IQR]) | 1.500 (1.300, 1.700) | 1.400 (1.300, 1.700) | −0.38 | 0.702 |
| Pre-GGT (U·L−1, Md [IQR]) | 35.000 (24.000, 56.000) | 32.500 (22.000, 41.000) | −1.42 | 0.155 |
| Pre-TBA (umol·L−1, Md [IQR]) | 4.600 (2.900, 7.600) | 4.700 (2.500, 8.525) | −0.31 | 0.759 |
| Pre-AST (U·L−1, Md [IQR]) | 23.000 (19.000, 30.000) | 25.500 (20.000, 33.750) | −1.63 | 0.102 |
| Pre-ALT (U·L−1, Md [IQR]) | 24.000 (17.000, 37.000) | 24.000 (16.250, 36.750) | −0.31 | 0.757 |
| Pre-AST/ALT (Md [IQR]) | 0.900 (0.700, 1.200) | 1.000 (0.725, 1.400) | −1.31 | 0.192 |
| Pre-ALP (U·L−1, Md [IQR]) | 75.000 (60.000, 92.000) | 72.500 (62.250, 92.000) | −0.74 | 0.462 |
| Pre-PA (mg·L−1, Md [IQR]) | 248.400 (214.800, 283.400) | 221.300 (190.475, 274.350) | −2.94 | 0.003** |
| Pre-CHE (U·L−1, Md [IQR]) | 8074.000 (7128.000, 9114.000) | 7704.500 (6282.750, 8657.250) | −2.48 | 0.013* |
| Pre-CREA (umol·L−1, Md [IQR]) | 87.000 (76.000, 103.000) | 87.500 (69.000, 104.000) | −0.73 | 0.467 |
| Pre-T*CHO (mmol·L−1, Md [IQR]) | 4.130 (3.310, 4.940) | 4.360 (3.792, 5.105) | −1.54 | 0.125 |
| Pre-TG (mmol·L−1, Md [IQR]) | 1.300 (0.950, 1.960) | 1.305 (0.925, 1.780) | −0.42 | 0.676 |
| Pre-HDL*C (mmol·L−1, Md [IQR]) | 0.990 (0.790, 1.220) | 1.000 (0.742, 1.198) | −0.41 | 0.679 |
| Pre-LDL*C (mmol·L−1, Md [IQR]) | 2.370 (1.740, 2.990) | 2.755 (2.032, 3.213) | −2.36 | 0.018* |
| Pre-GLU (mmol·L−1, Md [IQR]) | 4.640 (3.830, 5.290) | 4.770 (4.150, 5.338) | −0.80 | 0.425 |
| Pre-K (mmol·L−1, Md [IQR]) | 4.050 (3.790, 4.320) | 4.015 (3.790, 4.268) | −0.45 | 0.654 |
| Pre-Na (mmol·L−1, Md [IQR]) | 140.300 (138.500, 141.800) | 139.750 (138.300, 141.500) | −0.98 | 0.325 |
| Pre-CL (mmol·L−1, Md [IQR]) | 104.500 (102.100, 106.400) | 105.050 (102.300, 107.000) | −1.23 | 0.219 |
| Pre-Ca (mmol·L−1, Md [IQR]) | 2.259 (2.177, 2.320) | 2.268 (2.174, 2.330) | −0.80 | 0.426 |
| Pre-Mg (mmol·L−1, Md [IQR]) | 0.880 (0.810, 0.940) | 0.880 (0.820, 0.927) | −0.08 | 0.937 |
| Pre-P (mmol·L−1, Md [IQR]) | 0.000 (0.000, 1.070) | 0.885 (0.000, 1.098) | −1.42 | 0.157 |
| Pre-CK (U·L−1, Md [IQR]) | 76.000 (56.000, 104.000) | 83.000 (58.500, 115.250) | −1.28 | 0.200 |
| Pre-CK*MB (U·L−1, Md [IQR]) | 14.000 (11.000, 17.000) | 13.000 (10.000, 17.750) | −1.12 | 0.263 |
| Pre-LD (U·L−1, Md [IQR]) | 185.000 (159.000, 219.000) | 190.000 (163.250, 212.750) | −0.84 | 0.400 |
| Pre-LD1 (U·L−1, Md [IQR]) | 47.000 (36.000, 57.000) | 47.000 (35.250, 61.000) | −0.68 | 0.494 |
| Pre-HBD (U·L−1, Md [IQR]) | 130.000 (114.000, 150.000) | 138.500 (119.000, 157.000) | −1.82 | 0.069 |
| Pre-CK*MB/CK (%, Md [IQR]) | 0.180 (0.120, 0.250) | 0.175 (0.100, 0.270) | −0.77 | 0.439 |
| Pre-PT (s, Md [IQR]) | 10.900 (10.400, 11.600) | 11.000 (10.500, 11.775) | −1.62 | 0.104 |
| Pre-INR (%, Md [IQR]) | 0.920 (0.880, 0.980) | 0.930 (0.890, 0.980) | −0.97 | 0.335 |
| Pre-PTA (%, Md [IQR]) | 91.000 (2.780, 109.000) | 78.500 (3.712, 108.000) | −0.44 | 0.661 |
| Pre-FIB (g·L−1, Md [IQR]) | 4.110 (3.440, 5.120) | 4.310 (3.542, 7.688) | −1.02 | 0.309 |
| Pre-APTT (s, Md [IQR]) | 32.300 (27.700, 35.600) | 31.300 (13.400, 35.175) | −1.44 | 0.150 |
| Pre-TT (s, Md [IQR]) | 12.400 (11.600, 13.900) | 13.050 (12.100, 96.500) | −2.75 | 0.006** |
| Pre-Urine Specific gravity (%, Md [IQR]) | 1.020 (1.015, 1.025) | 1.020 (1.015, 4.008) | −0.40 | 0.691 |
| Pre-Urine PH(Md [IQR]) | 5.500 (5.000, 6.000) | 5.500 (1.020, 6.500) | −0.33 | 0.744 |
| Pre-TnI (u·L−1, Md [IQR]) | 0.010 (0.002, 0.028) | 0.010 (0.003, 0.034) | −0.48 | 0.631 |
| Pre-T3 (nmol·L−1, Md [IQR]) | 1.620 (1.100, 1.900) | 1.620 (1.065, 1.938) | −0.13 | 0.894 |
| Pre-T4 (nmol·L−1, Md [IQR]) | 98.980 (70.130, 121.160) | 91.665 (74.363, 109.780) | −1.61 | 0.107 |
| Pre-FT3 (pmol·L−1, Md [IQR]) | 4.270 (3.530, 4.790) | 4.260 (3.700, 4.643) | −0.27 | 0.791 |
| Pre-FT4 (mIU·L−1, Md [IQR]) | 10.190 (7.600, 12.050) | 10.010 (7.867, 11.787) | −0.17 | 0.863 |
| Pre-TSH (pmol·L−1, Md [IQR]) | 1.530 (0.470, 2.650) | 1.780 (0.715, 2.410) | −0.58 | 0.565 |
| Emergency postoperative-WBC (L−1, ×109, Md [IQR]) | 13.910 (11.050, 16.600) | 13.265 (11.140, 16.047) | −0.77 | 0.439 |
| Emergency postoperative-RBC (L−1, ×109, Md [IQR]) | 4.230 (3.720, 4.610) | 4.000 (3.627, 4.400) | −1.77 | 0.077 |
| Emergency postoperative-HG (g·L−1, Md [IQR]) | 122.800 (108.800, 132.300) | 118.500 (106.900, 128.800) | −1.39 | 0.166 |
| Emergency postoperative-PLT | 167.200 (128.300, 200.900) | 156.150 (94.733, 189.175) | −2.14 | 0.032* |
| Emergency postoperative-N% (%, Md [IQR]) | 0.873 (0.841, 0.905) | 0.867 (0.833, 0.895) | −1.23 | 0.219 |
| Emergency postoperative-L% (%, Md [IQR]) | 0.058 (0.042, 0.093) | 0.063 (0.047, 0.133) | −2.24 | 0.025* |
| Emergency postoperative-MONO% (%, Md [IQR]) | 0.064 (0.044, 0.083) | 0.063 (0.045, 0.089) | −0.84 | 0.399 |
| Emergency postoperative-N (L−1, ×109, Md [IQR]) | 11.710 (9.160, 14.170) | 11.010 (8.727, 13.273) | −1.99 | 0.047* |
| Emergency postoperative-L (L−1, ×109, Md [IQR]) | 0.790 (0.580, 1.140) | 0.905 (0.620, 1.475) | −2.30 | 0.021* |
| Emergency postoperative-MONO (L−1, ×109, Md [IQR]) | 0.820 (0.530, 1.160) | 0.790 (0.497, 1.008) | −1.10 | 0.273 |
| Emergency postoperative-BASO (L−1, ×109, Md [IQR]) | 0.010 (0.000, 0.010) | 0.010 (0.000, 0.030) | −1.38 | 0.167 |
| Emergency postoperative-MCV (fL, Md [IQR]) | 88.250 (85.000, 90.770) | 88.400 (82.425, 91.448) | −0.03 | 0.974 |
| Emergency postoperative-MCH (pg, Md [IQR]) | 29.370 (28.040, 30.400) | 29.000 (26.762, 30.635) | −0.84 | 0.401 |
| Emergency postoperative-MCHC (g·L−1, Md [IQR]) | 330.700 (324.300, 337.800) | 329.400 (318.925, 336.500) | −1.51 | 0.130 |
| Emergency postoperative-HCT (L·L−1, Md [IQR]) | 0.365 (0.320, 0.400) | 0.345 (0.300, 0.380) | −2.59 | 0.010** |
| Emergency postoperative-RDWCV (%, Md [IQR]) | 0.150 (0.140, 0.170) | 0.150 (0.140, 0.170) | −0.53 | 0.596 |
| Emergency postoperative-PDW (fL, Md [IQR]) | 0.160 (0.160, 0.170) | 0.170 (0.160, 0.170) | −1.90 | 0.058 |
| Emergency postoperative-PCT (%, Md [IQR]) | 0.150 (0.120, 0.180) | 0.140 (0.112, 0.178) | −0.85 | 0.396 |
| Emergency postoperative-MPV (fL, Md [IQR]) | 8.600 (7.970, 9.320) | 8.495 (7.603, 9.200) | −1.45 | 0.148 |
| Emergency postoperative-TBiL (umol·L−1, Md [IQR]) | 14.800 (10.900, 19.700) | 14.250 (9.500, 18.750) | −1.53 | 0.126 |
| Emergency postoperative-Dbil (umol·L−1, Md [IQR]) | 5.300 (3.900, 7.600) | 4.700 (3.100, 8.125) | −1.13 | 0.260 |
| Emergency postoperative-Ibil (umol·L−1, Md [IQR]) | 9.000 (6.800, 12.700) | 8.250 (5.500, 12.200) | −1.91 | 0.056 |
| Emergency postoperative-DB/TB (%, Md [IQR]) | 0.400 (0.300, 0.400) | 0.400 (0.300, 0.420) | −1.20 | 0.231 |
| Emergency postoperative-TP (g·L−1, Md [IQR]) | 59.800 (54.300, 65.200) | 58.400 (48.300, 63.950) | −1.52 | 0.128 |
| Emergency postoperative-ALB (g·L−1, Md [IQR]) | 36.900 (33.900, 40.300) | 36.500 (31.625, 38.875) | −2.38 | 0.017* |
| Emergency postoperative-GLO (g·L−1, Md [IQR]) | 22.500 (19.400, 25.800) | 21.550 (18.000, 26.250) | −0.91 | 0.363 |
| Emergency postoperative-A/G (%, Md [IQR]) | 1.600 (1.400, 1.800) | 1.600 (1.400, 1.800) | −0.86 | 0.390 |
| Emergency postoperative-GGT (U·L−1, Md [IQR]) | 32.000 (24.000, 50.000) | 32.000 (20.250, 45.000) | −0.94 | 0.345 |
| Emergency postoperative-TBA (umol·L−1, Md [IQR]) | 0.700 (0.400, 1.100) | 0.800 (0.425, 1.400) | −1.55 | 0.122 |
| Emergency postoperative-AST (U·L−1, Md [IQR]) | 32.000 (23.000, 47.000) | 32.500 (27.250, 40.750) | −0.64 | 0.523 |
| Emergency postoperative-ALT (U·L−1, Md [IQR]) | 31.000 (22.000, 46.000) | 30.000 (19.000, 43.000) | −1.16 | 0.246 |
| Emergency postoperative-AST/ALT (Md [IQR]) | 1.000 (0.800, 1.400) | 1.200 (0.900, 1.500) | −2.73 | 0.006** |
| Emergency postoperative-ALP (U·L−1, Md [IQR]) | 62.000 (49.000, 78.000) | 63.000 (47.250, 75.000) | −0.06 | 0.956 |
| Emergency postoperative-PA (mg·L−1, Md [IQR]) | 208.900 (177.700, 237.900) | 191.950 (154.050, 227.575) | −1.84 | 0.065 |
| Emergency postoperative-CHE (U·L−1, Md [IQR]) | 7062.000 (6115.000, 8045.000) | 6386.500 (5657.000, 7979.500) | −1.72 | 0.086 |
| Emergency postoperative-CREA (umol·L−1, Md [IQR]) | 85.000 (72.000, 103.000) | 106.000 (80.000, 142.000) | −4.84 | 0.000*** |
| Emergency postoperative-K (mmol·L−1, Md [IQR]) | 4.430 (4.140, 4.690) | 4.500 (4.070, 4.880) | −1.54 | 0.124 |
| Emergency postoperative-Na | 140.500 (138.400, 142.600) | 140.800 (138.525, 144.025) | −2.12 | 0.034* |
| Emergency postoperative-CL (mmol·L−1, Md [IQR]) | 104.400 (101.400, 107.300) | 105.300 (103.050, 107.800) | −2.16 | 0.031* |
| Emergency postoperative-Ca (mmol·L−1, Md [IQR]) | 2.150 (2.030, 2.245) | 2.160 (2.083, 2.238) | −0.97 | 0.331 |
| Emergency postoperative-Mg (mmol·L−1, Md [IQR]) | 1.090 (0.950, 1.250) | 1.195 (1.000, 1.460) | −3.38 | 0.001*** |
| Emergency postoperative-P (mmol·L−1, Md [IQR]) | 0.000 (0.000, 1.190) | 0.835 (0.000, 1.270) | −2.11 | 0.035* |
| Emergency postoperative-CK (U·L−1, Md [IQR]) | 212.000 (0.000, 404.000) | 209.500 (100.000, 358.750) | −0.40 | 0.693 |
| Emergency postoperative-CK*MB (U·L−1, Md [IQR]) | 16.000 (0.000, 24.000) | 18.000 (11.000, 24.000) | −1.86 | 0.062 |
| Emergency postoperative-LD (U·L−1, Md [IQR]) | 232.000 (0.000, 304.000) | 233.000 (185.000, 316.000) | −1.36 | 0.175 |
| Emergency postoperative-LD1 (U·L−1, Md [IQR]) | 44.000 (0.000, 63.000) | 52.000 (25.000, 78.000) | −2.50 | 0.012* |
| Emergency postoperative-HBD (U·L−1, Md [IQR]) | 152.000 (0.000, 202.000) | 161.000 (124.500, 214.750) | −1.60 | 0.109 |
| Emergency postoperative-CK*MB/CK (%, Md [IQR]) | 0.050 (0.000, 0.080) | 0.075 (0.030, 0.110) | −3.37 | 0.001*** |
| Emergency postoperative-RBP (mg/L, Md [IQR]) | 0.000 (0.000, 34.600) | 20.850 (0.000, 36.900) | −1.95 | 0.051 |
| Emergency postoperative-PT (s, Md [IQR]) | 11.900 (11.000, 12.800) | 12.000 (11.400, 13.500) | −1.89 | 0.059 |
| Emergency postoperative-INR (%, Md [IQR]) | 1.000 (0.930, 1.070) | 1.000 (0.962, 1.075) | −0.56 | 0.578 |
| Emergency postoperative-PTA (%, Md [IQR]) | 80.000 (2.250, 98.000) | 80.000 (4.183, 97.750) | −0.72 | 0.474 |
| Emergency postoperative-FIB (g·L−1, Md [IQR]) | 4.940 (3.990, 6.110) | 4.830 (3.025, 5.735) | −1.60 | 0.110 |
| Emergency postoperative-APTT (s, Md [IQR]) | 31.100 (16.600, 36.200) | 31.000 (12.900, 36.000) | −0.43 | 0.667 |
| Emergency postoperative-TT (s, Md [IQR]) | 12.000 (10.700, 15.000) | 13.200 (11.600, 73.250) | −2.88 | 0.004** |
| Postoperative serum troponin I (u·L−1, Md [IQR]) | 0.000 (0.000, 0.229) | 0.000 (0.000, 0.447) | −0.87 | 0.387 |
| 1 day postoperative-WBC (L−1, ×109, Md [IQR]) | 15.160 (11.990, 18.750) | 15.810 (13.050, 19.170) | −1.13 | 0.260 |
| 1 day postoperative-RBC (L−1, ×109, Md [IQR]) | 3.770 (3.280, 4.250) | 3.535 (3.107, 3.917) | −2.96 | 0.003** |
| 1 day postoperative-HG (g·L−1, Md [IQR]) | 109.000 (97.000, 122.100) | 103.450 (92.000, 115.650) | −2.39 | 0.017* |
| 1 day postoperative-PLT (L−1, ×109, Md [IQR]) | 149.200 (108.400, 187.300) | 133.400 (93.530, 175.800) | −1.74 | 0.081 |
| 1 day postoperative-N% (%, Md [IQR]) | 0.883 (0.855, 0.907) | 0.888(0.851, 0.919) | −1.35 | 0.177 |
| 1 day postoperative-L% (%, Md [IQR]) | 0.049 (0.035, 0.067) | 0.058(0.037, 0.077) | −2.62 | 0.009** |
| 1 day postoperative-MONO% (%, Md [IQR]) | 0.067 (0.050, 0.082) | 0.071 (0.051, 0.101) | −1.86 | 0.063 |
| 1 day postoperative-EO% (%, Md [IQR]) | 0.000 (0.000, 0.000) | 0.000 (0.000, 0.001) | −2.16 | 0.030* |
| 1 day postoperative-BASO% (%, Md [IQR]) | 0.000 (0.000, 0.001) | 0.001 (0.000, 0.001) | −1.88 | 0.061 |
| 1 day postoperative-N (L−1, ×109, Md [IQR]) | 13.100 (9.840, 16.640) | 12.570 (9.105, 16.670) | −0.45 | 0.657 |
| 1 day postoperative-L (L−1, ×109, Md [IQR]) | 0.710 (0.510, 0.960) | 0.790 (0.590, 1.070) | −2.29 | 0.022* |
| 1 day postoperative-MONO (L−1, ×109, Md [IQR]) | 0.960 (0.660, 1.270) | 1.005 (0.615, 1.360) | −0.30 | 0.767 |
| 1 day postoperative-EOS (L−1, ×109, Md [IQR]) | 0.000 (0.000, 0.010) | 0.000 (0.000, 0.010) | −2.61 | 0.009** |
| 1 day postoperative-BASO (L−1, ×109, Md [IQR]) | 0.000 (0.000, 0.010) | 0.010 (0.000, 0.018) | −2.03 | 0.042* |
| 1 day postoperative-MCV (fL, Md [IQR]) | 88.400 (84.590, 91.000) | 88.015 (84.710, 92.203) | −0.16 | 0.873 |
| 1 day postoperative-MCH (pg, Md [IQR]) | 29.480 (28.100, 30.430) | 29.460 (27.320, 30.565) | −0.21 | 0.837 |
| 1 day postoperative-MCHC (g·L−1, Md [IQR]) | 330.830 (323.600, 336.200) | 331.150 (322.375, 336.550) | −0.03 | 0.977 |
| 1 day postoperative-HCT (L·L−1, Md [IQR]) | 0.330 (0.285, 0.370) | 0.302 (0.249, 0.340) | −3.61 | 0.000*** |
| 1 day postoperative-RDWCV (%, Md [IQR]) | 0.150 (0.140, 0.170) | 0.150 (0.140, 0.170) | −1.14 | 0.256 |
| 1 day postoperative-PDW (fL, Md [IQR]) | 0.160 (0.160, 0.170) | 0.170 (0.160, 0.170) | −2.44 | 0.015* |
| 1 day postoperative-PCT (%, Md [IQR]) | 0.140 (0.110, 0.172) | 0.142 (0.107, 0.177) | −0.04 | 0.965 |
| 1 day postoperative-MPV (fL, Md [IQR]) | 8.900 (8.140, 9.580) | 8.830 (7.978, 9.800) | −0.23 | 0.819 |
| 1 day postoperative-TBiL (umol·L−1, Md [IQR]) | 11.100 (7.600, 16.100) | 12.800 (8.650, 16.675) | −1.36 | 0.173 |
| 1 day postoperative-Dbil (umol·L−1, Md [IQR]) | 4.400 (3.000, 6.300) | 5.100 (2.925, 7.600) | −1.84 | 0.065 |
| 1 day postoperative-Ibil (umol·L−1, Md [IQR]) | 4.400 (0.000, 8.300) | 4.900 (0.000, 7.975) | −0.14 | 0.891 |
| 1 day postoperative-DB/TB (%, Md [IQR]) | 0.300 (0.000, 0.400) | 0.000 (0.000, 0.400) | −0.80 | 0.425 |
| 1 day postoperative-TP (g·L−1, Md [IQR]) | 0.000 (0.000, 58.800) | 0.000 (0.000, 53.200) | −1.58 | 0.114 |
| 1 day postoperative-ALB (g·L−1, Md [IQR]) | 38.500 (35.100, 41.400) | 38.750 (35.825, 40.875) | −0.61 | 0.544 |
| 1 day postoperative-GLO (g·L−1, Md [IQR]) | 0.000 (0.000, 22.300) | 0.000 (0.000, 18.075) | −1.35 | 0.178 |
| 1 day postoperative-A/G (%, Md [IQR]) | 0.000 (0.000, 1.300) | 0.000 (0.000, 1.125) | −1.52 | 0.128 |
| 1 day postoperative-GGT (U·L−1, Md [IQR]) | 0.000 (0.000, 24.000) | 0.000 (0.000, 21.750) | −1.10 | 0.271 |
| 1 day postoperative-TBA (umol·L−1, Md [IQR]) | 0.000 (0.000, 0.700) | 0.000 (0.000, 0.525) | −1.25 | 0.211 |
| 1 day postoperative-AST (U·L−1, Md [IQR]) | 0.000 (0.000, 29.000) | 0.000 (0.000, 33.750) | −0.06 | 0.952 |
| 1 day postoperative-ALT (U·L−1, Md [IQR]) | 22.000 (0.000, 34.000) | 19.000 (0.000, 32.500) | −1.62 | 0.106 |
| 1 day postoperative-AST/ALT (Md [IQR]) | 0.000 (0.000, 0.900) | 0.000 (0.000, 0.675) | −1.04 | 0.296 |
| 1 day postoperative-ALP (U·L−1, Md [IQR]) | 0.000 (0.000, 51.000) | 0.000 (0.000, 37.750) | −1.31 | 0.192 |
| 1 day postoperative-PA (mg·L−1, Md [IQR]) | 0.000 (0.000, 149.700) | 0.000 (0.000, 141.000) | −1.35 | 0.178 |
| 1 day postoperative-CHE (U·L−1, Md [IQR]) | 0.000 (0.000, 5964.000) | 0.000 (0.000, 4474.000) | −1.86 | 0.064 |
| 1 day postoperative-CREA (umol·L−1, Md [IQR]) | 90.000 (72.000, 111.000) | 154.500 (113.000, 204.000) | −10.27 | 0.000*** |
| 1 day postoperative-K (mmol·L−1, Md [IQR]) | 4.460 (4.160, 4.710) | 4.640 (4.245, 4.908) | −3.44 | 0.001*** |
| 1 day postoperative-Na (mmol·L−1, Md [IQR]) | 139.700 (137.000, 142.500) | 140.300 (138.575, 144.275) | −2.23 | 0.026* |
| 1 day postoperative-CL | 102.600 (99.200, 105.100) | 101.700 (99.600, 105.525) | −0.42 | 0.673 |
| 1 day postoperative-Ca (mmol·L−1, Md [IQR]) | 2.197 (2.089, 2.292) | 2.240 (2.131, 2.359) | −2.86 | 0.004** |
| 1 day postoperative-Mg (mmol·L−1, Md [IQR]) | 1.110 (0.960, 1.280) | 1.250 (1.090, 1.417) | −4.81 | 0.000*** |
| 1 day postoperative-P (mmol·L−1, Md [IQR]) | 0.000 (0.000, 1.000) | 0.795 (0.000, 1.212) | −2.81 | 0.005** |
| 1 day postoperative-CK (mmol·L−1, Md [IQR]) | 262.000 (0.000, 624.000) | 342.000 (0.000, 922.750) | −2.13 | 0.033* |
| 1 day postoperative-CK*MB (U·L−1, Md [IQR]) | 13.000 (0.000, 22.000) | 15.000 (0.000, 25.000) | −1.79 | 0.074 |
| 1 day postoperative-LD (U·L−1, Md [IQR]) | 226.000 (0.000, 307.000) | 269.000 (0.000, 355.500) | −2.51 | 0.012* |
| 1 day postoperative-LD1 (U·L−1, Md [IQR]) | 43.000 (0.000, 72.000) | 54.000 (0.000, 83.250) | −1.50 | 0.133 |
| 1 day postoperative-HBD (U·L−1, Md [IQR]) | 151.000 (0.000, 211.000) | 182.000 (0.000, 251.250) | −2.58 | 0.010* |
| 1 day postoperative-CK*MB/CK (%, Md [IQR]) | 0.020 (0.000, 0.040) | 0.030 (0.000, 0.040) | −0.45 | 0.653 |
| 1 day postoperative-PT (s, Md [IQR]) | 11.000 (9.200, 11.800) | 11.250 (10.225, 12.650) | −2.72 | 0.007** |
| 1 day postoperative-INR (%, Md [IQR]) | 0.930 (0.810, 1.010) | 0.960 (0.903, 1.075) | −2.81 | 0.005** |
| 1 day postoperative-PTA (%, Md [IQR]) | 4.880 (0.000, 100.000) | 73.500 (4.610, 99.750) | −2.76 | 0.006** |
| 1 day postoperative-FIB (g·L−1, Md [IQR]) | 5.460 (0.000, 7.210) | 5.785 (3.590, 7.070) | −0.85 | 0.395 |
| 1 day postoperative-TT (s, Md [IQR]) | 0.000 (0.000, 12.600) | 9.550 (0.000, 43.000) | −1.19 | 0.235 |
| Predischarge WBC (L−1, ×109, Md [IQR]) | 11.580 (9.540, 13.430) | 11.335 (9.258, 14.240) | −0.28 | 0.782 |
| Predischarge RBC (L−1, ×109, Md [IQR]) | 3.700 (3.210, 4.250) | 3.270 (2.955, 3.790) | −4.20 | 0.000*** |
| Predischarge HG (g·L−1, Md [IQR]) | 107.000 (93.400, 121.500) | 95.150 (86.350, 109.925) | −4.11 | 0.000*** |
| Predischarge PLT (L−1, ×109, Md [IQR]) | 272.000 (204.200, 349.600) | 240.150 (136.525, 319.500) | −2.58 | 0.010** |
| Predischarge N% (%, Md [IQR]) | 0.733 (0.670, 0.786) | 0.758(0.696, 0.857) | −2.90 | 0.004** |
| Predischarge L% (%, Md [IQR]) | 0.159 (0.122, 0.214) | 0.149 (0.093, 0.207) | −1.02 | 0.309 |
| Predischarge MONO% (%, Md [IQR]) | 0.082 (0.064, 0.100) | 0.083 (0.062, 0.105) | −0.09 | 0.926 |
| Predischarge EO% (%, Md [IQR]) | 0.026 (0.012, 0.044) | 0.036 (0.012, 0.058) | −1.98 | 0.048* |
| Predischarge BASO% (%, Md [IQR]) | 0.003 (0.001, 0.004) | 0.003 (0.001, 0.005) | −0.07 | 0.947 |
| Predischarge N (L−1, ×109, Md [IQR]) | 8.000 (6.470, 10.070) | 7.455 (5.980, 11.020) | −0.32 | 0.749 |
| Predischarge L (L−1, ×109, Md [IQR]) | 1.700 (1.230, 2.250) | 1.550 (1.022, 2.100) | −2.13 | 0.033* |
| Predischarge MONO (L−1, ×109, Md [IQR]) | 0.900 (0.650, 1.100) | 0.795 (0.510, 1.008) | −2.26 | 0.024* |
| Predischarge EOS (L−1, ×109, Md [IQR]) | 0.280 (0.130, 0.460) | 0.340 (0.133, 0.607) | −1.87 | 0.062 |
| Predischarge BASO (L−1, ×109, Md [IQR]) | 0.030 (0.010, 0.050) | 0.030 (0.010, 0.050) | −0.41 | 0.679 |
| Predischarge MCV (fL, Md [IQR]) | 89.290 (85.780, 92.100) | 89.880 (85.175, 92.892) | −0.62 | 0.536 |
| Predischarge MCH (pg, Md [IQR]) | 29.400 (28.040, 30.280) | 29.400 (27.700, 30.590) | −0.28 | 0.783 |
| Predischarge MCHC (g·L−1, Md [IQR]) | 328.000 (322.000, 334.000) | 325.250 (316.225, 331.525) | −2.59 | 0.010** |
| Predischarge HCT (L·L−1, Md [IQR]) | 0.323 (0.279, 0.370) | 0.280 (0.250, 0.332) | −4.13 | 0.000*** |
| Predischarge RDWCV (%, Md [IQR]) | 0.150 (0.140, 0.170) | 0.160 (0.140, 0.190) | −3.45 | 0.001*** |
| Predischarge PDW (fL, Md [IQR]) | 0.170 (0.160, 0.170) | 0.170 (0.160, 0.180) | −3.60 | 0.000*** |
| Predischarge PCT (%, Md [IQR]) | 0.233 (0.184, 0.300) | 0.229 (0.175, 0.299) | −0.74 | 0.461 |
| Predischarge MPV (fL, Md [IQR]) | 8.260 (7.520, 9.090) | 8.275 (7.490, 9.085) | −0.09 | 0.931 |
| Predischarge TBiL (umol·L−1, Md [IQR]) | 11.900 (8.400, 17.300) | 13.400 (8.425, 17.625) | −0.76 | 0.446 |
| Predischarge Dbil (umol·L−1, Md [IQR]) | 4.000 (2.900, 6.000) | 4.550 (2.700, 7.100) | −0.79 | 0.432 |
| Predischarge Ibil (umol·L−1, Md [IQR]) | 8.000 (5.000, 10.900) | 8.450 (4.975, 10.575) | −0.67 | 0.500 |
| Predischarge DB/TB (%, Md [IQR]) | 0.300 (0.300, 0.400) | 0.340 (0.240, 0.400) | −0.13 | 0.899 |
| Predischarge TP(g·L−1, Md [IQR]) | 62.900 (58.100, 67.500) | 61.500 (52.575, 65.525) | −3.11 | 0.002** |
| Predischarge ALB | 36.300 (33.100, 39.500) | 35.250 (31.325, 38.600) | −1.43 | 0.152 |
| Predischarge GLO (g·L−1, Md [IQR]) | 26.000 (22.700, 29.900) | 23.800 (20.050, 27.375) | −3.25 | 0.001** |
| Predischarge A/G (%, Md [IQR]) | 1.300 (1.100, 1.500) | 1.300 (1.000, 1.600) | −0.25 | 0.806 |
| Predischarge GGT (U·L−1, Md [IQR]) | 52.000 (33.000, 118.000) | 41.000 (17.250, 93.000) | −2.72 | 0.007** |
| Predischarge TBA (umol·L−1, Md [IQR]) | 2.200 (1.300, 4.500) | 1.800 (0.900, 4.550) | −1.38 | 0.168 |
| Predischarge AST (U·L−1, Md [IQR]) | 28.000 (18.000, 38.000) | 26.000 (18.000, 42.000) | −0.15 | 0.883 |
| Predischarge ALT (U·L−1, Md [IQR]) | 31.000 (18.000, 55.000) | 25.000 (15.000, 62.000) | −0.80 | 0.427 |
| Predischarge AST/ALT (Md [IQR]) | 0.800 (0.500, 1.200) | 0.900 (0.400, 1.375) | −0.73 | 0.468 |
| Predischarge ALP (U·L−1, Md [IQR]) | 78.000 (58.000, 103.000) | 71.500 (47.750, 91.750) | −2.21 | 0.027* |
| Predischarge PA (mg·L−1, Md [IQR]) | 190.400 (148.200, 230.400) | 160.700 (123.575, 214.500) | −2.85 | 0.004** |
| Predischarge CHE (U·L−1, Md [IQR]) | 5979.000 (4957.000, 7050.000) | 5326.000 (3006.500, 6447.000) | −3.693 | 0.000*** |
| Predischarge UREA (umol·L−1, Md [IQR]) | 9.950 (6.680, 12.860) | 12.215 (8.770, 16.300) | −3.879 | 0.000*** |
| Predischarge CREA (umol·L−1, Md [IQR]) | 92.000 (71.000, 117.000) | 123.000 (91.000, 164.000) | −5.726 | 0.000*** |
| Predischarge UA (umol·L−1, Md [IQR]) | 308.000 (203.000, 392.000) | 282.500 (198.000, 424.250) | −0.015 | 0.988 |
| Predischarge HCO3 (umol·L−1, Md [IQR]) | 25.500 (22.200, 27.800) | 23.500 (20.200, 27.350) | −2.199 | 0.028* |
| Predischarge CCR | 60.000 (42.000, 78.000) | 46.200 (20.750, 64.750) | −3.806 | 0.000*** |
| Predischarge CysC (mg·L−1, Md [IQR]) | 1.116 (0.862, 1.403) | 1.263 (0.957, 1.726) | −2.514 | 0.012* |
| Predischarge K (mmol·L−1, Md [IQR]) | 4.340 (3.960, 4.630) | 4.440 (3.990, 4.982) | −2.575 | 0.010* |
| Predischarge Na (mmol·L−1, Md [IQR]) | 136.700 (134.000, 139.300) | 137.200 (134.700, 139.425) | −1.428 | 0.153 |
| Predischarge CL (mmol·L−1, Md [IQR]) | 99.500 (96.200, 102.800) | 100.900 (96.925, 103.275) | −1.438 | 0.150 |
| Predischarge Ca (mmol·L−1, Md [IQR]) | 2.178 (2.078, 2.260) | 2.183 (2.085, 2.363) | −1.387 | 0.166 |
| Predischarge Mg (mmol·L−1, Md [IQR]) | 0.920 (0.830, 1.050) | 0.980 (0.883, 1.182) | −3.147 | 0.002** |
| Predischarge P (mmol·L−1, Md [IQR]) | 0.000 (0.000, 1.020) | 0.875 (0.000, 1.152) | −2.728 | 0.006** |
| Predischarge RBP (mg/L, Md [IQR]) | 0.000 (0.000, 42.300) | 26.000 (0.000, 48.800) | −2.156 | 0.031* |
| Predischarge PT (s, Md [IQR]) | 11.200 (10.000, 12.200) | 12.000 (11.000, 14.225) | −4.219 | 0.000*** |
| Predischarge INR (%, Md [IQR]) | 0.940 (0.860, 1.030) | 0.980 (0.930, 1.140) | −4.121 | 0.000*** |
| Predischarge PTA (%, Md [IQR]) | 6.610 (0.000, 97.000) | 8.315 (0.000, 91.000) | −0.067 | 0.947 |
| Predischarge FIB (g·L−1, Md [IQR]) | 5.870 (3.780, 7.020) | 5.580 (3.735, 6.893) | −0.581 | 0.561 |
| Predischarge APTT (s, Md [IQR]) | 0.000 (0.000, 27.200) | 11.000 (0.000, 30.100) | −1.617 | 0.106 |
| Predischarge TT (s, Md [IQR]) | 9.700 (0.000, 12.500) | 11.500 (0.000, 14.300) | 1.993 | 0.046* |
*P<0.05, **P<0.01, ***P<0.001.
aAbbreviations: ALB, serum albumin; ALP, serum alkaline phosphatase; ALT, glutamic-pyruvic transaminase; APTT, activated partial thromboplastin time; AST, glutamic oxalacetic transaminase; BASO, basophil; BASO%, basophil percentage; CHE, cholinesterase; CK*MB, creatine kinase isoenzyme; CK, creatine phosphokinase; CREA, creatinine; CRRT, continuous renal replacement therapy; Dbil, direct bilirubin; EO%, percentage of eosinophils; EO, eosinophils; FIB, fibrinogen; GGT, gamma-glutamyl transpeptidase; GLO, globulin; GLU, glucose; HBD, hydroxybutyrate dehydrogenase; HCT, red blood cell specific volume; HDL*C, high density lipoprotein cholesterol; HG, haemoglobin; Ibil, indirect bilirubin; INR, international normalised ratio; L%, lymphocyte percentage; L, lymphocyte; LD, serum lactate dehydrogenase; LDL*C, low density lipoprotein cholesterol; MCH, mean corpuscular hemoglobin; MCHC, mean corpuscular hemoglobin concentration; MCV, mean corpuscular volume; MONO%, monocyte percentage; MONO, monocyte; MPV, mean platelet volume; N%, neutrophilic granulocyte percentage; N, neutrophilic granulocyte; PA, proserum protein; PCT, platelet specific volume; PDW, platelet distribution width; PLT, platelet; Pre, preoperative; PT, prothrombin time; PTA, prothrombin activity; RBC, red blood cell; RBP, vitamin A binding protein; RDWCV, coefficient of variation of erythrocyte width; T*CHO, total cholesterol; TBA, serum total bile acid; TBiL, total bilirubin; TG, triglyceride; TnI, troponin; TP, total protein; TT, thrombin time; WBC, white blood cell.
The predictive models’ AUC curves are shown in Figure 1. GBDT exhibited the largest AUC (0.87). The main risk factors for predicting CSA-AKI were analysed with SHAP values to assess the characteristics’ contributions to the GBDT model. Figure 2 illustrates the top ten features in the SHAP bar chart, according to the mean SHAP values, ranked from largest to smallest, and their mean magnitude of influence on the model output. The top ten variables that significantly influenced the model runs were 1-day postoperative K ion concentration, 1-day postoperative Mg ion concentration, 1-day postoperative CK, preoperative AST, total dopamine use, preoperative FT4, preoperative lymphocyte ratio, postoperative basophils, preoperative glucose and 1-day postoperative prothrombin activity, all of which were measured in serum. To identify the features with the greatest influence on the predictive model, we used a SHAP summary plot (Figure 3) and the top 20 features of the predictive model. This plot relates high and low feature values to SHAP values in the training dataset. According to the predictive model, the higher the SHAP value of a feature, the more likely AKI is to occur. The colours represent the feature values (The higher the SHAP value of a feature, the higher the probability of postoperative acute kidney injury development. Red represents high feature values, blue represents low feature values). The red direction on the right indicates that the feature has a positive influence on the model’s prediction results, and the blue has a negative influence.


Importance Matrix Diagram for the GBDT Model.
This importance matrix diagram depicts the importance of each covariate in the development of the final predictive model.
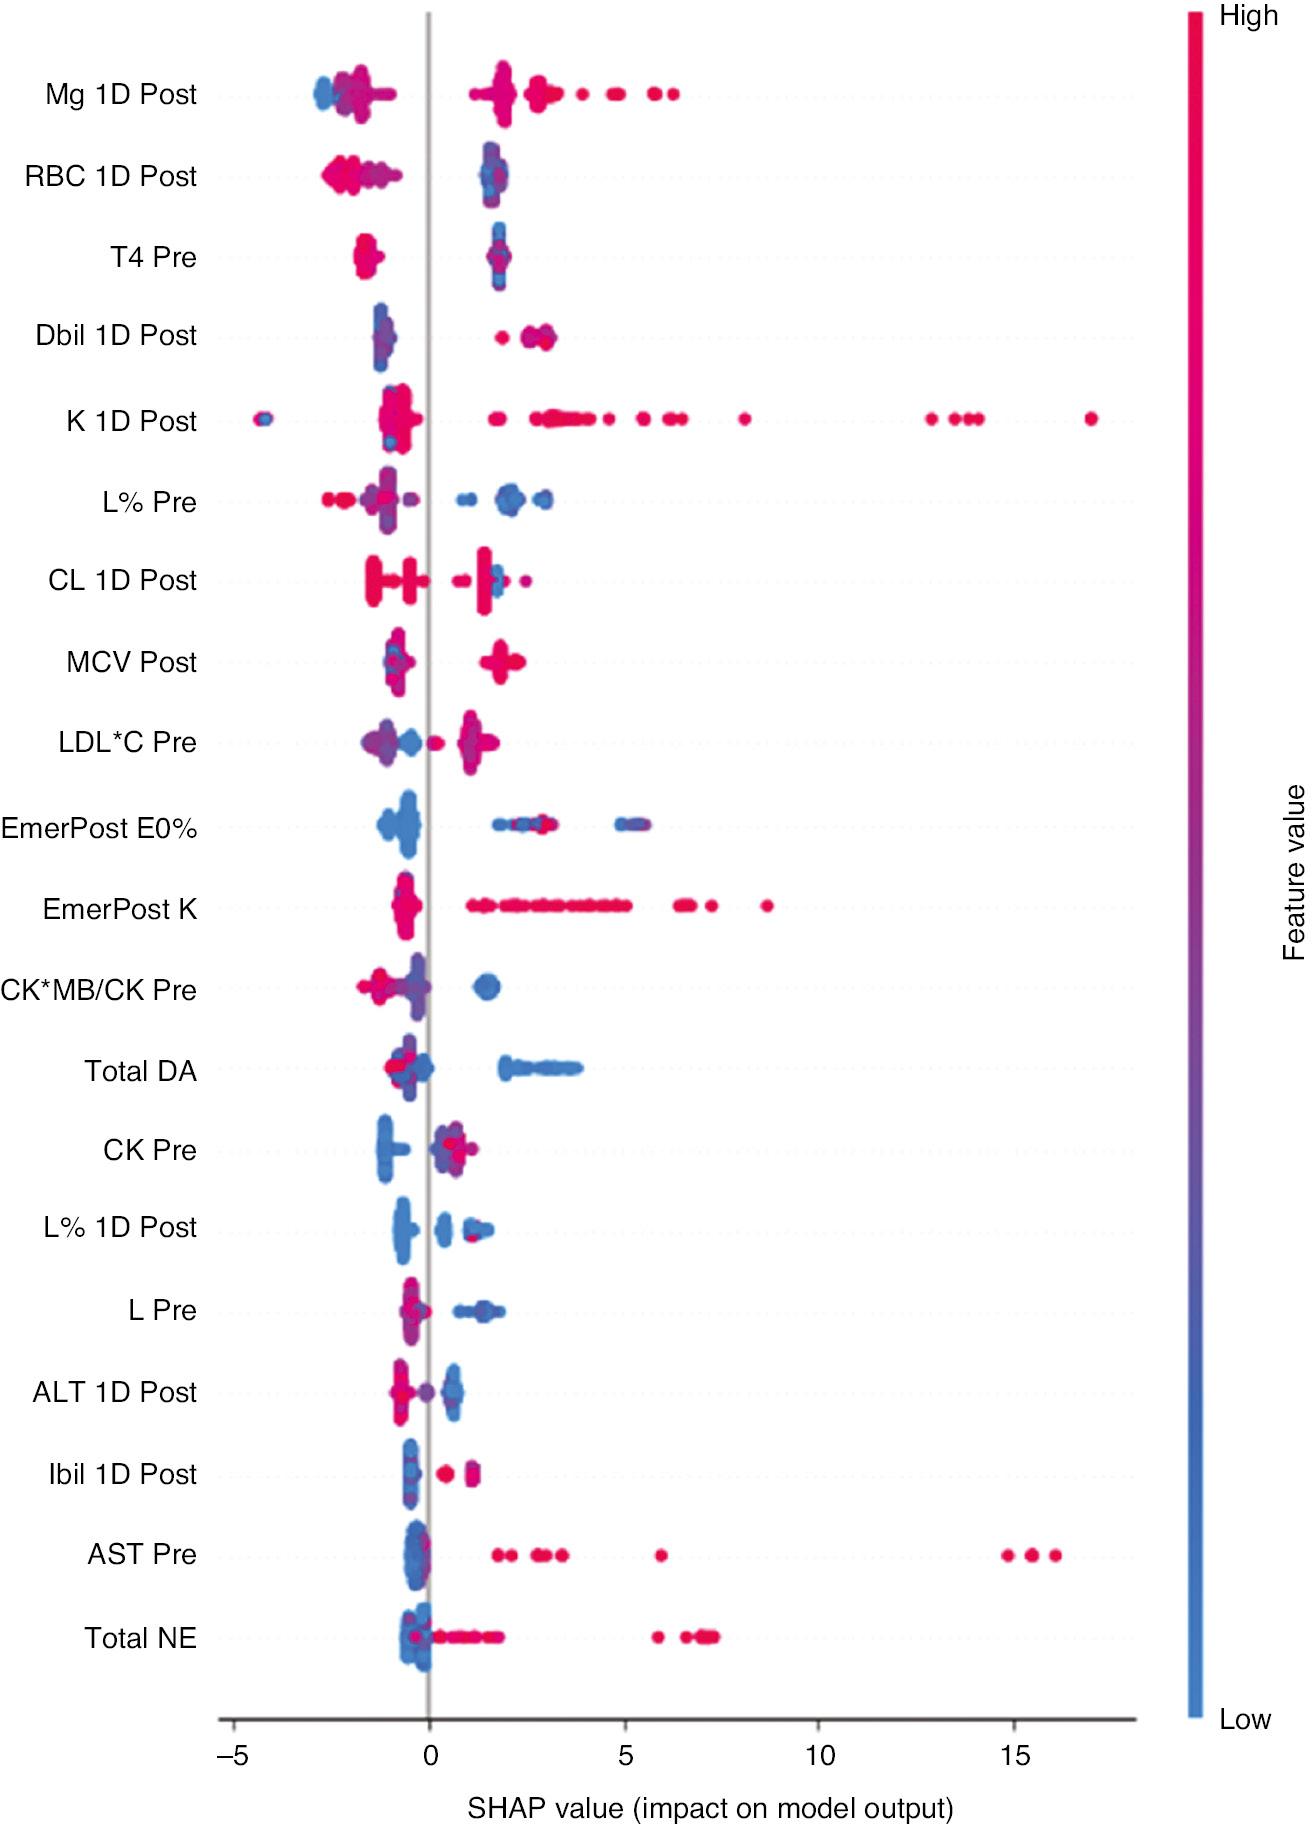
Summary Graph of SHAP for Each Feature.
The higher the SHAP value of a feature, the higher the likelihood of postoperative acute kidney injury. A dot is created for each feature attribute value of the model for each patient, and a dot for each patient is shown on the line for each feature. Dots are coloured according to the respective patient’s feature values, and their vertical accumulation indicates the density. Red indicates higher feature values, and blue indicates lower feature values.
Discussion
In this retrospective cohort study, we developed and validated machine learning algorithms to predict CSA-AKI, based on 293 preoperative, intraoperative and postoperative features. The GBDT model had the largest AUC among the models tested. The most important variables are presented in SHAP bar charts, and each variable is described with SHAP summary plots. This study demonstrated the value of not only preoperative variables but also intraoperative and early postoperative data in predicting CSA-AKI. Our findings suggest that intraoperative medication affects early renal function decline after cardiac surgery and demonstrate additional early postoperative variables for predicting the occurrence of CSA-AKI.
The earlier and better known prediction scores for CSA-AKI, such as the Cleveland Clinic score [18] and the Mehta score, use logistic regression, and ignore the predictive value of intraoperative and early postoperative variables. Most prior studies have used the multivariable logistic regression method, and the AUC has ranged from 0.76 to 0.84 [19]. Flechet et al. have used serum creatinine and other patient information (age, diabetes and admission information) to calculate the risk of AKI during the first week of the ICU stay after admission (stage 2 or 3) [20]. Other data (Acute Physiology and Chronic Health Evaluation [APACHE] II score, bilirubin, maximum lactate level, etc.) are also available. More data from the early postoperative period could be added to the findings from this study to achieve more refined and accurate prediction. Lee et al. were early adopters of machine learning methods for the prediction of CSA-AKI and they have reported that extreme gradient boosting (0.78, 95% CI 0.75–0.80) achieved the best AUC [21]. According to that study, machine learning models performed significantly better than traditional logistic regression models in predicting AKI after cardiac surgery. Our study built on these findings by creating SHAP summary plots showing the risk indexes of the important predictors in the final model.
Several risk factors have been predicted in previous risk scoring models, such as preoperative renal function, age, time to surgery, left ventricular ejection fraction, body mass index, hypertension, preoperative haemoglobin and creatinine clearance [18, 22]. However, these familiar risk factors were not significant in the current study; instead, early postoperative variables for CSA-AKI had high predictive power, possibly because previous studies focused less on the prediction of CSA-AKI in the off-pump CABG procedure. The pathophysiology of CSA-AKI may explain why intraoperative features are critical in the prediction of AKI. Although the pathogenesis of AKI is not fully understood, renal hypoperfusion is known to be produced by low flow, low pressure and haemodilution. In addition, rapid nuclear hypothermia due to extracorporeal circulation, bleeding complications and inflammatory responses all play important roles in the development of CSA-AKI. The early postoperative variables identified by machine learning in this study have not been reported in the literature, and our team will pursue these findings in future research. Nonetheless, early postoperative variables can give clinicians sufficient warning to intervene in CSA-AKI with relevant treatment.
Models built by machine learning methods can be based on datasets from all available patients to enable early dynamic monitoring, thus saving clinicians time. Artificial intelligence and machine learning have already yielded many achievements in clinical medicine research, such as the assessment of postoperative patient outcomes [12] in cardiovascular imaging [23] and the prediction of death in chronic kidney disease [24]. In addition, machine learning has been applied to critical care/intensive care medicine [25], emergency medicine [26] and neurology [27]. With the expansion of electronic health records in the era of big data, the intersection of large amounts of electronic health record data and artificial intelligence has increased the importance of machine learning in AKI clinical research; AI tools are now effective in the diagnosis and prediction of AKI [28]. In this study, the risk of AKI after cardiac surgery was determined by the preoperative health condition–related susceptibility to acute stress and large dynamic physiological responses intraoperatively, thus reflecting the ongoing response to surgery. Therefore, software may be developed that can identify high-risk patients who are prone to AKI for the optimisation of treatment strategies after cardiac surgery.
This study has several limitations: 1) The study analysis used only single-centre data with a relatively small number of cases. The performance of the machine learning algorithm may vary depending on patient characteristics with different distributions and larger datasets from different institutions. Therefore, external validation is required to prevent overfitting. 2) Because the dataset was manually implemented by physicians, some hidden variable relationships might have been be lost because of human error. 3) Whether the risk predictive models constructed will translate into actual clinical benefits for patients in clinical practice is unclear; therefore, prospective multicentre studies are required. 4) The data were mostly manually entered, and owing to the relatively large volume of data, some input errors were inevitable.
In summary, we developed a machine learning method that can be used to predict the risk of AKI development after surgery. The results of this study show that early postoperative variables are critical in AKI prediction. As research continues, a machine learning-based real-time patient monitoring system may assist clinicians in providing valuable clinical decision support, and decreasing the mortality and incidence of CSA-AKI. This system would not only reveal the complex relationships between predictors but also assess the risk of CSA-AKI events in patients postoperatively. Consequently, physicians would be able to identify patients at higher risk and to use protective strategies that improve patient prognosis, and decrease the length of stay and hospital costs.