Significance Statement: In this study, we established a rat vein transplant model to study postsurgical changes in microRNA expression associated with adaptation to the new arterial environment, which involves intimal hyperplasia and vascular wall remodeling. Using high-throughput sequencing, we identified a series of differentially expressed micro RNAs, both known and novel, between three groups (a postoperative day 3 group, a postoperative day14 group, and a control group). Target gene prediction and functional annotation further revealed the likely roles of pathways involved in cell proliferation and vascular smooth muscle contraction. We believe that our study makes a significant contribution to the literature because restenosis of vein grafts remains common and very little is known about the detailed molecular mechanisms driving the process of intimal hyperplasia. Therefore, our findings provide a valuable resource for further research on some of the identified microRNAs as candidate targets for the development of new treatments or stenosis prevention strategies. These findings also expand the roles and pathological functions of microRNAs and their associated pathways.
Introduction
Coronary artery bypass grafting (CABG) is a common means of revascularization in the treatment of coronary heart disease, a disease that threatens human health. The most common graft material for this purpose is an autologous great saphenous vein; however, long-term follow-up studies demonstrated a patency rate of less than 61% 10 years after CABG [1, 2]. Vein graft restenosis is the main factor that influences the long-term outcome after CABG, requires new strategies for treatment and prevention, and has become a major focus of cardiovascular research [3]. Intimal hyperplasia is one of the main pathological processes that contribute to the development of stenosis and blockages after vein transplantation caused by endothelial cell injury, excessive proliferation of vascular smooth muscle cells (VSMCs) and their migration to the intima, and the accumulation of extracellular matrix [4]. Therefore, elucidation of the detailed molecular mechanisms contributing to these processes can highlight new targets for treatment and prevention.
MicroRNAs (miRNAs) are critical for posttranscriptional gene regulation in multiple biological processes, including cell differentiation, proliferation, metabolism, and the inflammatory response [5–7]. They usually bind to their target genes through complementary pairing of base sequences, thereby affecting gene expression [8]. Abnormal expression of miRNAs has been closely associated with the occurrence and development of cardiovascular diseases [9, 10], leading to the development of gene therapy strategies based on miRNA intervention, which show great promise on the basis of studies with related animal models [11]. However, the specific miRNAs and related pathways involved in the susceptibility and development of posttransplant vein restenosis remain unclear. In this study, we established a rat model for vein transplantation and used high-throughput sequencing to profile miRNA expression at different times during the development of intimal hyperplasia in the vein grafts. The differentially expressed miRNAs identified were then subjected to bioinformatic analysis to predict target genes and determine their functions. The findings can provide new insights into the pathogenesis of transplanted vein restenosis that should promote further research for improving treatment and prevention, while expanding the physiological and pathological roles of miRNAs.
Materials and Methods
Animal Model
Specific pathogen-free Sprague Dawley male rats weighing 250–300 g were purchased from Shanghai Laboratory Animal Center, People’s Republic of China. The rats were housed in standard conditions and provided ad libitum access to food and water. All experimental rats were handled and maintained in accordance with the regulations on the control of experimental animals of the People’s Republic of China, and the experimental protocols were reviewed and approved by the Ethics Committee for Animal Experiments of Zhengzhou University. The rats were randomly divided into three groups: a control group, a postoperative day3 (POD3) group, and a postoperative day14 (POD14) group.
The rat vein graft model was established as previously described [12]. In brief, the rats were intraperitoneally anesthetized with 10% chloral hydrate (0.4mL/100g). The left external jugular vein was grafted into the lower abdominal aorta with use of a 10-0 noninvasive suture and intermittent suture. The left external jugular vein of the control group was not transplanted. All rats were expertly operated on by the same individual.
Hematoxylin and Eosin Staining
To confirm proper establishment of the model, at the end of the experiment, the rats were anesthetized by intraperitoneal injection of 10% chloral hydrate (0.4 mL/100g), intravenous grafts were obtained, and the rats were killed. The venous graft was fixed with 4% paraformaldehyde for 24h, dehydrated, embedded in paraffin, and sectioned continuously at 4 μm. Sections were stained with a hematoxylin and eosin staining kit (Beyotime Biotech Co. Ltd., Shanghai, People’s Republic of China). The neointima was defined as the region between the lumen and the internal elastic lamina, and the neointimal area was quantified with ImageJ 1.6.0 (National Institutes of Health, Bethesda, MD, USA).
Total RNA Extraction and Sequencing
Venous samples from the three groups of rats were harvested for RNA extraction. Total RNA from the rat vascular tissues was extracted with a mirVana RNA isolation kit (Applied Biosystems, Foster City, CA, USA). Libraries were constructed with TruSeq Small RNA Sample Prep Kits (Illumina, San Diego, CA, USA) according to the manufacturer’s instructions. The libraries were sequenced on a HiSeq 4000 sequencing platform (Illumina, San Diego, CA, USA). All sequencing was performed by Shanghai OE Biotech Co. Ltd.
Expression and Functional Analysis
The expression levels of known and newly predicted miRNAs were calculated in units of transcripts per million. The miRNAs differentially expressed between the groups were identified as a fold change in expression level of 2.00 of greater and with P<0.05. Volcano maps were generated to visualize the overall distribution of the differentially expressed miRNAs. These miRNAs were hierarchically clustered, and heat maps were generated with the R platform. The MiRanda algorithm was used to predict the miRNA target genes, which were then subjected to Gene Ontology (GO) and Kyoto Encyclopedia of Genes and Genomes (KEGG) enrichment analyses to determine the main biological processes and pathways. GO and KEGG pathways with corrected P values less than 0.05 were considered to be significantly enriched.
Reverse Transcription–Quantitative Polymerase Chain Reaction
Reverse transcription–quantitative polymerase chain reaction (RT-qPCR) was used to validate a subsample of the differentially expressed miRNAs obtained from the sequencing results. Total RNA was extracted with TRIzol (Invitrogen, Carlsbad, CA, USA) and used to synthesize complementary DNA after miRNA polyadenylation and reverse transcription with the Mir-X miRNA First-Strand Synthesis Kit (Takara Biomedical Technology Co. Ltd., Beijing, People’s Republic of China). The complementary DNA was used as a template in qPCR with SYBR Green Realtime PCR Master Mix (Toyobo Co. Ltd.) according to the manufacturer’s instructions on a QuantStudio 6 Flex system (Applied Biosystems). U6 and GAPDH were used as references for normalizing miRNA and target gene expression, respectively. All primers were synthesized by Sangon Biotech Co. Ltd. (Shanghai, People’s Republic of China); sequences are provided in Table 1.
The Primer Sequences Used in Quantitative Polymerase Chain Reaction.
| Gene | Forward primer |
|---|---|
| miR-132-3p | 5′-AACACGCTAACAGTCTACAGCCA-3′ |
| miR-142-3p | 5′-AACACGTGTGTAGTGTTTCCTACTT-3′ |
| miR-155-5p | 5′-AGCCAGCGTTAATGCTAATTGTGAT-3′ |
| miR-21-5p | 5′-AACACGCTAGCTTATCAGACTGATG-3′ |
| let-7a-5p | 5′-AACACGTGTGAGGTAGTAGGTTGTA-3′ |
| let-7b-5p | 5′-AACAAGTGAGGTAGTAGGTTGTGTG-3′ |
Results
Confirmation of Neointima Formation after Venous Transplantation in Rats
Hematoxylin and eosin staining showed that the wall of the venous blood vessels outside the neck of the control group rats was thin, and the intima comprised only a monolayer of endothelial cells without intimal hyperplasia (Figure 1A). Intimal hyperplasia was not obvious 3 days after the operation (Figure 1B). However, obvious intimal hyperplasia was observed 14 days after the operation (Figure 1C), and the vascular wall began to thicken, confirming successful establishment of the model [13].
Deep Sequencing of miRNAs in Vein Grafts
After high-throughput sequencing and subsequent quality control, high-quality clean reads were obtained for analysis. The number of clean reads of all samples ranged from 13,514,150 to 16,047,178. The length of all clean reads was between 20 and 24 nucleotides, with the largest population of reads being 22 nucleotides. Small RNAs were classified and annotated on the basis of the Rfam database, species reference transcript, and repeat sequence database. However, numerous small RNAs could not be annotated, ranging from 5,630,831 to 9,434,676 sequences (Table 2). This indicated that a high proportion of the small RNAs in the sequencing results were not mined. After the repetitive sequences had been filtered out, the reads were matched with the mature miRNA sequence in miRBase without mismatching: 603 matched sequences were considered to be known miRNAs and 711 novel miRNAs were also obtained (Table 3).
Distribution of Reads in Each Sample.
| Category | Reads | ||||||||
|---|---|---|---|---|---|---|---|---|---|
| Control 1 | Control 2 | Control 3 | POD3 1 | POD3 2 | POD3 3 | POD14 1 | POD14 2 | POD14 3 | |
| rRNA | 3241 | 5196 | 6208 | 10,048 | 11,560 | 11,792 | 5485 | 7159 | 10,204 |
| tRNA | 221 | 671 | 763 | 1266 | 1561 | 1485 | 810 | 954 | 1357 |
| snRNA | 1845 | 3620 | 4354 | 7931 | 8570 | 8514 | 4874 | 6081 | 9555 |
| miRNA | 7,013,328 | 5,406,755 | 5,215,894 | 2,915,887 | 2,903,378 | 2,855,901 | 5,416,319 | 3,731,445 | 4,452,654 |
| Not annotated | 5,630,831 | 7,785,385 | 9,434,676 | 7,248,658 | 9,192,172 | 7,003,121 | 6,834,676 | 6,944,238 | 6,838,645 |
miRNA, microRNA; POD, postoperative day; rRNA, ribosomal RNA; snRNA, small nuclear RNA; tRNA, transfer RNA.
Number of Known and Novel microRNAs (miRNAs) Detected in Each Sample.
| Category | Control 1 | Control 2 | Control 3 | POD3 1 | POD3 2 | POD3 3 | POD14 1 | POD14 2 | POD14 3 |
|---|---|---|---|---|---|---|---|---|---|
| Know miRNAs | 498 | 476 | 485 | 500 | 510 | 502 | 510 | 486 | 510 |
| Novel miRNAs | 268 | 294 | 367 | 536 | 553 | 542 | 503 | 520 | 560 |
POD, postoperative day.
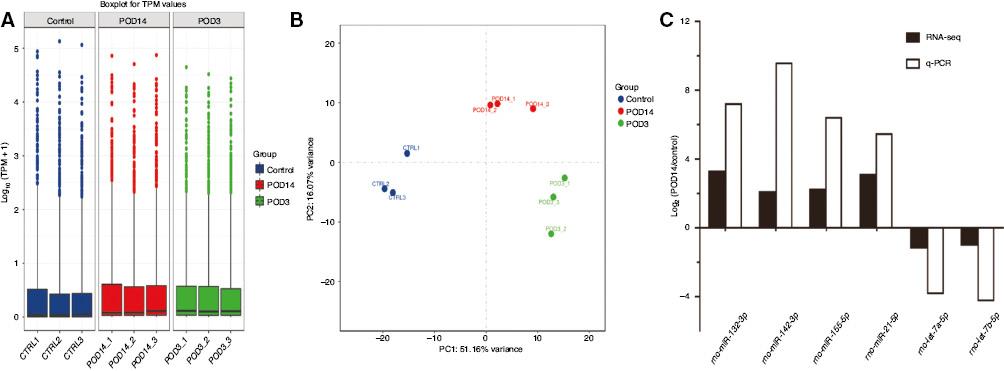
A box-whisker plot was constructed to visualize the extent of miRNA symmetry and dispersion in each sample (Figure 2A), and principal component analysis was performed to inspect the sample distribution and intersample relationships (Figure 2B). The principal component analysis plot showed an aggregated distribution for most of the samples in the same group, indicating a high degree of homogeneity within groups. However, the three groups were divided into different quadrants, representing significant intergroup differences in the miRNA profiles.

(A) Box-Whisker Plot of microRNA Expression Among Nine Samples. (B) Principal Component (PC) Analysis for the Nine Samples From the Control Group (CTRL1, CTRL2, CTRL3), the Postoperative Day3 Group (POD3_1, POD3_2, POD3_3), and the Postoperative Day14 Group (POD14_1, POD14_2, POD14_3). Each Group and All Replicates have been Clearly Segregated. (C) Reverse Transcription–Quantitative Polymerase Chain Reaction (qPCR) Validation of the Expression of Six Selected Differentially Expressed microRNAs Between the Three Groups. CTRL, control; POD, postoperative day; RNA-seq, RNA sequencing; TPM, transcripts per million.
Differential Expression of miRNAs during Intimal Hyperplasia of the Vein Graft
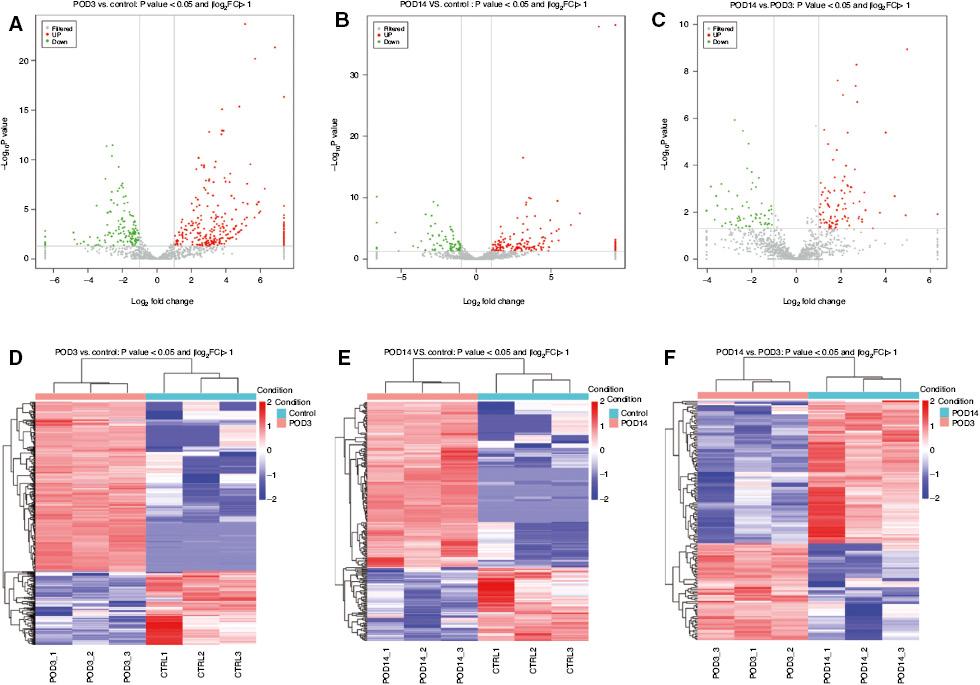
The volcano plots of differentially expressed miRNAs among the three comparisons are shown in Figure 3A–C. Three heat maps were used to display all the differentially expressed miRNAs in the POD3 group versus the control group (Figure 3D), the POD14 group versus the control group (Figure 3E), and the POD14 group versus the POD3 group (Figure 3F). Compared with the control group, 437 differentially expressed miRNAs were detected in the POD3 group, 304 of which were upregulated and 133 of which downregulated. Compared with the control group, 265 differentially expressed miRNAs were detected in the POD14 group, including 183 upregulated and 82 downregulated miRNAs. Compared with the POD3 group, 158 differentially expressed miRNAs were detected in the POD14 group, including 94 upregulated and 64 downregulated miRNAs. Six of these miRNAs were then selected for validation with RT-qPCR, which showed consistent patterns with the deep sequencing results (Figure 2C), indicating that the sequencing results were highly reliable.

Volcano Plots of Differentially Expressed microRNAs Between (A) the Postoperative Day3 (POD3) Group and the Control Group, (B) the Postoperative Day14 (POD14) Group and the Control Group, and (C) the POD14 Group and the POD3 Group. Heat Maps of Differentially Expressed microRNAs Between (D) the POD3 Group and the Control Group, (E) the POD14 Group and the Control Group, and (F) the POD14 Group and the POD3 Group. CTRL, control; FC, fold change.
Prediction of Target Genes of Differentially Expressed miRNAs and Functional Enrichment Analysis
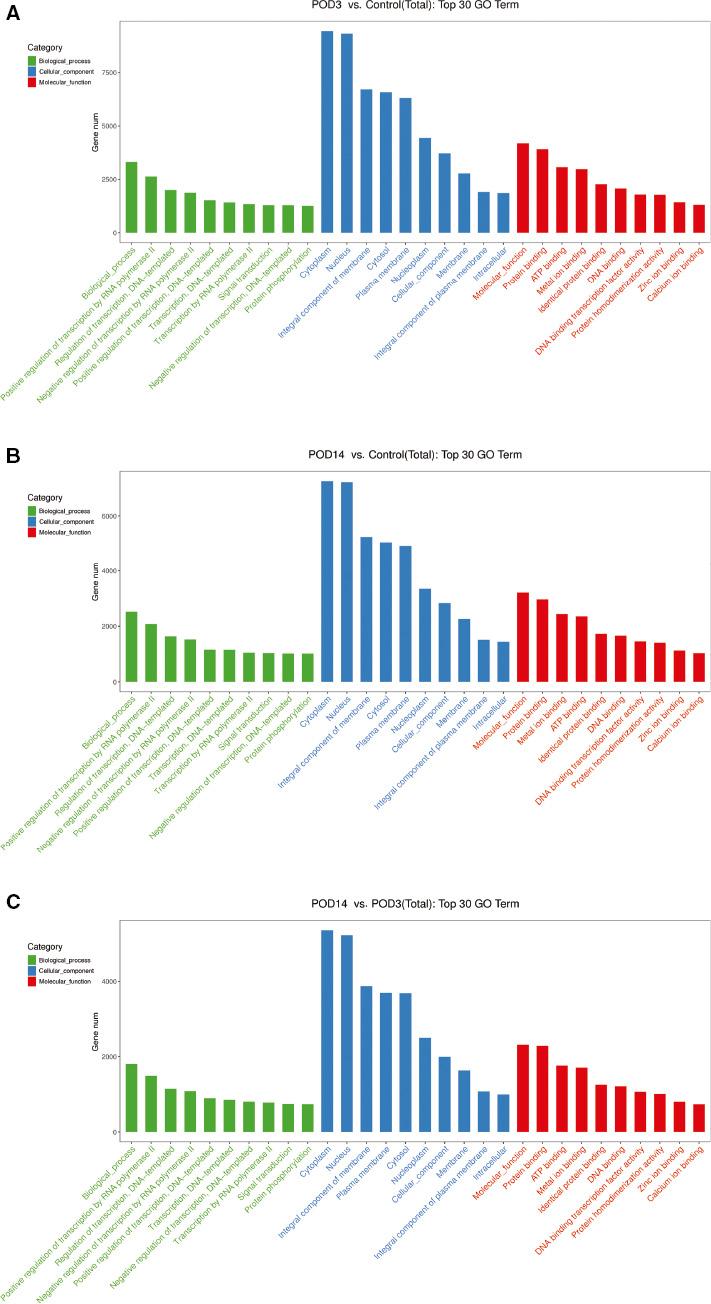
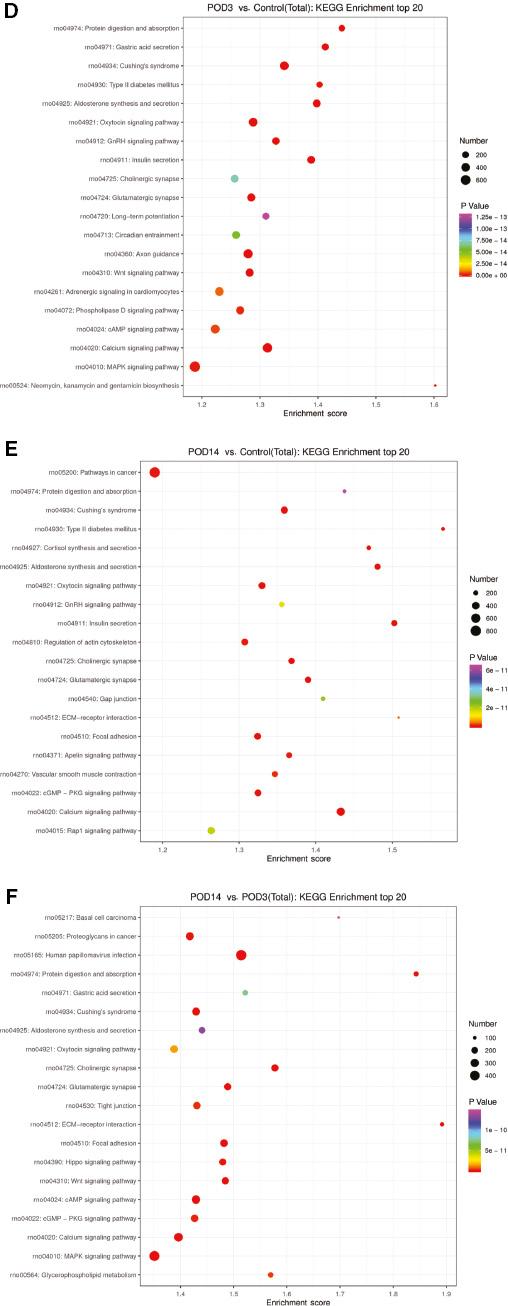
In the early stage of intimal hyperplasia of the transplanted vein, most of the significantly enriched GO terms were in the biological process category, including “positive regulation of transcription by RNA polymerase II,” “regulation of transcription DNA-templated,” and “negative regulation of transcription by RNA polymerase II”; with the cellular component terms “cytoplasm,” “nucleus,” and “integral component of membrane”; and the molecular function terms “protein binding,” “metal ion binding,” and “ATP binding.” KEGG pathway analysis showed that the target genes of the differentially expressed miRNAs are involved mainly in mitogen-activated protein kinase (MAPK) (rno04010), cyclic AMP (rno04024), Wnt (rno04310), oxytocin (rno04921), and calcium (rno04020) signaling (Figure 4A–F).


Functional Analysis of the Predicted Target Genes of Differentially Expressed microRNAs.
Gene Ontology (GO) enrichment analysis of the top ten biological processes, cellular components, and molecular function terms between (A) the postoperative day3 (POD3) group and the control group, (B) the POD3 group and the control group, and (C) the postoperative day14 (POD14) group and the POD3 group. Kyoto Encyclopedia of Genes and Genomes (KEGG) analysis of the top ten pathways related to the target genes of differentially expressed microRNAs between (D) the POD3 group and the control group, (E) the POD3 group and the control group, and (F) the POD14 group and the POD3 group. cAMP, cyclic AMP; cGMP, cyclic GMP; ECM, extracellular matrix; GnRH, gonadotropin-releasing hormone; MAPK, mitogen-activated protein kinase; PKG, protein kinase G.
Discussion
After transplantation, vein grafts encounter a new hemodynamic environment, requiring a period of adaptation in the new arterial environment, during which time intimal hyperplasia and vascular wall remodeling occur [14, 15]. However, the cellular and molecular mechanisms underlying intimal hyperplasia in vein grafts have not been fully elucidated. Some studies have reported the regulation of single miRNAs related to intimal hyperplasia. For example, miR-126-3p promotes the proliferation of human great saphenous endothelial cells cultured in vitro, and inhibits the intimal hyperplasia of transplanted veins by targeting sprouty-related protein-1 (SPRED-1) and phosphatidylinositol-3-kinase regulatory subunit 2 (PIK3R2) in vascular endothelial cells [16]. miR-221 plays an important role in regulating the proliferation and phenotypic transformation of VSMCs, and adenoviral-mediated miRNA-221 gene therapy inhibits the development of venous graft neointimal hyperplasia in a rat model [17, 18]. Despite the wide application of genetic sequencing technology in life science research, little is known about the data related to the miRNA expression generated with high-throughput sequencing of vein grafts. Thus, our results provide a first step in filling this gap and can serve as a resource for further research into the molecular mechanisms and development of new treatment or prevention strategies.
Compared with the control group, 437 differentially expressed miRNAs were detected in the POD3 group and 183 were detected in the POD14 group. Some of the identified miRNAs have been reported to regulate the proliferation and migration of VSMCs. For example, miR-125b expression was decreased in both the POD3 group and the POD14 group; this was in accordance with a previous study showing decreased levels of miR-125b in arteriosclerosis obliterans arteries [19]. Moreover, the serum response factor gene (SRF) was identified as a direct target of miR-125b, and exogenous miR-125b expression modulated SRF expression and inhibited vascular neointimal formation in balloon-injured rat carotid arteries by suppressing the proliferation and migration of VSMCs [19]. Upregulation of miR-92a was reported to promote the proliferation and migration of VSMCs, highlighting a potential therapeutic target for atherosclerosis [20]. In this study, the expression of miR-92a was elevated in both the POD3 group and the POD14 group, and suggested a potential role of miR-92a in graft restenosis. However, the roles of most of the identified known and novel differentially expressed miRNAs during intimal hyperplasia of vein grafts remain unclear. Therefore, further studies are needed to help clarify the functions and roles of the other identified miRNAs.
Some important signal transduction pathways were identified from the GO and KEGG analyses of the target genes of the differentially expressed miRNAs. In comparison with the control group, the MAPK signaling pathway and the Wnt signaling pathway showed the most significant degree of enrichment in the POD3 group. MAPK signaling is an important pathway that transmits a diverse range of signals to the nucleus through signaling cascades, which subsequently act on specific target genes to exert a range of biological effects [21, 22]. Inflammatory factors, oxidative stress, and mechanical stimulation activate MAPK signaling and are deeply involved in vein graft restenosis [23]. Activation of MAPK signaling is involved in DNA synthesis in stress-induced VSMCs in rats [24]. In the Wnt signaling pathway, Wnt activates T cell cytokines in the nucleus by stimulating β-catenin, thus upregulating cyclin D1 and cell proliferation [25–27]. Wnt signaling positively correlates with VSMC proliferation. It has been reported that Wnt4 is upregulated and Wnt/β-catenin signaling is activated in proliferating VSMCs during intimal thickening [28]. Although several studies have confirmed the correlation between Wnt signaling and VSMC proliferation, the complexity of Wnt signaling and crosstalk with other signaling pathways must also be taken into account [29, 30]. Therefore, the specific role of Wnt signaling in VSMC proliferation remains to be further explored in subsequent studies. At the later stage of intimal hyperplasia, GO and KEGG analysis of the POD14 group versus the control group revealed enrichment in vascular smooth muscle contraction and regulation of actin cytoskeleton signaling pathways, both of which are closely related to the proliferation, migration, and phenotypic transformation of VSMCs [31, 32]. This finding suggests that these pathways may also be involved in the pathophysiology of intimal hyperplasia of vein grafts.
miRNA sequencing can comprehensively detect expression profiles, and has become a common technique to detect functional miRNAs. One of the advantages of miRNA sequencing is its ability to discover novel miRNAs. We used the software program MiRDeep2 to identify new miRNAs and predict the secondary structure of sequences mapping the genome [33, 34]. Some of the novel miRNA sequences include those that are precursors of miRNA hairpins. Quantitative analysis was performed on mature and star sequences of the 711 novel predicted miRNAs; however, the validation and functional analysis of these novel miRNA remains to be explored in the future.
In conclusion, we determined the differential expression profile of miRNAs during the early stage of intimal hyperplasia of vein grafts using high-throughput sequencing, and performed bioinformatic analysis to functionally annotate the miRNAs. These findings will provide valuable information for developing strategies for the prevention and treatment of graft vein restenosis.


