
Introduction
Ventricular tachycardia is a life-threatening heart disease that occurs frequently in patients with myocardial infarction (MI) [1]. The presence of MI has an important prognostic and therapeutic value for predicting ventricle remodeling and cardiac dysfunction [2]. Late gadolinium enhancement (LGE) magnetic resonance imaging (MRI) is the standard imaging technique used for MI detection [3, 4]. It has many advantages compared with computed tomography and echocardiography [4], and has become the first choice for detecting myocardial fibrosis [5, 6].
Although LGE MRI is widely used in a clinical setting to detect the location, transmurality, and composition of an infarct [7], there is no recognized optimal method of LGE quantification [8]. Numerous methods for segmenting infarct tissues in the left ventricle have been devised. Of these, the most frequently used are threshold based, such as the full width at half maximum (FWHM) method [9] and the n standard deviations (nSD) method [10]. Although they are widely used in the clinic and in research, they require manual intervention, which is subjective and inefficient. Several semiautomatic and automatic methods have been proposed [11, 12], but most still require manual input or postprocessing, which hinders efficient image processing for a large number of patients.
The aim of this study was to validate the accuracy of a new automatic segmentation method and compare its performance against that of the nSD and FWHM methods for scar segmentation.
Methods
Image Acquisition
Cardiovascular magnetic resonance (CMR) images from 26 diseased hearts were collected from Beijing Anzhen Hospital. Basic information on the patients is given in Table 1. This study was approved by the Institutional Review Board of Beijing Anzhen Hospital, and informed consent was obtained from all participants. The detailed image acquisition protocol was published previously [13]. Briefly, CMR scans were performed with a 1.5 T scanner (Sonata, Siemens, Erlangen, Germany) with chest electrocardiogram gating and breath-hold techniques. The contrast agent was injected via an ulnar vein under high pressure, and late imaging was performed 15 min later. The scanning layer thickness was 8 mm or 10 mm with a field of view between 320×320 mm2 and 340×340 mm2. The final in-plane image resolution was between 1.4 mm and 1.75 mm.
Characteristics of the Study Population.
| Frequency (%) | Mean±SD | |
|---|---|---|
| Men | 96.2 (n=25) | – |
| Women | 3.8 (n=1) | – |
| Age (years) | – | 57.58±10.58 |
| EF (%) | – | 40.37±14.83 |
| LVEDV (mL) | – | 132.22±51.52 |
| Scar mass (mm3) | – | 30,436.48±23,095.58 |
| Total scar (%) | – | 23.25±13.86 |
EF, ejection fraction; LVEDV, left ventricular end-diastolic volume; SD, standard deviation.
Image Processing
All analyses and measurements were performed with custom software developed in MATLAB (The MathWorks, USA). For all LGE CMR images, the epicardial and endocardial boundaries in every two-dimensional slice were manually segmented by one experienced expert. The papillary muscles were excluded from the endocardium. Then pixels between the epicardial and endocardial boundaries were segmented by nSD thresholding, FWHM thresholding, and our new automatic method (see the third paragraph of this section).
For the nSD method, observers with 1, 3, and 8 years of image segmentation experience selected a region of interest (ROI) far from the enhanced area. Then the mean and the SD of the selected ROI were calculated, and pixels with an intensity greater than nSD above the mean were defined as infarct tissue. The value of n was selected as 2, 4, 6, 8, or 10. For the FWHM method, the same three people selected one enhanced area, the maximal intensity of the selected enhanced area was calculated, and the pixels with intensity greater than half the maximal value were segmented as infarct tissue. For both the nSD method and the FWHM method, further manual improvements to the segmented images were made, including the removal of pixels not connected to the infarct tissue.
The automatic algorithm developed by our group uses a classification method based on the Gaussian mixture model to segment the tissue inside the epicardial and endocardial boundaries. The Gaussian mixture model assumes a Gaussian distribution of the image intensity of each fitted class (in our case noninfarct tissue and infarct tissue) [14, 15], each class having its own mean intensity μ and variance σ 2. The maximal intensity (I max) and minimal intensity (I min) of the pixels between the epicardium and endocardium were calculated, and those pixels with intensity greater than 0.3 (I max−I min) were designated as containing infarct tissue. Next, the regions in each image layer with more than 15 pixels were retained to remove small clusters of pixels affected by noise or blood vessels. The maximal component in each layer and the components with pixel intensities greater than 15% of the maximal components were then designated as the final infarct tissue to remove numerous pixels containing fat tissue or artifacts.
Evaluation Metrics
After analysis of the entire stack of ventricular images, the Dice and volume difference metrics were used to evaluate the segmentations. The Dice score represents the overlap between the ground truth (the segmentation of scar tissue performed by two experts with more than 10 years of CMR image segmentation experience) and the segmentation produced by the other algorithms described earlier. The volume difference measures the difference between the infarct volumes measured with the ground truth and the other segmentation algorithms.
Results
The segmentations obtained with the nSD method, the FWHM method, and the automatic method were compared with the consensus ground truth and their accuracy was measured by the Dice score. Without any manual intervention, our automatic segmentation method produced the highest Dice score (0.8) and the smallest variation in the Dice score for each image dataset (Figure 1A). The 6SD and 8SD methods yielded a mean Dice score of 0.72, and the variation of the Dice score for each image dataset was much greater than that for the automatic method. The FWHM method had a mean Dice score of 0.64, and the variation of the Dice score for each image dataset was comparable with that for the automatic method.
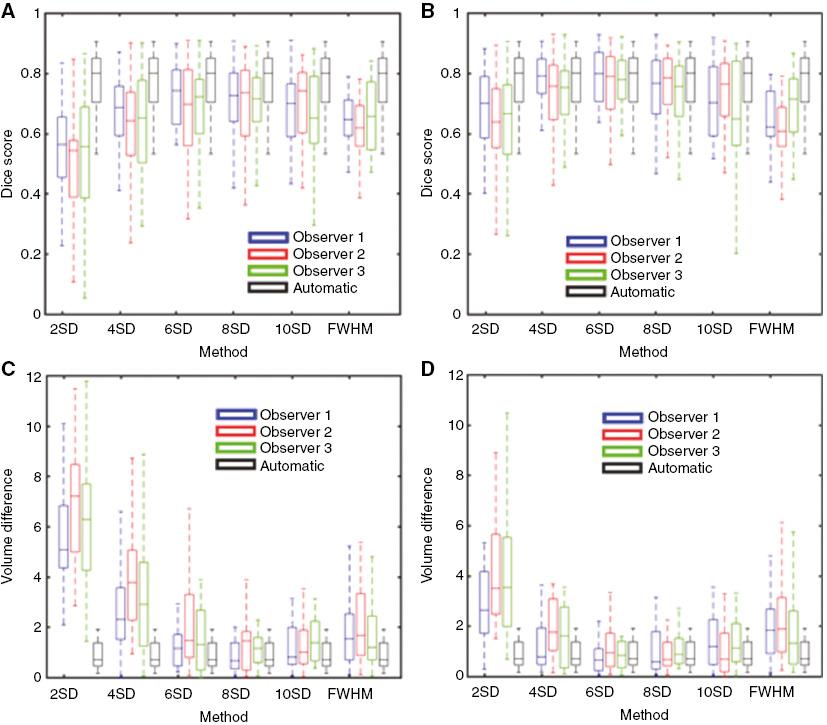
Segmentation accuracy of the automatic method and of individual observers using other segmentation methods. Dice scores and volume differences were calculated for every region of scar tissue found in the consensus segmentation. Panel (A) is the dice score without any manual intervention; Panel (B) is the dice score with manual removal of pixels that were not connected to the infarct tissue; Panel (C) is the volume difference without any manual intervention; Panel (D) is the volume difference with manual removal of pixels that were not connected to the infarct tissue. Volume differences are reported in milliliters. SD, Standard Deviations.
After manual removal of pixels that were not connected to the infarct tissue, the Dice scores produced with the nSD and FWHM methods were increased (Figure 1B). The 6SD and 8SD methods produced mean Dice scores of 0.79 and 0.77, respectively, which were close to the value obtained with the automatic method. The Dice score obtained with the FWHM method increased minimally from 0.64 to 0.65.
To further evaluate the accuracy of the infarct tissue segmentation, we also compared the volume difference between the consensus ground truth and the three segmentation methods (Figure 1C and D). Our automatic method produced the smallest volume differences, with a median value of 0.70 mL. Before manual modification of the segmented images (Figure 1C), the median values of the volume differences produced by the 6SD and 8SD methods were 1.31 mL and 1.09 mL, respectively. The FWHM method yielded a median volume difference of 1.47 mL. After manual modification of the segmented images (Figure 1D), the median values of the volume differences obtained with the 6SD and 8SD methods decreased to 0.81 mL and 0.71 mL, respectively. Manual intervention increased the median volume difference obtained with the FWHM method to 1.68 mL.
For different observers, large variations in the Dice score and the volume difference were obtained, especially before manual adjustments were made. The automatic method did not require any manual intervention for scar segmentation and thus had the highest reproducibility. The nSD method produced large variations in both the highest Dice scores and the lowest volume differences. For observers 1 and 3, the highest Dice score was obtained with the 6SD method, whereas the 10SD method yielded the highest Dice score for observer 2. The Dice score obtained with the FWHM method also varied for each observer. After adjustment of the segmented images, the 6SD method yielded the highest Dice score for all three observers. Before manual intervention, the 8SD method produced the lowest volume difference for observers 1 and 3, whereas the 10SD method resulted in the lowest value for observer 2. After manual adjustment of the image segmentation, the 8SD method produced the lowest volume difference for observers 1 and 2, while the 6SD method yielded the lowest value for observer 3.
Figure 2 shows different observers’ segmentations of one patient’s CMR images. The “manual” panel shows the manual segmentation of one slice, which was treated as the ground truth segmentation. The “automatic” panel shows the segmentation of scar tissue obtained with our automatic method. The result was very close to the consensus ground truth, which can be attributed to the efficient removal of artifacts by the automatic method. The first row in each observer’s segmentation in Figure 2 shows the scar segmentation produced with the nSD method (n=2, 4, 6, 8, and 10) and the FWHM method. The second row shows the modified segmentation obtained after manual removal of pixels disconnected from the infarct tissue. For all observers’ segmentations, the 2SD, 4SD, 6SD, and 8SD methods needed manual intervention to remove artifacts associated with fatty tissue on the epicardium. The 10SD method sometimes omitted some scar tissue from the segmentation (observer 3), whereas the FWHM method excluded some scar tissue in all observers’ segmentations.

Discussion
Comparison of the three methods for segmentation of infarct tissue in the ventricle showed that our automatic method produced the highest Dice score and the lowest volume difference compared with the consensus ground truth segmentation. The automatic method does not require any manual intervention and therefore produces highly reproducible and objective results. The nSD method resulted in large variations in the Dice score and volume difference for all values of n studied. Although the 6SD and 8SD methods yielded relatively good results, they relied on manual identification and removal of isolated pixels or artifacts. Furthermore, the segmentation of different patients’ images differed markedly between different observers, making the nSD method highly variable and unobjective. The FWHM method resulted in the lowest Dice score and highest volume difference compared with the automatic, 6SD, and 8SD methods, but was less variable when different observers segmented the images.
Both the nSD method and the FWHM method have been widely used for clinical image segmentation [10, 16]. Our results are consistent with those of earlier studies in which the 6SD method (n=2–6) produced the highest Dice scores [11] and the FWHM method yielded lower Dice scores [12, 13]. Compared with the nSD method, the FWHM method has greater reproducibility. However, both methods need manual input to select the ROIs for threshold computation and for artifact removal [11].
Several automatic or semiautomatic methods are used to segment infarct tissue [11]. The advantage of our method is that it is fully automated, which is desirable when imaging datasets from a large number of patients are being processed. However, our method is still limited by false segmentation introduced by noise, fatty tissue, or artifacts caused by an implantable cardioverter-defibrillator. In addition, although our method is fully automatic with respect to scar segmentation, it still requires manual segmentation of the endocardium and epicardium in the left ventricle.
Conclusions
We compared three methods for segmenting CMR images containing infarct tissue in the ventricle. Our automatic method proved to be highly repetitive and objective, producing the highest Dice scores and the lowest volume differences compared with the consensus ground truth segmentation. The 6SD and 8SD methods yielded relatively good metrics, but they produced considerable variation in image segmentation by different observers and therefore lacked reproducibility and objectivity. Although segmentation by the FWHM method suffered from less variation between observers, this algorithm yielded the lowest Dice scores and highest volume differences. The automatic method is therefore highly recommended for segmenting ventricular scar tissue, and may be useful for processing large imaging datasets produced in the clinic.