
INTRODUCTION
What is the average IQ of undergraduate students? According to a widespread belief, the average IQ of university students is somewhere between 115 to 130, that is, substantially higher than the average IQ of the general population (M = 100, SD =15). For example, in a series of widely cited articles on intelligence, life chances, and occupational success, Gottfredson [1–4] maintained that undergraduate students’ IQ (labeled “College Format” IQ in her papers) ranged from 112 to 120. Figure 1 is an adaptation of the figures published in several of Gottfredson’s articles. The figure shows the bell curve symmetrical distribution of IQ scores, with a mean of 100 and a standard deviation of 15, with “life chances”, “training potential”, and “career potential” marked within the figure. Similarly, in Assessing Adolescent and Adult Intelligence, Kaufman and Lichtenberger [7] wrote that college graduates’ average IQ is 115 (see p. 16, Figure 1.1), citing as sources of this information Matarazzo ([8], p. 178); Jensen ([9], p. 113); and Reynolds et al. [10]. Kaufman and Lichtenberger [7] also cite Heaton et al. [11], unpublished manuscript, to claim that college graduates’ mean IQ on the Wechsler Adult Intelligence Scale III (WAIS-III) standardization sample was 116.8. (p. 115). More recently, in the classic text Neuropsychological Assessment, Lezak et al. [12] wrote that “the average college graduate typically scores one to two standard deviations [115 to 130 IQ points] above the general population mean on tests of this type [vocabulary tests]” (p. 167), citing Anastasi [13] as the source of this information. Not surprisingly, the notion that undergraduate students’ IQ is substantially higher than that of general population found its way into popular magazines. For example, Scientific American published an article by Gottfredson [2] with a version of Figure 1 included and the “college format” having an IQ in the range of 112 to 120. More recently, Henderson [14], wrote, in Psychology Today, that “the average IQ of a college graduate is about 114.”

In this article, we first examine the origins of this belief of brilliant undergraduate students. Second, we critically review the existing evidence demonstrating that this belief is a myth - a fairy tale from a bygone era that only a few still living remember. Third, we report a new study that examined changes in undergraduate students IQs from 1940s to present. Fourth, we discuss wide-ranging implications of our findings as well as the disastrous consequences of believing the fairy tales of very smart undergraduate students.
The origins of the belief of brilliant undergraduate students
What is the origin of this belief of brilliant undergraduate students? Careful examination of data cited in support of this belief shows that the data is (a) obsolete, collected decades or nearly a century ago, (b) often not representative of general nor specific populations, (c) often collected under unknown conditions and circumstances, and (d) often so poorly described that the very basic characteristics of samples cannot be established. For example, Gottfredson [1] cited data from the Wonderlic Personnel Test (WPT) [6] – a 20 minute, 50 item long multiple choice test – to support her strong claims about the relationship between IQ and life chances, training style, career potential, as well as her claim that IQ of undergraduate students ranges from 112 to 120. Wonderlic [6] itself states that the “mean score for college freshmen” is WAIS IQ 115 or WPT 24 and that “college graduate mean [WAIS] IQ [is] 120” or WPT 29 (see p. 26). However, within Wonderlic’s [6] sample, college graduates’ IQ actually ranged from 80 to over 146 WAIS IQ points (see Wonderlic [6], p. 25, for a range of WPT scores and p. 20 for translation of WPT scores to WAIS Full Scale IQ (FSIQ). Most critically, Wonderlic’s [6] “norms” (p. 25) and specific occupation norms (p. 27) are actually not norms at all; they are scores of some job applicants somewhere, assessed under unknown circumstances, and assessed by unknown assessors. Examinees were never sampled to match any population census data, were not tested under standardized conditions, and nearly nothing is known about the examinees themselves. In fact, Wonderlic [6] indicates that the scores were reported back to Wonderlic Personnel Test Inc. by various companies that decided to use WPT to examine job applicants. For example, “Teacher” norms with a mean WPT of 26 or WAIS FSIQ of 113 were reported back by ten unknown companies and reflected scores of 500 applicants for some unspecified teaching jobs (see p. 27). No other information was provided about these teaching job applicants, including their age, education level, or primary teaching assignments (e.g., early childhood, elementary, secondary/high school, college).
Similarly, Matarazzo [8], Kaufman and Lichtenberger’s [7] first source, states that the WAIS IQ of college graduates is 115 (see Table 7.3 in Matarazzo [8]) and informs that the data in the table “is based on our own clinical experience and should provide the interested reader with data for a good working rule of thumb [emphasis added]” (p. 178). Jensen [9], Kaufman and Lichtenberger’s [7] second source, states that the mean IQ of college graduates is 120 and the mean IQ of “freshmen in typical four-year college” is 115 and states that these estimates were “compiled by Cronbach ([15], p. 174)”. In turn, Cronbach [15] cites several sources published between 1930 and 1958, including a review of previously published studies by Plant and Richardson [16] who concluded that an average college students’ Wechsler-Bellevue Intelligence Scale (WBIS) [17] FSIQ is 120, and the average college freshmen WBIS FSIQ is 116 (p. 230). Reynold et al. [10], Kaufman and Lichtenberger’s [7] third source, gives the mean WAIS-R FSIQ of college graduates (i.e., individuals with 16 or more years of education, including those with MA and PhD degrees) as 115.17 based on 244 adults of all ages with at least that level of education in WAIS-R [18] normative sample (tested in 1980). Heaton et al. [11], Kaufman and Lichtemberger’s [7] source for WAIS-III FSIQ of college graduates being 116.8, could not be examined as it was not published. However, Longman et al. [19] analysis of the same WAIS-III normative sample showed that college graduates, that is, those with 16 or more years of education, had the mean WAIS-III FSIQ of only 111.6 (p. 429). Finally, Lezak et al.’s [12] only citation is Anastasi [13], also an ancient text.
Major reasons why undergraduate students’ IQ cannot be as high as 115 or even higher
There are three major reasons why undergraduate students’ average IQ today cannot be 115 or even higher as estimated by obsolete data collected 70 or 80 years ago: generational increases in intelligence called Flynn Effect, massive increases in educational attainment, and structure of WAIS normative data.
Flynn Effect
IQ scores have been rising at a rate of 0.3 per year or 3 IQ points per decade [20–22]. As a result, an examinee scoring 115 on an intelligence test normed in 1950 would score only 93 on an intelligence test normed in 2022. Flynn Effect is observed in successive versions of perhaps one of the most commonly used intelligence tests – WAIS and its predecessor WBIS. The WBIS sample was “mostly urban from the City and State of New York” and exclusively Caucasian, and thus, not representative of the US population [17], whereas WAIS versions samples were designed to be representative of the US population [5,18,23,24].
Table 1 shows the mean Verbal IQ (VIQ), Verbal Comprehension Index (VCI), Performance IQ (PIQ), Perceptual Reasoning Index (PRI), and FSIQ scores of three samples of examinees, each completing two temporally adjacent versions of WAIS, the IQ differences between the two adjacent WAIS versions, and the overall cumulative difference between the WAIS and WAIS-IV mean IQ. Over 53 years between WAIS-IV and WAIS, FSIQ increased by 13.3 points or 0.25 per year. Thus, if an average teacher’s WAIS FSIQ was truly 113, as Wonderlic [6] claimed, this same average teacher would be expected to score only 99.7 points when assessed by the more recently normed and up-to-date WAIS-IV. Using 0.3 IQ points per year – an estimate based on a much larger set of studies – this same average teacher would be expected to score only 97.1.
VIQ/VCI, PIQ/PRI, and FSIQ scores of three samples, each tested with two successive versions of Wechsler Adult Intelligence Scales (US Editions).
| WAIS-IV | WAIS-III | Δ | WAIS-III | WAIS-R | Δ | WAIS-R | WAIS | Δ | Cumulative Δ | |
|---|---|---|---|---|---|---|---|---|---|---|
| VIQ/VCI | 100.1 | 102.8 | −2.7 | 102.2 | 103.4 | −1.2 | 101.8 | 108.7 | −6.9 | −10.8 |
| PIQ/PRI | 100.3 | 102.5 | −2.2 | 103.5 | 108.3 | −4.8 | 105.4 | 113.4 | −8.0 | −15.0 |
| FSIQ | 100.0 | 102.9 | −2.9 | 102.9 | 105.8 | −2.9 | 103.8 | 111.3 | −7.5 | −13.3 |
Simply put, the Flynn Effect makes it clear that it is unwarranted and patently wrong to use decades-old IQ data to make claims about the IQ of populations, samples, or individuals today. It is also unwarranted and patently wrong to compare the IQ scores obtained by samples or individuals on today’s intelligence tests to outdated IQ data on tests normed decades or nearly a century ago.
Fletcher et al. [20] put this succinctly:
We would not expect pediatricians to use a height/weight chart from another country or century to assess a child’s percentile rank in height or weight; if they did, we would expect corrections so that the percentile reflects the current, national distribution. Correcting an IQ score is a simple procedure that avoids having to change standards. Thus, if 15-year-old IQ norms are used, either the score itself must be corrected by about 4.5 points (0.3 × 15 years = 4.5) or the cut-point for ID [intellectual disability] needs to be corrected to 74.5 because the mean IQ of a contemporary sample using the old norms would be 104.5.
As Fletcher pointed out, if one wants to use obsolete norms for any reason, at the very least, one must adjust either the score or the norms for Flynn Effect. Trahan et al. [22] concurs that “the need to correct IQ test scores for norms obsolescence in high-stakes decision making is abundantly clear” and “especially important when IQ test scores are compared across a broad period of time…” (p. 1352). Unfortunately, these necessary adjustments to the college students’ IQ “norms” were not reported nor considered in Gottfredson [1,2,4] or Kaufman and Lichtenberger [7].
Furthermore, it has been argued that a failure to adjust obsolete test scores or norms for Flynn Effect is unscientific, unethical, and malpractice [20,25–27]. For example, Gresham and Reschly [26] observed that “failure to account for the Flynn Effect in test score interpretation in Atkins or any other cases is a violation” of Principle 9.08 Obsolete Tests and Outdated Test Results of the Ethical Principles of Psychologists and Code of Conduct stating, in part: “(B) Psychologists do not base such decisions or recommendations on tests and measures that are obsolete and not useful for the current purpose.”
Similarly, Reynolds et al. [27] concluded (p. 480):
Increases in Educational Attainment
The proportion of the population enrolling in and graduating with university degrees has been increasing steeply since at least 1940 [28]. Figure 2 shows the proportion of the US population, aged 25 years and older, who completed high school, 1 to 3 years of college, and attained four or more years of college (i.e., the college graduates), from 1940 to 2021. Percentages of individuals with high school increased from 24.1 to 91.1, with 1 to 3 years of college from 10.0 to 63.2, and with four or more years of college from 4.6 to 37.9.
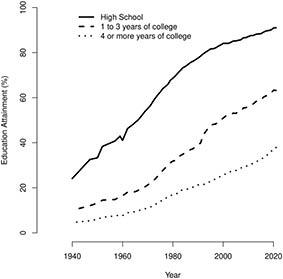
Increases in educational attainment in USA for adults 25 years or older, from 1940 to 2021 [28].
Basic laws of mathematics dictate that college students’ and college graduates’ IQs must have declined substantially over the last 80 years. For example, if 80% of the population pursues undergraduate education and if they were to have an average IQ of 115, the remaining 20% of the population would have to have an average IQ of only 40 to maintain the average IQ of the entire population at 100. Obviously, this is impossible given the normal distribution of IQ scores, and accordingly, the average IQ has to decline as greater and greater proportion of population pursues undergraduate education. In fact, the IQ of college students did decline substantially. Table 2 shows FSIQ by years of education for normative samples of WAIS-R (normed between 1976 and 1980 or in 1978 on average), WAIS-III (normed in 1996), and WAIS-IV (normed from March 2007 to April 2008 or, taking a midpoint, in 2007). Over 29 years, the FSIQ of college graduates (i.e., 16 or more years of education) dropped from 115.3 to 107.4, or 0.27 IQ points per year. Similarly, the IQ of examinees with some college education (1 to 3 years) who did not (yet) graduate dropped from 107.4 to 101.4. Finally, the IQ of examinees who attended at least some college (i.e., 13 years of education or more) dropped to FSIQ 104.5 by the 2008 standardization of WAIS-IV. WAIS normative sample data confirm that college students’ and college graduates’ IQs have dropped far below the levels they once were and suggests that college students’ and graduates’ IQs today are not appreciably different from the average IQ of the entire population.
Mean FSIQ (with SDs in parentheses) by years of education for WAIS-R, WAIS-III, and WAIS-IV US Edition normative samples and WAIS-III CDN Edition normative samples.
| WAIS | Year | 0–7 | 8 | 8 or less | 9–11 | 12 | 13–15 | 16 | 17–18 | >18 | 16+ |
|---|---|---|---|---|---|---|---|---|---|---|---|
| US Edition | |||||||||||
| WAIS-R | 1981 | 82.2 (13.6) n = 133 | 90.7 (12.0) n = 158 | 96.4 (14.3) n = 472 | 100.1 (12.6) n = 652 | 107.4 (11.1) n = 251 | 115.3 (12.2) n = 214 | ||||
| WAIS-III | 1997 | 85.8 (15.1) n = 284 | 91.2 (12.6) n = 289 | 99.2 (12.8) n = 853 | 103.6 (12.3) n = 579 | 111.6 (13.2) n = 445 | |||||
| WAIS-IV | 2008 | 82 (12.6) n = 220 | 86.4 (13.8) n = 243 | 96.2 (13.7) n = 647 | 101.4 (13.1) n = 553 | 107.1 (14.0) n = 267 | 107.1 (14.0) n = 297 | 111.7 (12.5) n = 43 | 107.4 (13.9) n = 607 | ||
| CND Edition | |||||||||||
| WAIS-III | 1997 | 97.3 (13.9) n = 90 | 98.6 (15.2) n = 204 | 100.2 (15.5) n = 177 | 103.8 (13.7) n = 387 | 108.7 (14.3) n = 242 | |||||
Figure 3 shows the IQ ranges for the college graduates (i.e., individuals with 16+ years of education) and the individuals with some college education (i.e., 13–15 years of education within WAIS-R, WAIS-III, and WAIS-IV normative samples). For WAIS-IV, the most recent version of the Wechsler test, the normative sample data indicate that the IQ of the middle 95% of the college graduates (i.e., individuals with 16+ years of education) ranges from 80 to 135 (M = 107.4, SD = 13.9), and that IQ of the middle 95% of the individuals with some college education (i.e., 13–15 years of education) ranges from 76 to 127 (M = 101.4, SD = 13.1). Clearly, according to WAIS-IV normative sample data, the college graduates and individuals with some college education today (or more precisely in 2007) are, on average, merely average. Only minority of students are scoring above 110 IQ points, and are in Gottfredson’s “Out Ahead” or undergraduate students’ IQ category. Equally clearly, undergraduate students’ and graduates’ IQ today cannot be what it used to be 70 to 100 years ago.

Structure of WAIS Normative Data Analyses
The WAIS normative data overestimate the average IQ of today’s college students and graduates because many of the examinees included in normative samples attended colleges and/or graduated from colleges decades ago (i.e., when colleges and universities were far more selective and when average IQs of college students were much higher). Accordingly, we would expect that the average WAIS-IV FSIQ of undergraduate students (students with 13 or more years of education) as well as fresh college graduates (students with 16 or more years of education) is still lower than 104.5 and 107.4, respectively, and is close to 100.
The undergraduate students IQ differ across universities and fields
College admission test scores, closely related to IQ scores, show that undergraduate students’ average intelligence varies hugely with at least two other factors. First, undergraduate students’ average intelligence varies hugely with the field of study. Figure 4 shows College Board average SAT ERW (Evidence-Based Reading and Writing) and Math scores for the 2021 high school graduates who took the SAT during high school by intended college major [31]. The overall ERW and Math means of SAT users were 533 (SD = 108) and 528 (SD = 120), respectively (the two means are indicated by dotted lines). The figure shows that fields such as “Education” and “Public Administration and Social Services” are below the mean on both ERW and Math. In contrast, fields such as “Mathematics and Statistics” and “Physical Sciences” are approximately 1 SD (equivalent to about 15 IQ points) above the mean on both ERW and Math. Notably, College Board also provided SAT scores for Nationally Representative Sample [32]. The Nationally Representative Sample, that is, the sample of all high school students rather than only those who typically take the SAT, averaged 507 on ERW and 506 on Math (the two means are indicated by dashed lines), and 1010 on SAT Total. Using the Nationally Representative Sample, the difference between, for example, Education vs. Mathematic and Statistics, using the IQ scale, is over 16 IQ points (Education SAT Total 101.6 vs. Mathematic and Statistics SAT Total 117.9).
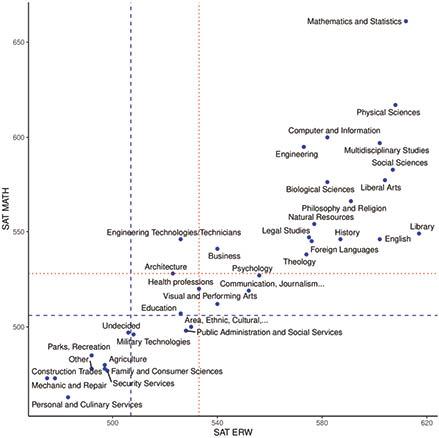
Mean SAT ERW and Math scores for the 2021 high school graduates who took SAT during high school by intended college major SAT.
Similarly, Figure 5 shows Educational Testing Service (ETS) average Graduate Record Exam (GRE) Verbal and Quantitative scores by the intended broad graduate major field for individuals tested between July 1, 2017 and June 2020 [33]. The overall GRE Verbal mean was 150.37 (SD = 8.59) and GRE Quantitative was 153.66 (SD = 9.44) based on over 1.5 million test takers (the two means are indicated by dotted lines). GRE data confirm large differences between the fields. For example, Education/Early Childhood means are approximately 1 SD or more below Physics and Astronomy on both GRE Quantitative and GRE Verbal. Large differences exist even within fields. For example, Education/Early Childhood means are approximately 0.5 and 1 SD below Education/Secondary on GRE Quantitative and GRE Verbal, respectively.
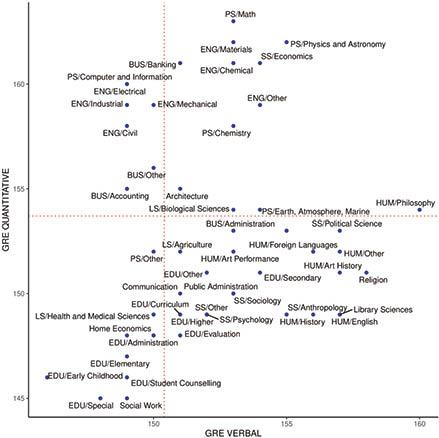
Mean GRE Verbal and Quantitative scores by intended broad graduate major field for individuals tested between 2017 and 2020.
Second, undergraduate students’ IQs also vary hugely depending on which university students are or were attending. Currently, there are over 6,000 2+ and 4 years colleges and universities in US. Some colleges and universities have open admission policies, in essence admitting anyone who graduated from high school and applied. Other colleges and universities are very selective and take only a few top percent of those who dare to apply. Importantly, approximately 2,000 US colleges and universities are included in the Integrated Postsecondary Education Data System (IPEDS). The IPEDS data are available from US National Center for Education Statistics (https://nces.ed.gov/ipeds) and include 25th and 75th percentile scores for SAT and ACT of admitted students, the number of students who applied, and the number of admitted students, allowing determination of each institutions’ admission rate. Because the data file does not include the mean nor median SAT or ACT scores, the mean was estimated by taking the midpoint between the 25th and 75th percentiles. Figure 6 shows the IPEDS data from the 2020–21 admission data file. Figure 6 top left panel shows the relationship between the means SAT Math and SAT ERW scores of admitted students, r(1082) = .95, p < .001. Figure 6 top right panel shows the relationship between the means of SAT Total and ACT Composite scores of admitted students, r(1059) = .96, p < .001. Figure 6 bottom left panel shows the relationship between admission rate and SAT Total of admitted students, r(1082) = −.51, p < .001. California Institute of Technology students have the highest SAT Total (M = 1555) and the admission rate is only 6.7%. Figure 6 bottom right panel shows the distribution of SAT Total means of admitted students – the solid vertical line represents the mean SAT Total of the Nationally Representative Sample (i.e., the sample of test takers with a presumed mean IQ of 100), and the dashed vertical lines indicate ± 1 SD. This panel shows that undergraduate students in a large proportion of these institutions have mean IQ of less than 100.

The IPEDS data for US colleges and universities. Top left panel shows the relationship between the means SAT Math and SAT ERW scores of admitted students. Top right panel shows the relationship between the means of SAT Total and ACT Composite scores of admitted students. Bottom left panel shows the relationship between admission rate and SAT Total of admitted students. Bottom right panel shows the distribution of SAT Total means of admitted students – the solid vertical line represents the mean SAT Total of the Nationally Representative Sample and dashed vertical lines indicate ± 1 SD.
One may argue that SAT, ACT, and GRE do not measure intelligence but rather achievement. However, numerous studies have established that SAT, ACT, and GRE are all good measures of intelligence and are widely used as intelligence measures; they are highly intercorrelated [34], highly correlated with various intelligence tests including various Wechsler tests [35–39], employ similar test items as intelligence tests [37], and depend on the same underlying cognitive processes. The SAT itself is based on the Army Alpha and Beta tests and the Binet’ intelligence tests [37]. A number of researchers proposed that measures such as SAT can be used as measures of pre-morbid IQ and developed regression equations predicting Wechsler FSIQs [36,37].
Rationale and objectives of current study
The above review of previously published analyses of Wechsler Intelligence Tests normative samples’ IQs indicates that the IQ of undergraduate students and university graduates today has declined to near the general population IQ of 100.
However, this evidence has several limitations. First, Wechsler normative samples describe FSIQs of examinees with 13 to 15 years of education (1 to 3 years of college or university) and 16+ years of education (university graduates, including those with MA and PhD degrees) for all adults, including those who obtained the specified level of education decades ago when only a few adults went to study to colleges and universities. Accordingly, the mean IQ of undergraduate students at any given time is likely lower than the mean IQ of all adults with the equivalent level of educational attainment. Second, the last Wechsler test was normed in 2007, some 15 years ago. Given that the proportion of the eligible population going on to pursue college and university-level education has continued to rise, the mean IQ of undergraduate students has likely continued to decline. Third, Wechsler’s normative samples are too limited to provide any insight into how much the mean IQs of undergraduate students vary across universities. The SAT (and ACT) data indicate that the range between the least and the most selective universities exceeds three standard deviations, the equivalent of 45 IQ points (see Figure 6). Accordingly, it is likely that the mean IQ of undergraduate students varies substantially across the universities and correlates with the mean SATs of admitted students. Finally, it is largely unknown how Wechsler normative samples were recruited.
Therefore, independent evidence of the decline of the IQ of undergraduate students is both necessary and valuable to address some of the limitations detailed above and to examine the decline in undergraduate students’ IQ using different and more robust methodology. The main objective of the present study is to conduct a meta-analysis of the mean IQ scores of college and university student samples tested with Wechsler intelligence tests (WBIS, WAIS, WAIS-R, WAIS-III, WAIS-IV) reported in the literature in order to answer the following questions: First, what is the average IQ of undergraduate students today? Second, how much did undergraduate students’ IQ decline since the 1940s (since the publication of the WBIS, the first Wechsler Intelligence test)? Third, how much does mean undergraduate students’ IQ vary across the universities? Fourth, does the mean undergraduate students’ IQ correlate with the mean SAT scores of admitted students, even if these mean SAT scores were not obtained at the same time as the mean Wechsler IQs?
METHOD
Inclusion and exclusion criteria
In order for a study to be included in the meta-analysis, it had to meet a set of inclusion criteria. First, the study had to report, at minimum, one of the intelligence scales or index scores (i.e., FSIQ, VIQ, PIQ, VCI, PRI, WMI, PSI). Second, the study had to use either US or Canadian WAIS versions (i.e., WBIS, WAIS, WAIS-R, WAIS-III, WAIS-IV). Third, examinees had to be tested either in Canada or USA. Fourth, examinees had to be primarily undergraduate students (we allowed a mix of undergraduate and graduate students as long as the majority of students in a sample were undergraduate students). Fifth, samples of students had to be broadly representative of typical undergraduate students. Accordingly, the samples of students selected for specific medical conditions or learning disabilities were excluded. Finally, in the case of studies that used repeated administration of the same test, we used first administration only.
Search for relevant studies
Figure 7 shows the PRISMA flowchart describing the search and selection of relevant undergraduate student samples. First, the APA PsycInfo, ERIC, and MEDLINE databases were searched concurrently from the earliest available date to the end of December 31, 2022. Using the “Find all my search terms”, “apply equivalent subjects” tool, and search “All text”. The terms searched were: (a) WAIS OR “Wechsler Adult” OR (Wechsler AND Bellevue), (b) university OR college OR undergraduate*, and (c) student*. Next, the three search results were combined with AND. The search identified 1,666 potentially relevant articles, chapters, dissertations, and other reports. The full text of all these potentially relevant articles was examined and 84 data sets meeting inclusion and exclusion criteria were identified. Second, the full text of all referenced articles listed in Table 2 of Sparks and Lovett [40] was examined, and seven additional data sets meeting inclusion and exclusion criteria were identified. Third, the full text of references located in all relevant articles and book chapters, retrieved by any method, were examined, and an additional 15 data sets meeting inclusion and exclusion criteria were identified. In total, the search yielded 106 samples meeting the inclusion and exclusion criteria.

Recorded variables and statistical analyses
For each study, we coded author, year of publication, publication type (e.g., journal, dissertation, report), country, university affiliation, year(s) participants were tested, the university the participants were from, Wechsler test version, number of participants, number of males and females, mean age, and means and standard deviations for intelligence scale and index scores (FSIQ, VIQ, PIQ, VCI, PRI, WMI, PSI).
If a study did not report FSIQ, the FSIQ was estimated from VIQ or VCI using regression imputation methods (see below). To obtain FSIQ adjusted for the Flynn Effect, 0.3 IQ points/year were substracted from reported FSIQ for each year that elapsed between the standardization year and the year of testing examinees in each sample. The standardization years used for Wechsler test versions were as follows: 1938 for WBIS [17], 1954 for WAIS [5], 1980 for WAIS-R [18], 1996 for WAIS-III [23], and 2007 for WAIS-IV [24]. If the year of testing was not reported, it was estimated by subtracting two years from the publication year. If the year of testing was reported as a range of years, the midpoint of the range was taken as the estimated year of testing.
All statistical analyses were conducted using R statistical software [41] including the metafor package [42].
RESULTS
The meta-analysis included 106 samples of undergraduate students representing 9,902 students in total, with the following number of students tested in each ten year period: 1,486 in 1939–1949; 1,462 in 1950–1959; 1,938 in 1960–1969; 635 in 1970–1979, 1,848 in 1980–1989; 1,025 in 1990–1999, 1,083 in 2000–2009, and 425 in 2010–2019. There were 102 samples from the USA and four samples from Canada. The meta-analysis included 18 WBIS samples, 28 WAIS samples, 40 WAIS-R samples, 17 WAIS-III samples, and 3 WAIS-IV samples. FSIQ was reported for 100 out of 106 samples and was estimated from VIQ for 5 samples and from VCI for 1 sample by regression imputation methods. The correlation between FSIQ and VIQ means was r(63) = .974, and FSIQ for the five samples was estimated using the equation: FSIQ = 4.967 + .963 * VIQ. The correlation between FSIQ and VCI means was r(3) = .981, and the FSIQ for one sample was estimated using the equation: FSIQ = 25.185 + .772 * VCI (note that VCI was rarely reported).
Table 3 shows descriptive information for each of the 106 undergraduate student samples. The table includes the first author, publication year, affiliation of the first author or university from which each sample was drawn, estimated year of WAIS test administration, estimated median SAT of admitted students in 2021, Wechsler test version, number of students, VIQ mean, VCI mean, FSIQ mean and standard deviation, FSIQ mean and standard deviations with imputations to replace missing values (see above), and Flynn Effect adjusted FSIQ.
Descriptive data for each of the 106 undergraduate student samples included in the meta-analysis.
| First author, year | Affiliation/University | Year | SAT Mdn | Test | N | VIQ M | VCI M | FSIQ M | FSIQ SD | FSIQ Imp. M | FSIQ Imp. SD | FSIQ Adj. M |
|---|---|---|---|---|---|---|---|---|---|---|---|---|
| Aaron, 1985 [43] | Indiana State U | 1983 | WAIS-R | 5 | 114.4 | 115 | 9.2 | 115 | 9.2 | 114.1 | ||
| Abell, 1994 [44] | Loyola U of Chicago | 1992 | 1230 | WAIS-R | 101 | 110 | 111 | 12.2 | 111 | 12.2 | 107.4 | |
| Acklin, 1989 [45] | The Queen’s Medical Center Honolulu | 1987 | WAIS-R | 125 | 109.6 | 109.2 | 11.3 | 109.2 | 11.3 | 107.2 | ||
| Advokat, 2007 [46] | Louisiana State U | 2005 | 1195 | WAIS-III | 30 | 108.7 | 9.2 | 108.7 | 9.2 | 106 | ||
| Allen, 1954 [47] | U of Miami | 1952 | 1335 | WBIS | 49 | 123 | 7.3 | 123 | 7.3 | 118.8 | ||
| Allen, 1992 [48] | U of Mississippi | 1990 | 1120 | WAIS | 50 | 103.3 | 103.6 | 14.3 | 103.6 | 14.3 | 92.8 | |
| Anderson, 1942 [49] | Wilson College | 1940 | 1020 | WBIS | 112 | 118.5 | 7.2 | 118.5 | 7.2 | 117.9 | ||
| Axelrod, 1997 [50] | Urban Commuter U | 1995 | WAIS-R | 65 | 100.9 | 10.8 | 100.9 | 10.8 | 96.4 | |||
| Bass, 1985 [51] | Towson State U | 1983 | 1120 | WAIS | 60 | 112.1 | 111.6 | 7.3 | 111.6 | 7.3 | 102.9 | |
| Beaujean, 2006 [52] | U of Missouri | 2004 | 1215 | WAIS-III | 25 | 112 | 112 | 10 | 109.6 | |||
| Beers, 1994 [53] | Highlands Drive Veterans Administration Medical Center | 1992 | WAIS-R | 22 | 102.5 | 104.5 | 11.4 | 104.5 | 11.4 | 100.9 | ||
| Beglinger, 2000 [54] | U of Idaho | 1998 | 1105 | WAIS-R | 50 | 111.6 | 113.8 | 9.6 | 113.8 | 9.6 | 108.4 | |
| Bell, 2001 [55] | The Citadel | 1999 | 1120 | WAIS-III | 40 | 116.4 | 117.2 | 115.4 | 9.9 | 115.4 | 9.9 | 114.5 |
| Birch, 2004 [56] | College At Brockport | 2002 | 1080 | WAIS-R | 13 | 113.6 | 111.4 | 9.1 | 111.4 | 9.1 | 104.8 | |
| Birch, 2016 [57] | College At Brockport | 2014 | 1080 | WAIS-R | 16 | 117.1 | 117.1 | 8.3 | 117.1 | 8.3 | 106.9 | |
| Bishop, 1990 [58] | U of Southern Mississippi | 1988 | WAIS-R | 60 | 106.8 | 16.3 | 106.8 | 16.3 | 104.4 | |||
| *Boer, 1988 [59] | Concordia College | 1986 | WAIS-R | 20 | 111 | 13 | 111 | 13 | 109.2 | |||
| Buchsbaum, 1985 [60] | U of California | 1983 | 1330 | WAIS | 38 | 115.2 | 114.8 | 114.8 | 10 | 106.1 | ||
| Burris, 1983 [61] | Western Kentucky U | 1981 | 1080 | WAIS-R | 60 | 110.5 | 110.1 | 11.8 | 110.1 | 11.8 | 109.8 | |
| Calvin, 1955 [62] | Michigan State U | 1953 | 1200 | WBIS | 36 | 122.8 | 9.2 | 122.8 | 9.2 | 118.2 | ||
| Cannon, 2006 [63] | U of Tennessee | 2004 | 1221.5 | WAIS-III | 8 | 124 | 6.8 | 124 | 6.8 | 121.6 | ||
| Cannon, 2009 [64] | U of Tennessee | 2007 | 1221.5 | WAIS-III | 14 | 117.6 | 10.2 | 117.6 | 10.2 | 114.3 | ||
| Carson, 2005 [65] | Harward U | 2003 | 1520 | WAIS-R | 184 | 129.4 | 10.9 | 129.4 | 10.9 | 122.5 | ||
| Carvajal, 1987 [66] | Emporia State U | 1986 | WAIS-R | 32 | 99.3 | 103.5 | 10.9 | 103.5 | 10.9 | 101.7 | ||
| Carvajal, 1991 [67] | Emporia State U | 1988 | WAIS-R | 31 | 106.4 | 12.4 | 106.4 | 12.4 | 104 | |||
| Carvajal, 1996 [68] | Emporia State U | 1994 | WAIS-R | 44 | 106.3 | 109 | 12.2 | 109 | 12.2 | 104.8 | ||
| Clifford, 2004 [69] | Villanova U | 2002 | 1390 | WAIS-III | 105 | 100 | 100 | 10 | 98.2 | |||
| Clifford, 2004 [69] | Villanova U | 2002 | 1390 | WAIS-III | 101 | 110.7 | 7.7 | 110.7 | 7.7 | 108.9 | ||
| Cole, 1956 [70] | Occidental College | 1954 | 1365 | WBIS | 46 | 125 | 127 | 127 | 10 | 122.2 | ||
| Conry, 1965 [71] | San Jose State College | 1963 | 1125 | WAIS | 335 | 115.1 | 114.8 | 8 | 114.8 | 8 | 112.1 | |
| Cosden, 1997 [72] | U of California | 1995 | 1345 | WAIS-R | 50 | 121.3 | 8 | 121.3 | 8 | 116.8 | ||
| *Crawford, 1985 [73] | U of Alberta | 1983 | WAIS-R | 38 | 110.5 | 110.4 | 11.7 | 110.4 | 11.7 | 109.5 | ||
| Davis, 2016 [74] | Ball State U | 2014 | WAIS-III | 41 | 110.4 | 111.1 | 9.4 | 111.1 | 9.4 | 105.7 | ||
| Dennis, 1978 [75] | Western Kentucky U | 1975 | 1080 | WAIS | 310 | 113.2 | 112.4 | 10.1 | 112.4 | 10.1 | 106.1 | |
| Detterman, 1992 [76] | Case Western Reserve U | 1990 | 1430 | WAIS-R | 20 | 115.6 | 7.8 | 115.6 | 7.8 | 112.6 | ||
| Dodd, 2000 [77] | U of North Dakota/Indiana U-Purdue University | 1998 | 1115 | WAIS-R | 100 | 101.8 | 9.4 | 101.8 | 9.4 | 96.4 | ||
| Ducheneaux, 1999 [78] | Und & Oglala Lakota College | 1997 | 1115 | WAIS-III | 48 | 99.7 | 99.8 | 102.1 | 102.1 | 10 | 101.8 | |
| Dymond, 1950 [79] | Mount Holyoke College | 1948 | 1385 | WBIS | 13 | 129.3 | 129 | 129 | 10 | 126 | ||
| Estes, 1946 [80] | Harvard U | 1944 | 1520 | WBIS | 102 | 128 | 127 | 127 | 10 | 125.2 | ||
| Faber, 2021 [81] | Roosevelt U | 2019 | 1015 | WAIS-IV | 25 | 100.1 | 105.4 | 10 | 101.8 | |||
| Feldman, 1968 [82] | Northern Illinois U | 1966 | WAIS | 56 | 123 | 121 | 6.5 | 121 | 6.5 | 117.4 | ||
| Fishbein, 1941 [83] | Temple U | 1939 | WBIS | 125 | 119.5 | 8.4 | 119.5 | 8.4 | 119.2 | |||
| Gajar, 1989 [84] | Penn State | 1987 | 1185 | WAIS-R | 33 | 117.7 | 117.7 | 9 | 117.7 | 9 | 115.6 | |
| Geiselman, 1983 [85] | U of California LA | 1981 | WAIS | 16 | 113.4 | 114.2 | 10 | 106.1 | ||||
| Gerberth, 1950 [86] | Washington U | 1948 | 1115 | WBIS | 50 | 125.6 | 7.6 | 125.6 | 7.6 | 122.6 | ||
| Gooding, 2004 [87] | U of Wisconsin-Madison | 2002 | 1360 | WAIS-R | 45 | 120.2 | 11.1 | 120.2 | 11.1 | 113.6 | ||
| Gregg, 2005 [88] | U of Georgia | 2003 | 1355 | WAIS-III | 100 | 118.1 | 13.2 | 118.1 | 13.2 | 116 | ||
| Gregg, 2008 [89] | U of Georgia | 2006 | 1355 | WAIS-III | 144 | 113.8 | 113.2 | 11.5 | 113.2 | 11.5 | 110.2 | |
| Hanna, 1968 [90] | U of Alaska | 1965 | 1160 | WAIS | 30 | 120.8 | 10.5 | 120.8 | 10.5 | 117.5 | ||
| Harrell, 2020 [91] | 2018 | WAIS-IV | 276 | 102.3 | 102.3 | 10 | 99 | |||||
| Harwood, 1967 [92] | Marshall U | 1965 | 1042.5 | WAIS | 28 | 109.2 | 109 | 109 | 10 | 105.7 | ||
| Hopper, 2000 [93] | George Fox U | 1998 | 1125 | WAIS-III | 46 | 116 | 116.7 | 10 | 116.1 | |||
| Ickes, 1992 [94] | Kent State U | 1989 | 1115 | WAIS-R | 95 | 101.2 | 101.2 | 9.9 | 101.2 | 9.9 | 98.5 | |
| Kelley, 1992 [95] | U of Maryland | 1990 | 1375 | WAIS | 40 | 111.8 | 14.6 | 111.8 | 14.6 | 101 | ||
| Kramar, 1955 [96] | Florida State U | 1953.5 | 1285 | WBIS | 196 | 113.5 | 114.6 | 8.7 | 114.6 | 8.7 | 110 | |
| Ladd, 1950 [97] | Indiana U/Indiana State Teachers College | 1949 | 1030 | WBIS | 190 | 119.8 | 121.7 | 6.3 | 121.7 | 6.3 | 118.4 | |
| Lassiter, 2001 [98] | The Citadel Military College | 1999 | 1120 | WAIS-III | 60 | 112.7 | 113.1 | 111.5 | 11.2 | 111.5 | 11.2 | 110.6 |
| Lewis, 1985 [99] | Illinois State U | 1981 | 1120 | WAIS-R | 50 | 101.8 | 102 | 102 | 10 | 101.7 | ||
| Lewis, 1985 [99] | Illinois State U | 1980 | 1120 | WAIS | 53 | 109.9 | 112 | 112 | 10 | 104.2 | ||
| *Lott, 1952 [100] | U of Alberta * | 1950 | WBIS | 85 | 126.7 | 127 | 6.6 | 127 | 6.6 | 123.4 | ||
| Mcgee, 1984 [101] | Idaho State U | 1978 | WAIS | 129 | 113.5 | 114.3 | 10 | 107.1 | ||||
| Mefferd, 1979 [102] | VA Medical Centre Houston | 1977 | WAIS | 100 | 118.2 | 118.8 | 10 | 111.9 | ||||
| Menary, 1985 [103] | Michigan State U | 1982 | 1200 | WAIS | 105 | 112.2 | 10.3 | 112.2 | 10.3 | 103.8 | ||
| Merrill, 1952 [104] | U of Washington | 1949 | 1326.5 | WBIS | 730 | 121.7 | 8.2 | 121.7 | 8.2 | 118.4 | ||
| Merrill, 1953 [105] | U of Washington | 1951 | 1326.5 | WBIS | 248 | 117.7 | 120.1 | 8.6 | 120.1 | 8.6 | 116.2 | |
| Mishra, 1982 [106] | U of Arizona | 1981 | 1220 | WAIS-R | 88 | 113.9 | 115.6 | 16.3 | 115.6 | 16.3 | 115.3 | |
| Mishra, 1982 [106] | U of Arizona | 1981 | 1220 | WAIS | 88 | 119.7 | 120.2 | 14.1 | 120.2 | 14.1 | 112.2 | |
| Morgan, 1997 [107] | U of Georgia | 1995 | 1355 | WAIS-R | 30 | 104.6 | 108.1 | 12.2 | 108.1 | 12.2 | 103.6 | |
| Morris-Friehe, 1992 [108] | U of Nebraska-Lincoln | 1990 | 1215 | WAIS-R | 31 | 103.5 | 101.6 | 7.4 | 101.6 | 7.4 | 98.6 | |
| Mosberg, 1994 [109] | U of Delaware | 1992 | 1240 | WAIS-R | 16 | 109.9 | 109.9 | 10 | 106.3 | |||
| Nobo, 1986 [110] | Washburn U | 1984 | 1085 | WAIS-R | 37 | 96.8 | 11.5 | 96.8 | 11.5 | 95.6 | ||
| O’hora, 2008 [111] | Florida State U | 2006 | 1285 | WAIS-III | 81 | 111.5 | 101.2 | 113 | 16.6 | 113 | 16.6 | 110.0 |
| Olsen, 1964 [112] | Washington State U | 1961 | 1115 | WAIS | 805 | 114 | 114 | 114 | 10 | 111.9 | ||
| Ormrod, 1990 [113] | U of Northern Colorado | 1988 | 1090 | WAIS-R | 41 | 114.4 | 115.2 | 10 | 112.8 | |||
| Paul, 1985 [114] | U of California, Berkeley | 1983 | 1420 | WAIS | 62 | 122.8 | 9.3 | 122.8 | 9.3 | 114.1 | ||
| Pilgrim, 2000 [115] | U of South Dakota | 1998 | 1122.5 | WAIS-III | 100 | 109.8 | 108.6 | 110.9 | 11.1 | 110.9 | 11.1 | 110.3 |
| Plant, 1958 [116] | San Jose State College | 1957 | 1125 | WAIS | 732 | 115.6 | 115.2 | 8.8 | 115.2 | 8.8 | 114.3 | |
| Quereshi, 1985 [117] | Marquette U | 1983 | 1250 | WAIS | 72 | 116.5 | 119.4 | 8 | 119.4 | 8 | 110.7 | |
| Quereshi, 1985 [117] | Marquette U | 1983 | 1250 | WBIS | 72 | 112.4 | 118.5 | 8.7 | 118.5 | 8.7 | 105.0 | |
| Quereshi, 1985 [117 | Marquette U | 1983 | 1250 | WAIS-R | 72 | 113.4 | 115.7 | 9.7 | 115.7 | 9.7 | 114.8 | |
| Rakusin, 1949 [118] | Pennsylvania State College | 1947 | 1185 | WBIS | 80 | 122 | 125.1 | 5.8 | 125.1 | 5.8 | 122.4 | |
| Ratcliff, 2010 [119] | Bryn Mawr College | 2008 | WAIS-III | 45 | 112.1 | 14.2 | 112.1 | 14.2 | 108.5 | |||
| Rossini, 1994 [120] | Roosevelt U | 1992 | 1015 | WAIS-R | 32 | 101.2 | 101.3 | 10.8 | 101.3 | 10.8 | 97.7 | |
| Ruble, 1980 [121] | Ball State U | 1978.5 | WAIS | 60 | 102.8 | 104.6 | 7.1 | 104.6 | 7.1 | 97.2 | ||
| Salvia, 1986 [122] | Pennsylavania State U | 1984 | 1185 | WAIS-R | 100 | 122.7 | 124.6 | 9 | 124.6 | 9 | 123.4 | |
| Salvia, 1988 [123] | Pennsylavania State U | 1986 | 1185 | WAIS-R | 74 | 122.9 | 124.5 | 9.6 | 124.5 | 9.6 | 122.7 | |
| Sartain, 1946 [124] | Southern Methodist U | 1942.5 | 1350 | WBIS | 50 | 115.4 | 117.5 | 10.5 | 117.5 | 10.5 | 116.1 | |
| Sedlacek, 1976 [125] | Washington State U | 1966.5 | 1115 | WAIS | 276 | 119.7 | 119 | 8.2 | 119 | 8.2 | 115.2 | |
| Shaw, 1965 [126] | State Hospital | 1963 | WAIS | 100 | 119.6 | 119.6 | 9.1 | 119.6 | 9.1 | 116.8 | ||
| Sheckart, 1976 [127] | Towson State College | 1974 | 1120 | WAIS | 36 | 101.9 | 99.4 | 99.4 | 10 | 93.4 | ||
| Sheldon, 1959 [128] | Colorado State College | 1957 | 1175 | WAIS | 20 | 109 | 109 | 10 | 108.1 | |||
| Small, 1987 [129] | U of Nevada | 1985 | 1140 | WAIS-R | 28 | 112.2 | 110.8 | 13.3 | 110.8 | 13.3 | 109.3 | |
| Smith, 1983 [130] | Rosemead School Of Psychology | 1981 | 1180 | WAIS | 35 | 116.1 | 117.7 | 8.7 | 117.7 | 8.7 | 109.6 | |
| Smith, 1983 [130] | Rosemead School Of Psychology | 1981 | 1180 | WAIS-R | 35 | 108.2 | 109.1 | 9.7 | 109.1 | 9.7 | 108.8 | |
| Sorensen, 1968 [131] | Northern Illinois U | 1966 | WAIS | 202 | 119.3 | 8.8 | 119.3 | 8.8 | 115.7 | |||
| Steisel, 1951 [132] | State U of Iowa | 1949 | 1210 | WBIS | 34 | 116.8 | 8 | 116.8 | 8 | 113.5 | ||
| Storrs, 1952 [133] | U of Florida | 1950 | 1375 | WBIS | 50 | 115.8 | 118.4 | 9.4 | 118.4 | 9.4 | 114.8 | |
| *Thompson, 1999 [134] | Lakehead U | 1997 | WAIS-R | 80 | 101 | 102.9 | 11.1 | 102.9 | 11.1 | 97.8 | ||
| Titus, 2002 [135] | Ball State U | 2000 | WAIS-III | 51 | 105.1 | 107.3 | 11.4 | 107.3 | 11.4 | 106.1 | ||
| Verney, 2005 [136] | San Diego State U | 2003 | 1195 | WAIS-R | 75 | 101.7 | 102.5 | 102.5 | 10 | 95.6 | ||
| Wall, 1962 [137] | Pennsylvania State U | 1960 | 1185 | WAIS | 106 | 120.6 | 118.9 | 8.7 | 118.9 | 8.7 | 117.1 | |
| Ward, 1989 [138] | Texas A&M | 1987 | 1270 | WAIS-R | 73 | 114.4 | 118.2 | 118.2 | 10 | 116.1 | ||
| Weyandt, 2002 [139] | Central Washington U | 2000 | 1040 | WAIS-R | 62 | 101.1 | 102.5 | 10.1 | 102.5 | 10.1 | 96.5 | |
| Whitworth, 1986 [140] | U of Texas El Paso | 1984 | WAIS | 75 | 107.6 | 109.4 | 109.4 | 10 | 100.4 | |||
| Whitworth, 1986 [140] | U of Texas El Paso | 1984 | WAIS-R | 75 | 101.1 | 103.6 | 103.6 | 10 | 102.4 | |||
| Young, 2020 [141] | U of Texas | 2018 | 1340 | WAIS-IV | 67 | 116 | 10.7 | 116 | 10.7 | 112.7 |
Note. * = Canadian sample; FSIQ Imp. = FSIQ w/Imputed missing values imputed; FSIQ Adj. = FSIQ w/Adjustment for Flynn Effect (0.3 IQ points per year).
Our systematic review identified only four Canadian samples among 106 samples in total, one tested with WBIS and three tested with WAIS-R. Accordingly, our main analyses include only US samples. However, we also present key meta-regression results for the full 106 US and Canadian samples as WBIS and WAIS-R did not have separate norms for Canadian population. As expected, given only four Canadian samples, the results do not change in any substantive way.
Figure 8 shows the mean undergraduate students’ FSIQ plotted against the estimated year of testing (k = 102), for US samples only, with the size of each bubble indicating the sample size. The Figure shows a steep decline in undergraduate students’ FSIQ since the publication of the first Wechsler test, WBIS, in 1939. The figure includes a meta-regression line with 95% CI bands. The meta-regression was estimated using random effect restricted maximum likelihood estimator (“REML”option in metafor). The estimated FSIQ = 456.658 - .173 * year of testing, with corresponding R 2 = .216. The moderator test for year of testing was statistically significant, QM(df = 1) = 27.103, p < .0001. When both Canadian and US samples were included (k = 106), the estimated FSIQ = 475.431 - .183 * year of testing, with corresponding R 2 = .236. The moderator test for year of testing was statistically significant, QM(df = 1) = 31.36, p < .0001.

A relationship between mean FSIQ and year of assessment for the US u/g samples (k = 102) without Flynn Effect adjustment. The figure includes the meta-regression line with 95% CI bands.
Figure 9 shows the same data but with FSIQs adjusted for the Flynn Effect, for US samples only. Again, the figure shows a steep decline in undergraduate students’ FSIQ. The meta-regression was estimated using random effect restricted maximum likelihood estimator (“REML” option in metafor). The estimated FSIQ = 490.742 - .192 * year of testing with corresponding R 2 = .242. The moderator test for year of testing was statistically significant, QM(df = 1) = 31.30, p < .0001. When both Canadian and US samples were included (k = 106), the estimated FSIQ = 509.166 - .202 * year of testing, with corresponding R 2 = .261. The moderator test for year of testing was statistically significant, QM(df = 1) = 35.85, p < .0001.

A relationship between mean FSIQ adjusted for Flynn Effect and year of assessment for the US u/g samples (k = 102). The figure includes the meta-regression line with 95% CI bands.
Figure 10 compares the Wechsler normative samples IQ data in Table 2 with the undergraduate students’ IQs estimated from the current study. It shows FSIQs reported for WAIS normative samples with 16+ years of education and with 13–15 years of education and FSIQs adjusted for the Flynn Effect of undergraduate student samples derived from the current study. The figure highlights that, on average, undergraduate students’ FSIQs are merely average, and that the vast majority of both undergraduate students, as well as all adults with at least 16 years of education, have merely average FSIQs.
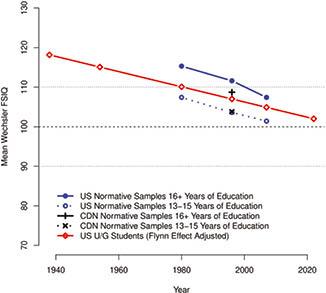
Mean FSIQ for WAIS-R, WAIS-III, and WAIS-IV US Editions and WAIS-III CDN Edition normative samples and for US undergraduate students in the new meta-analysis (with Flynn Effect adjustment). For WAIS normative samples, mean FSIQs are shown for all examinees with 16+ years of education vs with 13–15 years of education.
Finally, we examined the relationship between the estimated mean 2021 SAT scores (obtained from the IPEDS database) and the mean Wechsler IQ adjusted for the Flynn Effect. A simple correlation between the estimated SAT and Wechsler IQ adjusted for the Flynn Effect was moderate, r(78) = .37, p < .001. Using the estimated SAT as the 2nd moderator in addition to the year of testing revealed that the estimated SAT explained an additional 6% of the variability in the Wechsler IQs of the undergraduate samples. The estimated FSIQ = 421.280 – 0.171 * year of testing + 0.024 * SAT, with corresponding R 2 = .325. The moderator test for year of testing and SAT was statistically significant, QM(df = 2) = 37.91, p < .0001. These SAT results have to be interpreted with caution, however. The SAT data were available for only 80 out of the 106 samples, are based on only 2021 SATs of admitted students, and do not reflect the SAT of all admitted students but only those who chose to submit them.
DISCUSSION
The belief that on average, undergraduate students today are brilliant is a myth. In the introduction, we tracked down the origin of this myth to uncritical repetition of decades old obsolete data and claims about undergraduate students’ IQ being 115 to 130 while ignoring Flynn Effect; demonstrated that analyses of successive Wechsler normative samples revealed declines in IQ down to an average range; and reviewed massive increases in educational attainment over the last 80 years that made declines in undergraduate students IQ mathematically inevitable. Our meta-analysis provides further compelling evidence of the decline and demonstrates that the belief that, on average, undergraduate students are brilliant is a myth.
Wechsler tests are designed to describe US and/or Canadian population, that is, the normative populations are the same but those normative populations and samples are changing as time goes by. IQ scores describe where a particular examinee or a particular group (in case of mean IQ scores) lies relative to the mean of the standardization sample (100) in terms of the standard deviation (15). Successive versions of Wechsler tests are highly correlated, indicating that they measure largely the same thing. In fact, these intercorrelations are among the highest one one can find in psychological research (0.88 to. 94), although not perfect, not 1.00 [18,23,24]. However, a wealth of research has shown that later Wechsler tests are harder than earlier tests, that the scores on one Wechsler test are not equivalent to scores on another Wechsler test, and that to compare IQ scores across successive Wechsler tests one must at minimum adjust the scores for Flynn Effect (approximately 0.3 IQ points per year).
Our new research highlights that not only are successive Wechsler test versions harder as normative populations overall ability increases but, as compositions of normative populations change with time, performance of subgroups of normative populations also changes across successive versions of Wechsler tests. Our independent study confirms declines in mean IQs of undergraduate students reported in analyses of successive normative samples of Wechsler tests and indicate that the declines have continued for a decade and a half following norming of the WAIS-IV [24], the last Wechsler test. Today’s undergraduate students’ IQ is estimated to be mere 102 IQ points. On average, undergraduate students’ IQ is no longer extraordinary but merely average. We have also demonstrated that undergraduate students’ mean IQs vary hugely across the institutions, depending on admission standards and the selectivity of institutions the students were attending (as measured by the 2021 SAT of admitted students). The mean IQs of student samples range from below 100 to over 120, consistent with huge variability in admission rates and median SAT scores of students admitted to various universities. Even though we were using only the most recent IPEDS data on selectivity and median SAT scores of admitted students, the median SATs of admitted students moderately correlated with IQs of undergraduate students’ samples from these universities, r(78) = .37.
The decline in undergraduate students’ mean IQs is an inevitable consequence of profound changes in educational attainment in the USA and Canada since 1939, since the publication of the WBIS [17], detailed in the introduction. Whereas only a small portion of the population of Canada and the USA ever finished high school, and only a few percent ever made it to university in 1939, almost every adult today completed high school, 60 to 70% of the population have some college or university education, and approximately 40% of adults have university degrees in USA and Canada. Accordingly, whereas the Flynn Effect describes increases in mean intelligence of successive generations corresponding to approximately 0.3 IQ points per year, our findings demonstrate that undergraduate students’ mean IQ relative to general population have been declining approximately 0.2 IQ points per year, resulting in an absolute increase of only 0.1 IQ points per year for undergraduate student population.
Our findings have several far-reaching implications. First, professors today are no longer teaching students with mostly above-average IQs as they did in the 1950. Instead, they are teaching students with mean IQs no different from 100, that is, the mean IQs of the general population. Furthermore, professors are also teaching students with a much wider range of abilities, specifically, IQs ranging from below 70 to above 130. In the 1950s, when the average undergraduate students’ IQ was 115 to 120, only a relatively small proportion of undergraduate students had IQs below 100, whereas today, nearly half of undergraduate students have IQs below 100 – the population mean. In turn, professors have been forced to reduce material covered, reduce academic standards, reduce students’ workload, and inflate grades, degrading the value of undergraduate education [142].
Our findings validate the views of many university professors that students are less smart, less well prepared, and work less, but yet the students themselves believe that they are, in fact, very smart and deserve the very top grades [143–147]. University professors’ beliefs are also well supported in the literature. For example, students admit to studying far less than university calendars expect of them. Whereas students used to study 2–3 hours outside of the class time for each hour of class time back in 1950s, today, by their own account, students study only about one hour outside of the class time for each hour of class time [142,148,149]. Yet, if university grades reflect how smart students are, students are told by their professors that they are extraordinarily smart, smarter than students in the 1950s, since most awarded grades today are As [150,151] and, according to university calendars and grading standards, A grades are for “superior performance”, B grades are for “clearly above-average performance”, and C grades are for “satisfactory” or average performance [142]. The DFW grades (i.e., Fs, Ds, and Withdrawals) are now more rare [142]. However, as has been pointed out, the A grades given to most students do not reflect students’ superior achievement but reflect demands (a) to ensure students’ satisfaction, (b) to achieve high student evaluation of teaching (SET) ratings, (c) to minimize DFW grades, and (d) to ensure high student retention [152–155]. Not surprisingly, public trust in higher education has dropped to all times low with only 36% of American public in 2023 having confidence in higher education [156].
Second, employers can no longer expect employment applicants with undergraduate degrees to have appreciably higher IQs and mental abilities than the general population. Undergraduate students are merely average, and university graduates have, on average, a few extra IQ points but are merely average. For employers, a university degree has been losing its value and prestige for quite some time simply because there is now an abundance of individuals with such degrees. Our data also indicates that holders of university degrees are no longer special in terms of intelligence and cognitive ability as they used to be in the 1940s or 1950s. With diminishing value of undergraduate degrees, some employers allow applicants to take a quick multiple choice intelligence tests in lieu of a university degree requirement. For example, Government of Canada, one of the largest employers in Canada, allows job applicants to take General Intelligence Test GIT-310, or its newer and shorter version, General Competency Test GCT2-314, “as an alternative to a university education requirement”. To be counted as an alternative to a university education requirement, the applicant has to get 58 out of 90 multiple choice questions correct on GCT2-314 [157,158]. Many other employers have eliminated and plan to eliminate requirements for university degrees altogether [159].
Third, students who are enrolled or who plan to enrol in higher education need to realize that acceptance into university is no longer an invitation into an elite group, that they will likely be in classes with students with huge variability in IQ ranges, and that only some portion of the education offered will be adapted to their level of ability. These students need to know that to secure many jobs that required university degrees in the past they only need to pass, for example, a 90 item multiple choice intelligence tests, specific online course, or obtain sufficient relevant experience and skills (see above).
Fourth, various claims in scientific, clinical, and popular literature about IQs of undergraduate students and university graduates being in the above average range (detailed above), for example, between “113 and 120” [1–4], are plainly wrong. These claims are nothing but myths and artifacts of improper and unwarranted reliance on obsolete data sets collected decades ago, ignorance of Flynn Effect, as well as, massive change in education over the last 100 years. This misinformation ought not to be propagated by mindlessly citing decades-old articles that themselves refer to further decades-old articles and obsolete data collected in the 1940s and 1950s.
Fifth, various methods of estimating premorbid IQs based on educational attainment are speculation and no longer evidence based as these estimates do not take into account (a) massive changes in educational attainment of populations, (b) large variability in mean IQs across institutions, (c) large variability of mean IQs across fields and subfields of study (as evidenced by SAT and GRE data detailed above), (d) large variability in IQs of individual students, and (e) Flynn Effect. For example, a clinical psychologist who opines that a client’s premorbid intelligence was clearly above average because the client (a) graduated from a Canadian public university in 2000 and (b) achieved above-average B-level grades while pursuing Bachelor’s degree in Education is clearly uninformed, ignorant of essential facts, and not minimally competent to practice in this area. First, WAIS-III Canadian Edition normative data (collected in 1996) showed that Canadians with 16 or more years of education, on average, scored in the average range with the FSIQ of 108.7 and standard deviation of 14.3 [19]. Second, students bound to pursue degrees in Education score below the average of all university-bound seniors on SAT and below the average of all students attempting GREs (see Figures 4 and 5). Third, B-grades are no longer “above-average grades” but merely average or below average grades due to a well known and widely publicized phenomenon of grade inflation [150,151]. Fourth, given the average FSIQ of 108.7 in 1996 and SD of 14.3, 95% of Canadians with 16 or more years of education had FSIQs ranging from 80 to 137. In fact, Longman et al. [19] give FSIQs of the WAIS-III normative sample for closely corresponding 2nd and 98th percentile as 78 and 142, respectively. Finally, the Flynn Effect and increases in educational attainment have continued and, as a result, the FSIQ of Canadians with 16 or more years of education was still lower in 2007, at the time WAIS-IV was normed, by another three or so IQ points, suggesting that the average WAIS-IV FSIQ of all Canadians with 16 or more years of education was only 105.7. In summary, if one wishes to speculate, the client’s IQ was likely average, around 100 or even less, rather than being above average at the time she graduated with the Bachelor’s degree in Education.
To obtain more reasonable estimate of examinees’ premorbid IQ, clinicians need to rely on individual assessment of examinees’ IQ. First, clinicians may use SAT, ACT, GRE, and other standardized measures that are highly correlated with IQ, if such scores are available and if regression equations estimating IQ from these scores are available [36]. Second, clinicians may use various reading based and other literacy measures to estimate pre-morbid intelligence [160,161]. However, in both of these approaches, if a regression equation estimating IQ was developed for an earlier version of Wechsler test, clinicians still need to adjust the estimate for the Flynn Effect and be cognizant of the limitations of such adjustments [160].
Sixth, education adjusted norms such as Advanced Clinical Solutions [162] norms available for WAIS-IV and Wechsler Memory Scale IV (US) are similarly mere speculations and not evidence-based for the very same reasons; the demographic adjustment for education attainment does not take into account (a) massive variability in the mean IQ of students graduating from different universities, (b) large variability of mean IQs across different fields and subfields of study, (c) large variability in IQs of individual students, (d) the Flynn effect and the resulting norms obsolescence, and (e) rapid changes in educational attainment. In fact, the use of these demographically-adjusted norms is unwarranted, wrong, and unethical; the norms attempt to adjust for the relatively small differences in IQ associated with educational attainment but ignore much larger differences in IQ between universities, fields of study, individuals, and generations.
Finally, and critically, our research highlights what should be obvious to any informed person: obsolete IQ data ought not to be used, ever, to make high-stakes decisions about individuals, for example, by clinical psychologists, employers, vocational counsellors, or government agencies. Unfortunately, at least some psychologists, employers, vocational counsellors, and even government agencies did not yet get the message, did not read WAIS test manuals, and are unaware of trends in higher education. In particular, they appear unaware of the Flynn Effect and of rapid changes in educational attainment and education in general. For example, recently three clinical psychologists, Dr. W, S, and M, all registrants of the College of Alberta Psychologists (www.cap.ca), used Gottfredson [1–4] articles, Wonderlic [6] WAIS [5] IQ data, the Schmidt and Hunter [163] article that republished intelligence data on some teachers – specifically White, enlisted men in US Army Air Force at the time of World War II originally published by Harrell and Harrell [164], and the USES GATB data from 1950s [165] – to argue that an elementary school teacher, Ms. T, with twice assessed average IQ on WAIS-IV Canadian Edition [24] was so low as to be more than “2 standard deviations below the average requirement for teachers”, etc. (see Table 4 for excerpts from Dr. W’s expert report). Dr. W and S’ reports were filed as expert reports in an ongoing human rights proceedings resulting from Ms. T’s removal from the classroom in 2010 and subsequent dismissal from her employment in 2016 on the grounds that her twice assessed average intelligence and cognitive abilities prevented Ms. T from performing her teaching duties [166]. Ms. T’s employer has been explicitly relying on Dr. W and S’s opinions in an attempt to justify her removal from the classroom and the dismissal.
An extract from Dr. W’s expert report: Dr. W’s opinions about Ms. T’s intelligence based on multiple obsolete IQ norms and data sets.
| On September 21, 2021, in response to a critique of her work, Dr. W wrote in her expert report that “Data on the typical level of intelligence or general mental ability seen within a population of teachers is in fact available in the scientific literature.” and proceeded to rely on Gottfredson [4], Schmidt & Hunter [163], and Gottfredson [2] to claim that Ms. T’s twice assessed average WAIS-IV CDN [24] FSIQ was at the bottom 2% of all teachers. Relying on Gottfredson [4], Dr. W wrote: |
| Relying on Schmidt and Hunter [163], Dr. W wrote: |
| The partially reproduced Table 1 from Schmidt and Hunter [163] in Dr. W’s report indicated that 256 “Teacher[s]” had mean GCT [US Army General Classification Test] standard score of 122.8, median of 123.7, SD of 12.8, and range of 76–155. Dr. W continued: |
| Relying on Gottfredson [2] figure published in and copied from Scientific American, Dr. W wrote: |
Dr. W then opined:
|
Dr. W, S, and M’s statements and opinions ignore that the data to which they compared Ms. T’s WAIS-IV Canadian Edition IQ scores were (a) astonishingly obsolete, (b) not representative of elementary school teachers in the USA or Canada 50 to 70 years ago nor today, and (c) collected in a historical era that had little resemblance to today. Similarly, Drs. W, S, and M never mentioned the existence of the Flynn Effect and, if one desired to speculate, the resulting need to adjust the obsolete data for 0.3 IQ points per year. In addition, they never mentioned the massive changes in educational attainment of US and Canadian populations over the last 100 years resulting in university students having merely average rather than above average mean IQ. None of the three clinical psychologists even mentioned that WAIS-III and WAIS-IV normative data already showed that university students and university graduates (individuals with 16+ years of education) had average IQs well below 110. If one wanted to speculate, adjusted for the Flynn Effect, Gottfredson’s [4] WAIS FSIQ of 112 corresponds to WAIS-IV FSIQ 96.1, and Schmidt and Hunter’s [163] CGT of 122.8 corresponds to a WAIS-IV FSIQ of 98.2. If one took the average of those two estimates, the teacher samples upon which Drs. W, S and M relied on would score, on average, a mere 97.1 on WAIS-IV. In turn, Ms. T’s WAIS-IV FSIQ scores of 86 (obtained while Ms. T was physically unwell, vomiting, being distracted by noise from adjacent room, etc) and 91 (while in more reasonable testing circumstances) are well within the centre of the distribution of these teachers as well as within the average range of WAIS-IV Canadian Edition standardization sample. These examples highlight an astonishing level of ignorance of changes that have occurred during the last 100 years, and a complete failure to examine test manuals among at least some registered clinical psychologists, including those who present themselves as experts on these matters during legal proceedings.
Moreover, it is simply inappropriate to directly compare examinees’ IQ scores on one intelligence test to norms on some other intelligence test without some kind of equating procedures as well as recognition that estimates of examinees’ IQ scores on different test than that actually administered to them will be imprecise and subject to substantial error. Intelligence tests, including different versions of Wechsler tests, use different items, different subtests/tasks, different normative samples, and are normed at different times. As detailed above, extensive prior research indicates that even for different versions of WAIS tests, one must at minimum adjust scores or norms for the Flynn Effect. Our study highlights that as a composition of general population changes one must also adjust for the population composition changes, for example, changes in educational attainment of population and resulting decline in undergraduate students’ average IQ. Moreover, other changes in society may substantially alter performance on intelligence tests depending on specific composition of such tests. For example, an introduction of calculators and changes in school curricular de-emphasizing procedural skills and arithmetic fluency resulted substantial decline in arithmetic fluency [167]. Not surprisingly, Canadian university students in 1995 scored one half of standard deviation below the mean of Canadian General Working Population on Numerical Aptitude of General Aptitude Test Battery Canadian Edition [168] normed only ten years prior, in 1985 [169].
Our study has several limitations. We were able to locate only four WAIS Canadian samples, and thus, were unable to examine declines in undergraduate students’ IQ in Canadian population. However, given similar massive increases in educational attainment in USA and Canada over the last 80 years, the declines in undergraduate students’ IQ in USA and Canada are likely to be comparable. If anything, we expect Canadian undergraduate students’ IQ to be slightly lower than that of US undergraduate students because Longman et al. [19] showed that associations between WAIS-III FSIQ and education attainment were much smaller in Canadian than US population (see Table 5). Thus, Canadian undergraduate students’ IQ, using Canadian norms, is likely to be only about 100 or 101 IQ points in 2022. Using Shipley-2, Uttl [170] reported that a sample of undergraduate students tested in a large undergraduate Canadian university was only 103 using Shipley-2 US norms gathered in 2008. However, if Shipley-2 was normed on Canadian population in 2022, the mean IQ of these students would be lower given the Flynn Effect, smaller association between IQ and education in Canadian population, and Canadians having slightly higher IQ scores using US vs. Canadian norms.
Mean FSIQs of WAIS normative samples with 13–15 and 16+ years of education and estimated mean FSIQs of undergraduate students at the time of Wechsler tests’ standardizations based on the current study.
| Test/Standardization Year | Normative samples (US) 13–15 Years | 16+ Years | Normative samples (CDN) 13–15 Years | 16+ Years | Current Study (US data) Unadjusted | Adjusted |
|---|---|---|---|---|---|---|
| WBIS/1938 | 121.2 | 118.2 | ||||
| WAIS/1954 | 118.4 | 115.1 | ||||
| WAIS-R/1980 | 107.4 | 115.3 | 113.9 | 110.1 | ||
| WAIS-III/1996 | 103.6 | 111.6 | 103.8 | 108.7 | 111.2 | 107.0 |
| WAIS-IV/2007 | 101.4 | 107.4 | 109.3 | 104.9 | ||
| 2022 | 106.7 | 102.0 |
Our analyzes are limited to Wechsler adult intelligence tests only. However, Uttl [170] reported that similar declines are observed on at least two other intelligence tests: Wonderlic Personnel Test (WPT) [6] and Shipley-2 (Shipley, [171]). Wonderlic [6] reported that WPT raw scores of undergraduate students and university graduates declined substantially between 1970 to 1992 down to an average range. A recent meta-analysis of undergraduate students’ WPT scores reported in the literature confirmed these declines and showed that they continued beyond 1992 and that in 2022 undergraduate students scored on average only 22 points on WPT, corresponding to approximately 102 IQ points on IQ scale [142,169]. Similarly, Shipley (2009) reported that IQ of undergraduate students and holders of undergraduate degrees declined to average range already in 2008, 15 years ago, the time Shipley-2 was normed. Shipley (2009) wrote: “adults with less than a high school education… tended to have scores about 3 to 6 standard score points below the mean of 100 [94–97]”, “adults with a high school diploma… were found to have scores ranging from 1 to 3 points below the mean [97 to 99]”, “adults who attended some college… had scores right around the mean [99–101]” and “Individuals who had a college degree… had mean scores 3 to 7 points above the mean of 100 [103–107]” (p. 51). As detailed above, Uttl [170] reported that Canadian undergraduate students scored only 103 IQ points on Shipley-2 in 2022.
Finally, SAT and ACT data detailed in the introduction are not comprehensive as not all students choose to submit SAT and/or ACT scores and not all students are in fact required to submit SAT and/or ACT scores. Nevertheless, SAT and ACT data are very strongly correlated and both SAT and ACT data are substantially correlated with institutional admission rates and selectivity. In turn, this suggests that both SAT and ACT data are likely representative of all admitted students.
CONCLUSIONS
The average IQ of undergraduate students today is a mere 102 IQ points; undergraduate students are no longer extraordinary but merely average and no different from the general population IQ (M = 100, SD = 15). From 1939 to 2022, undergraduate students’ IQ declined by approximately 0.2 IQ points per year relative to general population. The students’ average IQ also varies substantially across universities and is correlated with estimated average SAT scores of admitted students or selectivity of universities, even though the SAT and IQ data were collected at different time periods and using different samples from each institution. The decline in undergraduate students’ IQ is necessary consequence of college and university education becoming a new norm rather than the privilege of a few. In fact, graduating from university is now more common than completing high school in the 1940s or 1950s. These findings have wide-ranging implications. First, universities and professors need to realize that students are no longer extraordinary but merely average and of a wide range of abilities. Second, employers can no longer rely on job applicants with university degrees to be more capable or smarter than those without university degrees. Third, students need to realize that acceptance into university is no longer an invitation to join an elite group. Fourth, various claims in scientific, clinical and popular literature promoting the myth of extraordinarily smart undergraduate students based on obsolete data need to be promptly corrected to reflect a new reality. Fifth, various methods of estimating premorbid IQs based on educational attainment are vastly inaccurate, obsolete, no longer evidence based, and ought to be abandoned. Sixth, obsolete IQ data or tests should never be used, ever, to make high-stakes decisions about individuals by clinical psychologists, employers, vocational counsellors, or government agencies. As has been argued before, a failure to adjust obsolete test scores or norms for the Flynn Effect is unscientific, unethical, incompetent, scandalous and malpractice (see above). We agree with Reynolds et al. that “No one’s life should depend on when an IQ test was normed” and we also believe that no one’s career and livelihood should depend on the opinions of experts who opine about their clients’ job competence based on 80 years obsolete intelligence test data uncorrected for the Flynn Effect and collected in a historical era bearing little resemblance to today.