
INTRODUCTION
Women are underrepresented among U.S. university faculty in Science, Technology, Engineering, and Mathematics (STEM). Why?
Gender bias pervades academia, including academic hiring processes [1,2], student evaluations of teaching [3], citation counts [4], grant applications [5,6], letters of recommendation [7,8], credit for joint work [9], and the journal refereeing process [10]. Because of the prevalence of gender bias in so many areas of academia, it is important to understand where the bias is largest and most impactful to target gender equity efforts most effectively.
Some recent studies concluded that audiences treat academic seminar (e.g., job talks, conference talks, departmental seminars) speakers differently depending on the speaker’s gender [11–13].
Here, we examine whether female job applicants received more questions or spent more time responding to questions than male job applicants in five STEM departments between 2013–2019: Civil and Environmental Engineering (CEE), Electrical Engineering and Computer Science (EECS), Industrial Engineering and Operations Research (IEOR), Mechanical Engineering (ME), and Physics. Table 1 shows the proportion of female faculty and female interviewees in these departments. Presenters’ self-identified genders were not available. We inferred gender from pronouns on the presenter’s website (if available), name, and appearance. We did not infer that any presenter’s gender was non-binary but our analysis is easily extended to include more gender categories.
Percentage of faculty who are women and number of job talk videos for the five STEM departments in the study (the counts include lecturers and adjunct faculty but not emeriti).
| Department | CEE | EECS | IEOR | ME | Physics |
|---|---|---|---|---|---|
| Female Faculty | 25% | 18% | 30% | 18% | 12% |
| Female Pre-tenure Faculty | 50% | 31% | 33% | 25% | 22% |
| Female applicant pool, 2015-2019 | 28% | 22% | 22% | 22% | 20% |
| Videos | 31 | 65 | 8 | 35 | 17 |
| Female interviewees | 48% | 34% | 38% | 40% | 29% |
| Median events, female | 9 | 11 | 23 | 16 | 7 |
| Median events, male | 9 | 10 | 24 | 20 | 8 |
Median events refers to the median number of audience utterances (e.g., questions, comments). Pre-tenure faculty includes tenure-track assistant professors but neither lecturers nor adjunct faculty. Faculty counts and applicant pool data were obtained from the UC Berkeley Office for Faculty Equity and Welfare. Faculty full-time equivalent (FTE) data as of 4/30/2020.
Our study and analysis differ substantially from previous work. Our data are for a different institution, cover more STEM disciplines, and include more categories of questions and other interruptions. To address inter-rater reliability, at least three raters examined every talk, while other studies generally used only a single rater. One recent study [13] found very large differences among raters, but concluded—based on an inappropriate use of the correlation coefficient—that those differences could be ignored.
Our data include whether each speaker was ultimately offered a faculty position, allowing us to examine the relationship between interruptions and successful applications. We also investigated department culture around asking questions during job seminars, which revealed differences across departments.
Previous work used parametric tests and were based on differences in means. We use nonparametric randomization tests based on differences in medians. The tests frame the scientific null hypothesis that “speaker gender does not matter” as the statistical null hypothesis that speaker gender is an arbitrary label that might as well have been randomly assigned (within each department). Medians represent what is “typical” for speakers of each gender, whereas means are sensitive to extreme values.
We generally find small gender differences in the medians, on the order of 0–4 questions, not all in the same direction. The differences are not statistically significant.
Whether the differences are statistically significant or not, it is implausible that differences so small have a material impact on whether a candidate is hired. Moreover, the data do not support the hypothesis that interruptions are always detrimental to the presenter: in some departments, candidates who were interrupted more often were more likely to be offered a position.
Our study was inspired by that of Blair-Loy et al. [11], who examine a slightly smaller data set (119 talks in Engineering departments versus 156 talks in STEM departments in our study) and find gender differences comparable in magnitude to those we find—but conclude that those small differences are statistically significant.
Data and Methods discusses our data and statistical methods. Randomization Test Results presents our main results. Comparison with Previous Studies examines differences between our study and previous work, presenting evidence (from simulations and experiments with negative controls) that the apparent statistical significance of the small effects found by Blair-Loy et al. [11] results from using an inappropriate hypothesis test. It also explains how to calibrate parametric tests using randomization, to obtain genuine P-values in some situations where the parametric assumptions do not hold. The findings and limitations are considered in the Discussion section. The final section presents our conclusions.
DATA AND METHODS
Data
Many UC Berkeley departments record academic job talks for tenured and tenure-track positions. We received Berkeley IRB approval to use such videos in this research.
We obtained videos from 2013–2019 for eight departments: Civil and Environmental Engineering (CEE), Electrical Engineering and Computer Science (EECS), Industrial Engineering and Operations Research (IEOR), Materials Science and Engineering (MSE), Mechanical Engineering (ME), Nuclear Engineering (NE), Physics, and Statistics. Not all the videos were adequate for our purpose (e.g., prior to 2018, the statistics department did not use an audience microphone: the audience voices were often unintelligible), and some departments had too few male or female applicants for any test to have much power: we omitted departments for which (# presenters) choose (# female presenters) is less than 20, because that makes it impossible to have a P-value less than 5%, no matter what the data are. That left CEE, EECS, IEOR, ME, and Physics. In all, 156 videos from the five departments were annotated.
Annotation methodology
We developed a set of tags for audience interactions using an iterative process that involved eight raters tagging the same videos, then assessing inter-rater reliability. The category definitions were adjusted until all annotators agreed on the annotations across several videos. We tried to capture “tone” to the extent that it could be labeled consistently by different raters. We ended up with 13 categories, listed in Table 2. An annotation refers to each time a member of the audience spoke. A typical video might have 8–20 annotations (the number of annotations ranged from 2 to 57); variation across departments was substantial.
Characteristics of utterances noted by raters, and their definitions.
| Category | Definition |
|---|---|
| Begin | Time a distinct person starts speaking. |
| End | Time that person stops speaking. |
| Speaker | Whether the speaker was an audience member or host/other |
| Acknowledged | Presenter (or host) paused and either verbally or nonverbally recognized the speaker before the speaker spoke, e.g., “I see you have a question” or “yes?” If the speaker cut off the presenter or host, the speaker is unacknowledged. |
| Attempted Interruption | An audience member interrupted the presenter or host but the presenter or host continued without giving the audience member a chance to question or comment, or ignored the question or comment. |
| Follow-up | The question/comment came from the same person as the previous question/comment. If a new person asks a related question it is not a follow-up. |
| Scientific Comment | The audience member commented about the science, beyond providing context for a question. |
| Non-scientific Comment | The audience member made a comment that is not related to a scientific concept. |
| Positive Comment | The audience member made a positive comment (e.g., “very interesting work!”). |
| Clarifying Question | A question about what the presenter did, how they did it or what it means (e.g. “what does that variable mean?”, “How does this model work?”). Questions about the presenter’s background, previous research, or approach to various problems are clarifying questions (e.g., “Can you describe the research you are working on with Professor X?” or “How would you teach this concept to others?”). |
| Furthering Question | A question that bring in new concepts or information (e.g. “you mentioned X, have you considered Y?”, “Do you have thoughts on the effect of Z on X?”). |
| Critical | A question/comment that expresses skepticism, doubt, or concern about the validity of the work (e.g., “Are you sure that method works in this context?”). |
| Ad hominem | A question/comment impugning the presenter’s identity rather than addressing the presenter’s work (e.g., “how could a woman be expected to understand this?”, “only somebody who studied at Stanford would use that method”). |
| Self-referential | An audience member makes a statement about themselves (e.g. “in my experience/work,” “My work on X shows” ). |
Each video was reviewed by three undergraduate researchers. Two students independently annotated each video; a third student resolved any discrepancies. Data quality is discussed in Appendix A.
Randomization (permutation) tests
We consider the null hypothesis that the gender of the presenter is not related to the number, duration, or nature of questions the audience asks, as if gender were an arbitrary label assigned at random to presenters. This hypothesis naturally leads to randomization tests.
We condition on the number of female and male presenters in each department and consider the distribution of test statistics under the null hypothesis. Conceptually, we imagine randomly re-labeling presenters in such a way that each department keeps its observed numbers of female and male presenters, but the gender labels are “shuffled” across presenters. That induces a (null) probability distribution for any test statistic we might choose to examine (including the test statistic used by Blair-Loy et al. [11], as discussed below). The probability that the test statistic is greater than or equal to the value observed for the original data, computed on the assumption that the null hypothesis is true, is a P-value for the null hypothesis.
In principle, the randomization distribution can be found exactly by enumerating all assignments of genders to presenters that keeps the total number of female and male presenters fixed. When there are many presenters and more than a few of each gender, it is impractical to enumerate all assignments. Instead, P-values can be constructed by assigning gender pseudorandomly B times, then basing the P-value on the distribution of the test statistic in that simulation. This can be viewed as a simulation approximation to the “true” P-value that would be obtained by examining all assignments or it can be viewed as an exact P-value for a randomized test [14,15], if the P-value is computed as
In the latter approach, the smallest attainable P-value is 1/(B+1).
It is important to select the test statistic before examining the data, to prevent “P-hacking.” We chose to use the difference in the median number of questions asked of female and male presenters as the test statistic, primarily for two reasons. First, we are interested in “typical” behavior, which the mediastions varies considerably; we did not want the results to be driven by a small number of talks that generated unusually many questions. Note that there is more than one definition of the median. We use the “smallest” median: the smallest number that is greater than or equal to at least 50% of the observations.
As described in Comparison with Previous Studies and Appendix B, we also used the test statistic adopted by Blair-Loy et al. [11], namely, the gender coefficient in a ZINB regression of the number of questions on covariates that included the presenter’s gender and the percentage of faculty in the department who are female.
Blair-Loy et al. [11] examined the pre-Q&A portion of job talks but not the Q&A portion: they hypothesized that presenters are injured by questions (interruptions) during the pre-Q&A period because it takes time away from their exposition. We analyzed pre-Q&A questions and other interruptions to compare with their results. However, we also analyzed entire talks, including the Q&A period, to examine whether male and female presenters are treated differently overall. Because pre-Q&A questions are relatively rare, restricting attention to the pre-Q&A period would have limited our ability to detect differences.
Our primary analysis kept departments separate because departments have different customs and etiquette for asking questions and interrupting presenters. We did not stratify by year. Stratifying by year might reduce the possibility of Simpson’s Paradox affecting the results, for instance, if the percentage of presenters who are female varies substantially from year to year and department practices also change. However, stratifying by year might also decrease power because there are relatively few female applicants and relatively few applicants in all annually.
The randomization tests work as follows:
For each category, calculate the test statistic for the original data.
Randomly reassign the presenter gender labels B = 10,000 times, holding constant the number of female and male labels. For each assignment, recalculate the test statistic for each category.
Calculate the P-value for each category as in (1).
In addition, we used nonparametric combination of tests (NPC) [16] to combine categories into a single multivariate randomization test (see below).
We performed the following randomization tests:
One-sided randomization test using the difference in the median number of acknowledged questions between male and female presenters
One-sided randomization test using the difference in the median number of unacknowledged questions (i.e., interruptions) between male and female presenters
One-sided randomization test using the difference in the median number of attempted interruptions between male and female presenters
One-sided randomization test using the difference in the median time spent on audience questions/comments between male and female presenters
Nonparametric combination of tests combining all 13 categories, where the individual tests were one-sided for the four variables mentioned above and two-sided for the other 9 categories.
We use 1-sided tests for the four primary categories because previous research suggests that women receive more questions, are interrupted more often, and spend more time answering questions than men [11–13]. We also combine all 13 categories into a single, omnibus test using the nonparametric combination of tests method (NPC) [16], a general method for creating multivariate tests by combining univariate permutation tests. The test statistic for the multivariate test is calculated by applying a combining function to the P-values from the univariate tests.
The randomization distribution of that combination of P-values under the null hypothesis is used to calibrate the omnibus test, as follows:
Create B randomized versions of the dataset by randomly reassigning the presenter gender labels B times, yielding a total of B + 1 datasets, including the original.
For each of the B + 1 datasets, calculate the test statistic for each of the 13 categories (the difference in medians for that category between male and female presenters).
Then, for each dataset, replace the value of the test statistic for the jth category with the fraction of values (across the B + 1 versions of the dataset) for which the jth test statistic is greater than or equal to the value of the test statistic for that dataset (for two-sided tests, the test statistic is the absolute value of the “raw” difference). This replaces each observed value of the test statistic by its corresponding P-value. That gives B + 1 13-vectors; the components of each 13-vector are numbers between 0 and 1.
Apply Fisher’s combining function (−2∑jlnPj) to each of the B + 1 13-vectors to get the NPC test statistic for each dataset.
The overall P-value is the fraction of the NPC test statistics (among the B + 1 values) that are greater than or equal to the NPC statistic for the original dataset.
In total, five tests (the four one-sided randomization tests and the NPC test) were performed on 4 subsets of each department’s data—all presenters or pre-tenure presenters, and the entire talk or pre-Q&A portion of the talk—a total of 20 tests. We adjusted for multiplicity using the Holm-Bonferroni correction, but nothing was statistically significant even before the adjustment.
RANDOMIZATION TEST RESULTS
Descriptive statistics do not illuminate differences in the number or nature of questions asked to female versus male presenters. Figure 1 shows the distribution of acknowledged, unacknowledged, and follow up questions asked broken down by department and gender.
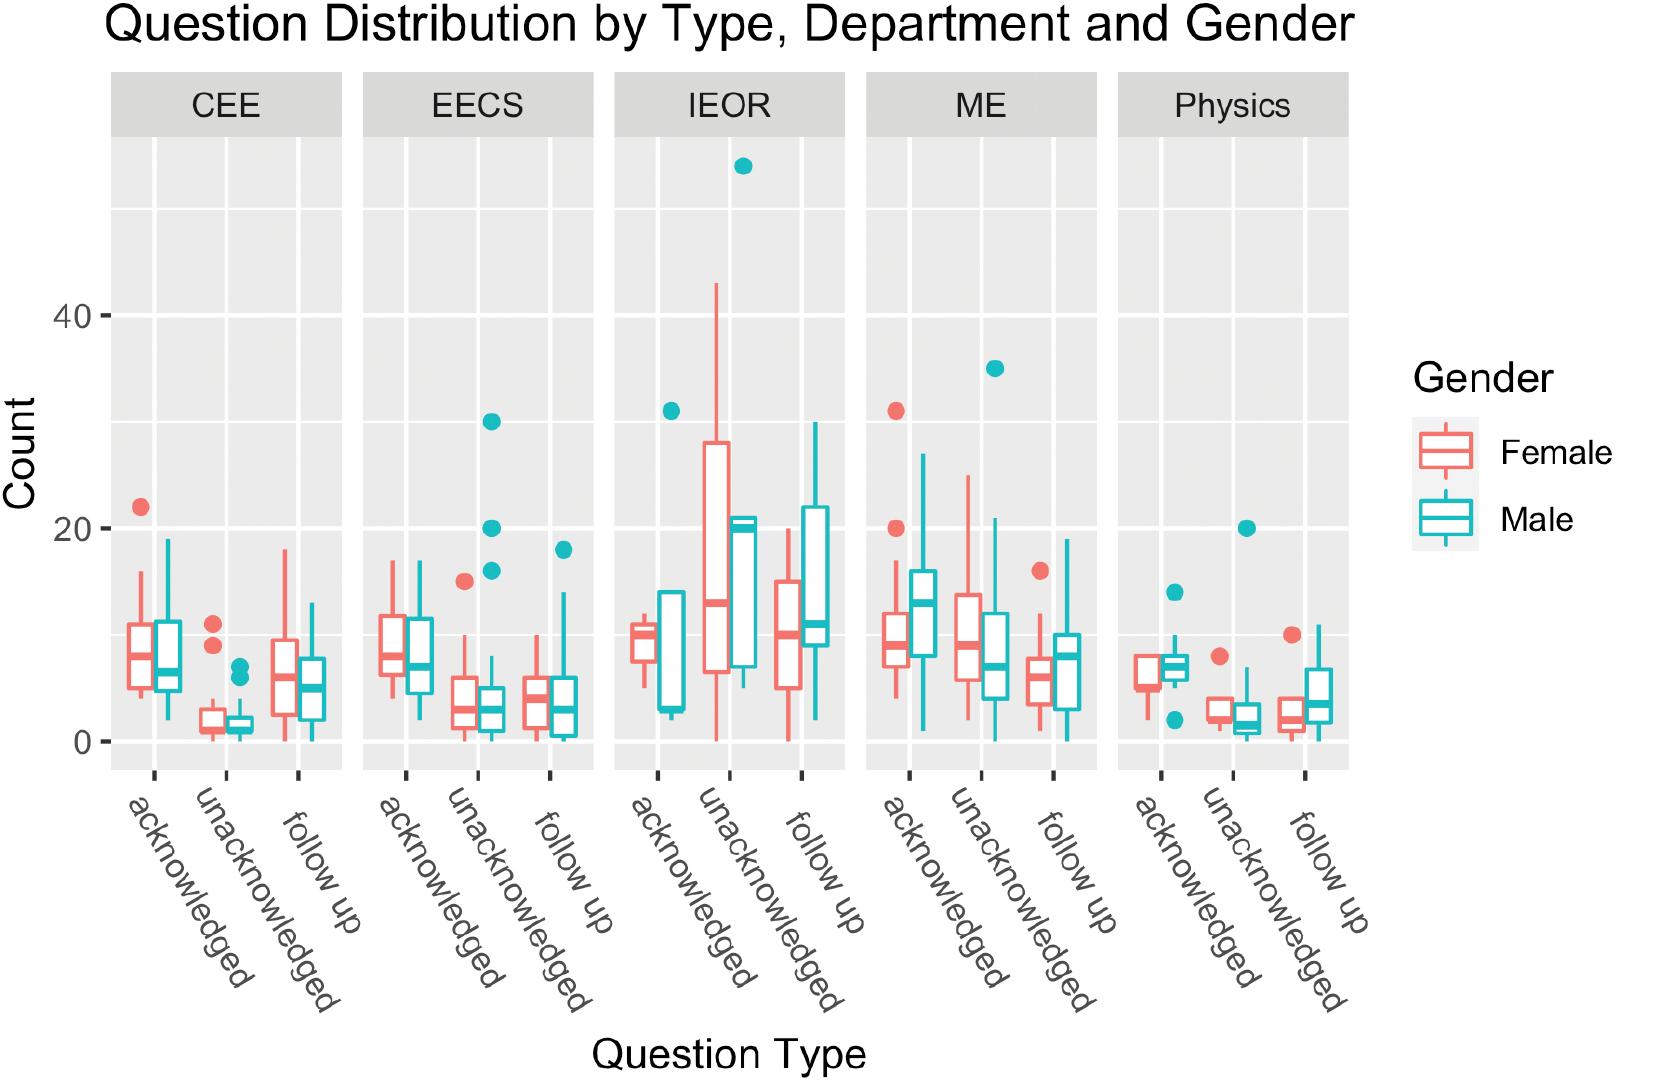
Box plots showing the distribution of acknowledged, unacknowledged and follow up questions asked broken down by department and gender. The box extends from the 25th to 75th percentile with a line for the median in between. The whiskers extend from the minimum to maximum values, with points plotted above or below if they are outside of 1.5 times the interquartile range.
Here we present our results based on randomization tests. These findings were compared to an analysis using the parametric ZINB method of Blair-Loy et al. [11], which was calibrated parametrically and nonparametrically using randomization (see Comparison with Previous Studies and Appendix B).
We considered the entire talk (pre- and post-Q&A), pre-Q&A by itself, all presenters, and only pre-tenure presenters: four analyses in all. Table 3 show entire talk results for each department and all presenters. Results for pre-Q&A and only pre-tenure presenters were qualitatively the same and are presented in the Appendix.
For each department, difference in medians (female–male) for each category of audience utterance, for entire talks (pre- and post-Q&A), for all applicants (non-tenured and tenured).
| CEE | EECS | IEOR | ME | Physics | |
|---|---|---|---|---|---|
| Time on Questions (in seconds) | 43 | 37 | 117 | 31 | 0 |
| 0.36 | 0.15 | 0.50 | 0.33 | 0.64 | |
| Acknowledged Question | 2 | 1 | 7 | −5 | −2 |
| 0.29 | 0.30 | 0.37 | 0.97 | 1 | |
| Unacknowledged Question | 0 | 0 | −7 | 2 | 1 |
| 0.83 | 0.59 | 0.65 | 0.14 | 0.35 | |
| Attempted Interruption | 0 | 0 | −2 | 0 | 0 |
| 1 | 1 | 0.65 | 0.85 | 0.67 | |
| Follow-up Question | 1 | 1 | −1 | −2 | −1 |
| 0.49 | 0.35 | 0.65 | 0.85 | 0.77 | |
| Scientific Comment | 0 | 0 | −3 | 2 | 0 |
| 1 | 1 | 0.57 | 0.17 | 1 | |
| Non Scientific Comment | 0 | 0 | −2 | 1 | 0 |
| 1 | 1 | 0.59 | 0.55 | 1 | |
| Positive Comment | 0 | 0 | 0 | 0 | 0 |
| 1 | 1 | 1 | 1 | 1 | |
| Clarifying Question | 3 | 3 | −5 | −5 | −3 |
| 0.36 | 0.18 | 0.72 | 0.29 | 0.32 | |
| Furthering Question | 1 | 0 | 4 | 0 | 2 |
| 1 | 1 | 0.38 | 1 | 0.63 | |
| Critical Element | 0 | 0 | −1 | 0 | −1 |
| 1 | 1 | 1 | 1 | 0.65 | |
| Ad Hominem | 0 | 0 | 0 | 0 | 0 |
| 1 | 1 | 1 | 1 | 1 | |
| Self Referential | 0 | 0 | 0 | 0 | 0 |
| 1 | 1 | 1 | 1 | 1 |
P-values for permutation tests are italicized in the second row for each question category.
Some differences were positive (women received more questions of a given type than men) and some negative; most were zero. The smallest P-value was 0.14, for unacknowledged questions in ME. Almost half of the 65 P-values for individual categories were equal to 1; only 3 are below 0.2 (in EECS and ME). The non-parametric combination of tests yields a combined P-value of 1 for all departments. In summary, the statistical evidence that audience members interact with female and male presenters differently is weak.
COMPARISON WITH PREVIOUS STUDIES
We find relatively small differences in the median number of questions between female and male presenters: the difference was 0 for most types of questions and comments, but depending on the department and the type of question or comment, the difference ranged from −7 (women received fewer questions) to 7 (women received more questions). Median time for questions was 0–2 minutes more for women than for men. The randomization tests do not find any of these differences to be statistically significant.
We are aware of three studies related to ours: Blair-Loy et al. [11], Davenport et al. [12], and Dupas et al. [13]. Blair-Loy et al. [11] is the closest to ours: the other studies primarily look at non-job talks (or do not look at job talks at all), annotate talks “live” while the talk was underway, and examine talks in other disciplines (Economics and Astronomy versus Engineering and Physics).
Davenport et al. [12] is an “informal report” based on 225 talks at the 223rd Meeting of the American Astronomical Society (AAS), held in January 2014. Attendees of AAS were asked to recall and report the number of questions asked in talks they attended through an online form. The online form was advertised to the attendees via email, social media, and blogs. Attendees were not given any training on recording information about the talks, and the report does not analyze the reliability of annotations. The mean number of questions for female presenters was 3.28 (SE 0.20) and for male presenters was 2.64 (SE 0.12). It is not clear how to assess whether the difference, 0.64, is meaningful or statistically significant. Our best understanding is that the reporters were self-selected; not every talk was included and observers had no training. We are not aware of any study of the accuracy of recall data (by untrained observers) in this context: the analysis consolidated multiple observations of a single talk on the assumption that the highest number was correct.
Dupas et al. [13] analyzed 462 Economics seminars at 32 institutions and from 84 seminar series. Of those, 176 talks (38%) were job talks. The talks were annotated by 77 graduate students from many institutions. It is not clear whether the annotators received any training. Most talks were annotated by a single student; a small percentage were annotated by two students. Annotators recorded the start and end time of each interaction, information about who asked the question (e.g., male or female, professor or student), and whether the question was answered, deferred, ignored, or interrupted. Qualitative data were also collected about the type and tone of question. Coding the tone was optional and most annotators chose not to report tone. The data was analyzed using a large number of linear regressions, regressing the outcome (e.g., number of questions) on a subset of presenter gender, a vector of talk level controls (dummy variables for official seminar duration in minutes and whether the seminar is internal (presenter is from institution hosting the seminar)), seminar series fixed effects, coder fixed effects, home institution group fixed effects, and paper JEL fixed effects. The regression was weighted by the inverse of number of coders recording a given talk. The paper does not mention multiplicity adjustments, despite the fact that at least eight models were fit using four different treatments of clustered standard errors, along with dozens of other tests and regression models. (We estimate that the analysis includes hundreds of combinations of models and assumptions about errors.) Dupas et al. [13] conclude that women are asked 3.5 more questions than men on average.
Blair-Loy et al. [11] examined 119 videos from two years of job talks in Computer Science and Electrical Engineering departments at two highly ranked R1 universities and the Mechanical Engineering department at one of those universities. They do not mention the years the talks were recorded. Not every video was annotated; they annotated videos of all female presenters (N = 41) and a sample of male presenters (N = 78) (matched to the female presenters by years from PhD).
They found small differences comparable to those we found: women had an average of 1.18 (SE 1.04) more unacknowledged interruptions than men, 0.097 (SE 0.89) fewer acknowledged questions, 1.83 (SE 1.09) more follow up questions, 2.91 (SE 2.40) more total questions, and 0.012 (SE 0.0065) proportion of the time more on audience questions. The t-statistics for the individual Blair-Loy et al. [11] estimates are 1.8 or below: formally, the differences are not statistically significant, even before adjusting for multiplicity. Thus, our data and theirs agree in broad brush.
However, we disagree over the statistical and practical significance of the (generally) small observed differences. Blair-Loy et al. [11] find the gender differences to be statistically significant—but not on the basis of the t-statistics. Instead, they introduce an ungrounded parametric model for audience questions: zero-inflated negative binomial (ZINB), which they fit to the data by regression. They find the gender coefficient in a ZINB model to differ significantly from zero at significance level 0.05 for follow-up questions and at level 0.1 for total questions. Appendix B discusses differences in more detail, including differences in the data collection and the statistical analysis. It applies their parametric analysis to our data and shows that randomization P-values for the same test statistic are substantially larger, and that the parametric test may produce the spurious appearance of statistical significance.
DISCUSSION
Are interruptions bad?
So far we have considered whether there are gender differences in how audiences treat speakers. Generally, the observed differences are small and neither material nor statistically significant. However, we might also wonder whether asking women more questions than men disadvantages women at all. Blair-Loy et al. [11] suggest that women are disadvantaged by frequent audience questions.
Our study is observational, not a controlled experiment; it is hard to draw reliable causal inferences from observational data. However, our data suggest that (at least in some departments) questions reflect genuine interest in the talk: departments that spent more time asking female presenters questions also hired women more frequently during that time period. Table 1 shows that the proportion of female pre-tenure faculty in CEE, EECS, and IEOR is higher than the proportion of women in their applicant pools. These departments also spent more time questioning women than men. On the other hand, women and men spent equal time on questions in Physics, which hires women roughly in proportion to their representation in the applicant pool.
Furthermore, in CEE, faculty presenters who received offers generally were asked more questions during their talk than presenters who did not receive offers, which is consistent with the chair’s description of departmental culture (see Departmental culture). The median number of questions asked of presenters who received offers was larger than the median for presenters who did not receive offers by 2 acknowledged questions and 1 unacknowledged question. While more study is needed, these descriptive statistics suggest that, at least in CEE, candidates who receive more questions may be treated more favorably—not less favorably—in hiring decisions.
In summary, questions and interruptions could signal many different things, including:
audience interest, curiosity, engagement, or excitement
audience confusion, related to the audience’s familiarity with the material
audience confusion, related to the quality or clarity of the exposition
disrespect, hostility, or harassment
Our data suggest that all four of these things happen, depending on departmental culture.
Departmental culture
Descriptive statistics and our randomization test analysis indicated substantial differences in the way departments tend to act towards speakers—regardless of the speaker’s gender. For example, the median number of audience utterances was 9 for both male and female presenters in CEE whereas it was 23 and 24, respectively, for IEOR. In IEOR, talks by 3 of the 8 speakers (all men) had no formal Q&A period, but had many pre-Q&A questions.
For the Engineering departments, women generally spent more time on questions and were asked more questions (except in ME); however, these differences are small and not statistically significant. In Physics, male presenters generally spent more time on questions and comments and were asked more questions than female presenters, although the differences are not statistically significant.
We asked the department chairs to describe the general department question etiquette.
In CEE, the audience is encouraged to hold questions until the end of the talk. Audiences are generally courteous, but questions at the end of the talk are encouraged and better talks typically stimulate more questions.
In EECS, etiquette is evolving. For the years included in our analysis departmental culture embraced interrupting speakers during their talk.
In IEOR, questions are frequently asked during the talks. The culture condones asking questions and interrupting, especially if the question is clarifying.
In ME, questions are generally asked during talks. If there are too many questions in a row, the moderator might ask the audience to hold their questions.
In Physics, questions are encouraged and it is common to interrupt the speaker with clarifying questions during the talk. However, many audience members hold other kinds of questions until the end.
Leaky pipeline
Blair-Loy et al. [11] suggest that differences in audience interactions during academic job talks exemplify the “leaky pipeline.” But as Dupas et al. [13] points out, there is a difference between disparate treatment, i.e., whether the audience interacts differently with female versus male presenters, and disparate impact, i.e., whether job outcomes are different for equally qualified female and male applicants. We do not find gender based differences in our academic job talks (disparate treatment). We also note that all of the departments we analyzed interviewed a greater proportion of women than the proportion of women in their applicant pool. However, for some departments, the proportion of interviewees who are women is much larger than the proportion of pre-tenure faculty who are women. This indicates potential bias in making job offers (disparate impact), yield, or retention of junior female faculty; we do not examine the issue here.
Limitations
Presenter gender self-identification was not available to us, so we had to infer gender based on name, appearance and pronouns on presenter website (if available). We did not infer any of the presenters to be non-binary, so we were not able to analyze differences in audience interactions with non-binary presenters.
Some departments had video quality that was so poor, e.g., Statistics, that we were ultimately unable to use those videos in our analysis.
Ideally we would have liked to have stratified our analysis by year, but we were unable to do this due to small sample sizes. Therefore, we were unable to account for whether a department implemented bias training or specifically tried to diversify the faculty hiring process during the study period.
It is unclear to us what magnitude of difference is important. For example, is a difference of one question a material difference? We do not believe the median differences observed in this study are material.
CONCLUSION
Neither our main analysis (randomization tests with difference in the median number of questions asked of female and male presenters as the test statistic) nor our nonparametric calibration of a parametric test finds material or statistically significant differences in audience interaction with female versus male presenters (P-value ≥ 0.1).
Of course, women are discriminated against in other ways. Previous studies have shown that women and faculty from under-represented minority groups face conscious and unconscious biases in STEM and academia [3,4,8,17,18].
It is clear that commitment and leadership can bring large changes in gender equity in hiring in a relatively short period of time: three years after instituting systematic changes to recognize and value contributions to community engagement, fully 50% of the faculty hired by the College of Engineering were women.
Moreover, hiring is not the end of the story. For example, relying on student evaluations of teaching for employment decisions disadvantages women and other groups protected by employment law [3]. Universities must also pay attention to mentoring, assessment, and promotion to ensure that everyone is supported and evaluated fairly.