
Introduction and background
Previous studies have found evidence consistent with global extraterrestrial airbursts/impacts at the Younger Dryas onset (modeled age: 12,835–12,735 cal yr BP at 95% confidence interval) [1]. This estimated age range was determined using IntCal13, a previous calibration curve, rather than IntCal20, the current curve. However, that range differs only by ±0.4%, so it is retained here. This evidence includes elevated concentrations of multiple materials, including platinum [2–10], iridium [5, 7, 11–13], magnetic microspherules [5, 7, 12–15], meltglass [5, 13, 16], nanodiamonds [5, 13, 17–19], combustion aerosols and soot [5, 13, 20, 21]. These proxies have been found in sediment dated to the YDB in virtually every geomorphic setting, including multiple lithics-rich 12,800-year-old Paleoamerican archaeological sites across North America [12], as well as other sites in central Mexico [22], South America [23, 24], South Africa [25], Europe [12, 26–29], Greenland [11], the Middle East [5, 6, 13, 30, 31] and lacustrine, marine, and ice core records globally [20, 21].
In this study, sedimentary sequences from three widely separated Younger Dryas Boundary (YDB) sites in the eastern USA are sampled and analyzed in search of peak abundance anomalies of microspherules and platinum reported elsewhere in sequences dating to the YD onset (Figure 1). Spherule candidates were identified optically and verified using scanning electron microscopy (SEM) and energy dispersive x-ray spectroscopy (EDS). Platinum abundance was determined using fire assay (FA) and ICP-MS with a lower detection limit of 0.1 parts per billion (ppb). In addition, samples were analyzed for shock-fractured quartz grains indicative of high-temperature and high-pressure atmospheric detonations that could result from low-altitude bolide airbursts where the impact plume reaches the ground [32]. To investigate potential shock-fractured quartz candidates, we used multiple techniques, including scanning electron microscopy (SEM), cathodoluminescence (CL), energy-dispersive x-ray spectroscopy (EDS), electron backscatter detection (EBSD), ion beam milling (FIB), and transmission electron microscopy (TEM).
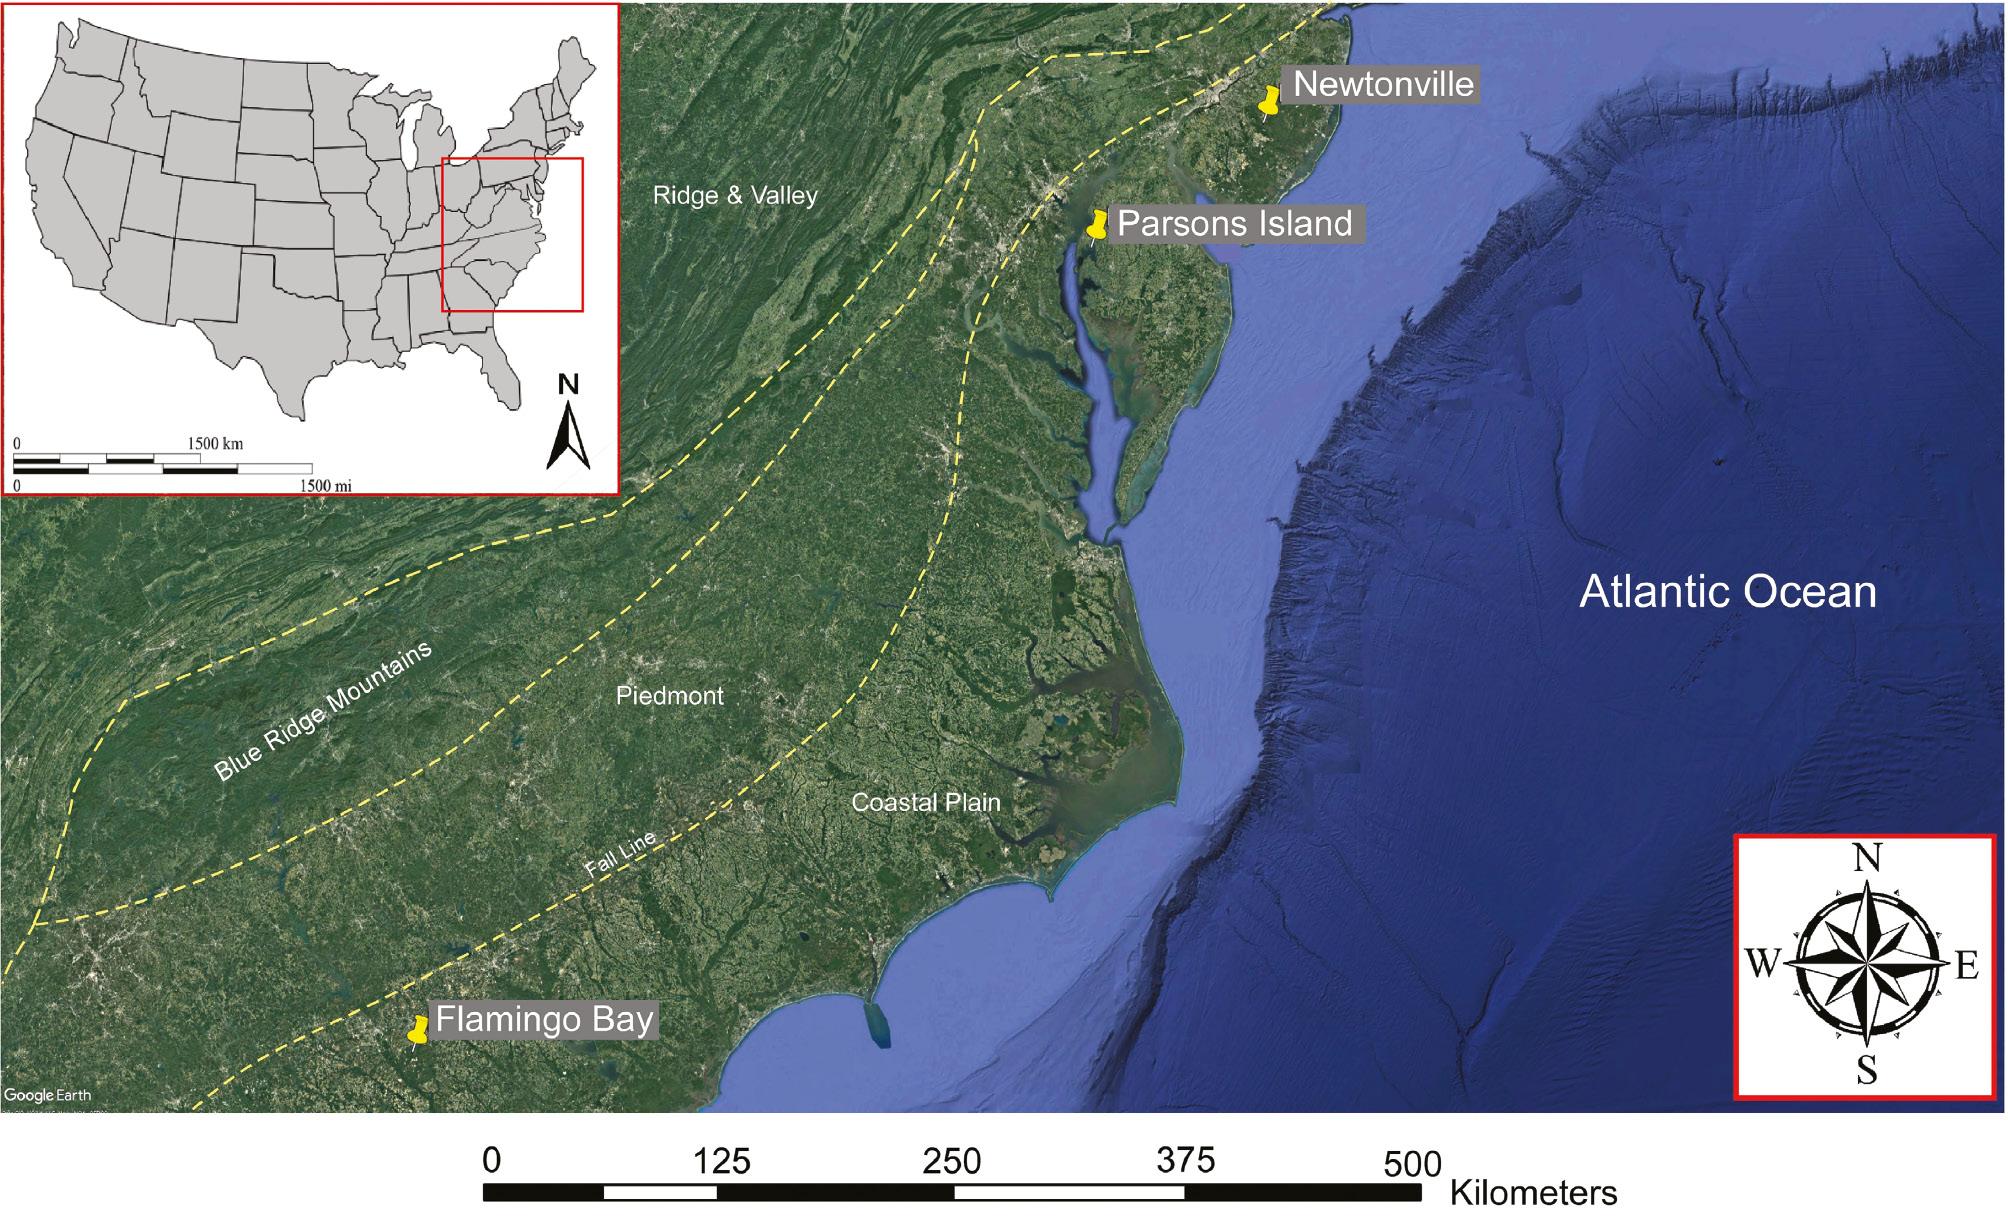
Locations of study sites along the Eastern Seaboard of the USA: Flamingo Bay (South Carolina), Parsons Island (Maryland), and Newtonville (New Jersey), a range of nearly 1000 km. The image was created using Google Earth, ArcGIS (v.10.4.1), and Canvas 11 (Build 1252) software.
Shock metamorphism in quartz grains
Multiple studies have described and compared the characteristics of geologic and impact-related metamorphic features observed in sedimentary quartz grains. Planar deformation features (PDFs) [33–44] display lamellae that are typically planar, parallel, crystallographically controlled, closely spaced at less than a few microns, form at >10 GPa, and often display amorphous silica. Planar fractures (PFs) [42, 45] are also typically planar, parallel, crystallographically controlled, and sometimes display amorphous silica, but form at <10 GPA and are usually spaced more than ∼10 μm apart. Tectonic deformation lamellae (DLs) [35, 36, 38, 41, 42, 46–50] are nearly always sub-planar, sub-parallel, rarely crystallographically controlled, and are not reported to contain amorphous silica. For more details, see Table 1 in Hermes et al. [32].
Radiocarbon and OSL dates for study sites.
| Site name | Method | Material | Context | Depth 1 | Radiocarbon age (BP) | Cal BP 2 | Range 95% CI | OSL age (ka) | Basis for age (OSL) | Number |
|---|---|---|---|---|---|---|---|---|---|---|
| Newtonville | AMS | GLC | Microstrat | 11–13 cmbd | 10,858 ± 34 | 12,783 ± 29 | 12,833–12,738 | — | — | D-AMS 043966 |
| Newtonville | AMS | GLC | Microstrat | 11–13 cmbd | 10,185 ± 25 | 11,852 ± 53 | 11,939–11,751 | — | — | UCI-250410 |
| Newtonville | AMS | GLC | Microstrat | 11–13 cmbd | 960 ± 20 | 853 ± 37 | 923–793 | — | — | UGA-65780 |
| Newtonville | AMS | CS | Microstrat | 11–13 cmbd | 960 ± 20 | 853 ± 37 | 923–793 | — | — | UGA-65781 |
| Parsons Island | AMS | Sediment | Profile | 40–45 cmbs | 10,753 ± 37 | 12,731 ± 14 | 12,757–12,702 | — | — | D-AMS 043965 |
| Parsons Island | OSL | Sediment | Profile | 65 cmbs | — | — | 17.4 ± 2.27 | 2nd Component (60% of grains) | UW-3800 | |
| Parsons Island | OSL | Sediment | Profile | 100 cmbs | — | — | 19.3 ± 1.56 | 2nd& 3rd components (90% of grains) | UW-3801 | |
| Parsons Island | OSL | Sediment | Profile | 130 cmbs | — | — | 21.2 ± 1.78 | 1st Component (98% of grains) | UW-3802 | |
| Parsons Island | OSL | Sediment | Profile | 160 cmbs | — | — | 24.2 ± 1.64 | 3rd component (74% of grains) | UW-3803 | |
| Parsons Island | OSL | Sediment | Profile | 180 cmbs | — | — | 24.6 ± 2.4 | 3rd components (43% of grains) | UW-3804 |
1cmbd=centimeters below datum; cmbs=centimeters below surface.
2INTCAL20.14 calibration.
Note. GLC=Glass Like Carbon, and CS=Carbon Spherules.
Previous studies of cosmic impact structures have described an additional type of shock metamorphism in quartz, variously called shock extension fractures [51–54], sub-planar shock fractures [48, 55], and vermicular (i.e., wormlike) microfractures [52, 54, 56]. Following previous studies [32, 57], we adopt “shock fractures” to denote microfractures in quartz produced by thermal and mechanical shock.
In contrast to PDFs, PFs, and tectonic lamellae, glass-filled shock fractures in quartz grains are intragranular cracks that are sub-parallel, sub-planar, a few microns wide, and filled with amorphous silica [6, 32, 44, 58–63]. Although some apparent shock fractures contain no detectable glass, this study focuses on fractures that are discontinuously filled with amorphous silica, a term we use interchangeably with “glass.”
It is crucial to note that, by definition, vermicular or wormlike shock microfractures are sub-planar and curvilinear in three dimensions. Thus, it is impossible to properly index their crystallographic orientations using a universal stage, a procedure typically used for investigating impact-shocked quartz grains.
Shock metamorphism in airbursts
Hermes et al. [32] investigated shock metamorphism in nuclear airbursts and summarized reports that key shocked minerals (e.g., feldspar [64], quartz [65, 66], and zircon [67]) display evidence of pressures from 60 to 5 GPa, sufficient to create shock metamorphism [32]. Several previous studies also report that the Trinity nuclear airburst produced shocked quartz [65, 66]. West et al. [57] used hydrocode modeling to show that hypervelocity fragments from a nuclear detonation and three types of low-altitude airburst events (called “touchdown” or Type 2 airbursts [68–70]) could strike the ground with sufficient energy to produce shocked quartz, as well as glass-filled, shock-fractured quartz.
To explain the formation of glass-filled, shock-fractured quartz, Kieffer [58, 59] proposed a process called “jetting,” in which molten quartz is injected under high pressure and high temperatures into shock-generated fractures in the grains. Wakita et al. [71] observed that during the early stages of an impact, molten material might be jetted when the impactor contacts target rocks. Hermes et al. [32] showed that nuclear airbursts can create a lower-pressure variety of glass-filled, shock-fractured quartz that does not require a typical crater-forming impact event.
Thus, evidence shows that glass-filled, shock-fractured quartz possibly was produced during YDB airbursts through the two processes discussed above: (i) ground surface impacts by hypervelocity fragments of the airburst bolide and (ii) jetting that filled grain fractures with molten material.
Shocked quartz in other YDB layers
Potential shocked quartz grains have been previously reported in YDB-age sediments from five sites, including one further analyzed here from Newtonville/Unexpected Pit (UP), New Jersey [72]. The other four sites are the MUM 7B site in Venezuela [24, 73], a site in Ossendrecht, the Netherlands [26], one in Aalsterhut, the Netherlands [74], and Abu Hureyra in Syria [6]. For the three sites in Venezuela and the Netherlands, the scope of the studies was limited and lacked a robust characterization of potential shocked quartz. For Aalsterhut, Van Hoesel [74] identified only one shocked quartz grain, and the authors speculated that this YDB-age grain had resulted from reworking (secondary deposition) from an older impact event. At Abu Hureyra, Moore et al. [6] identified multiple YDB glass-filled shock-fractured quartz grains using a comprehensive suite of analytical techniques. These results were attributed to low-altitude airbursts.
These investigations encouraged searching for shocked quartz in YDB sequences. We chose these three sites because the previously identified YDB cosmic impact layer allowed us to test the hypothesis that shock-fractured quartz grains, microspherules, platinum, and meltglass are widely distributed in the YDB layer along the Atlantic Coastal Plain of the United States.
Study sites
Newtonville site
The Newtonville site is located in southern New Jersey in an abandoned commercial sand pit (39° 34′ 4.6 N; 74° 54′ 36.5 W) within the New Jersey Pinelands National Reserve (PNR) (Figures 1 and 2). The PNR encompasses more than 1.1 million acres (4,500 square kilometers) of diverse habitats, including forests, wetlands, rivers, and estuaries. Established in 1978, PNR was the first National Reserve in the United States, designated by the U.S. Congress under the National Parks and Recreation Act.
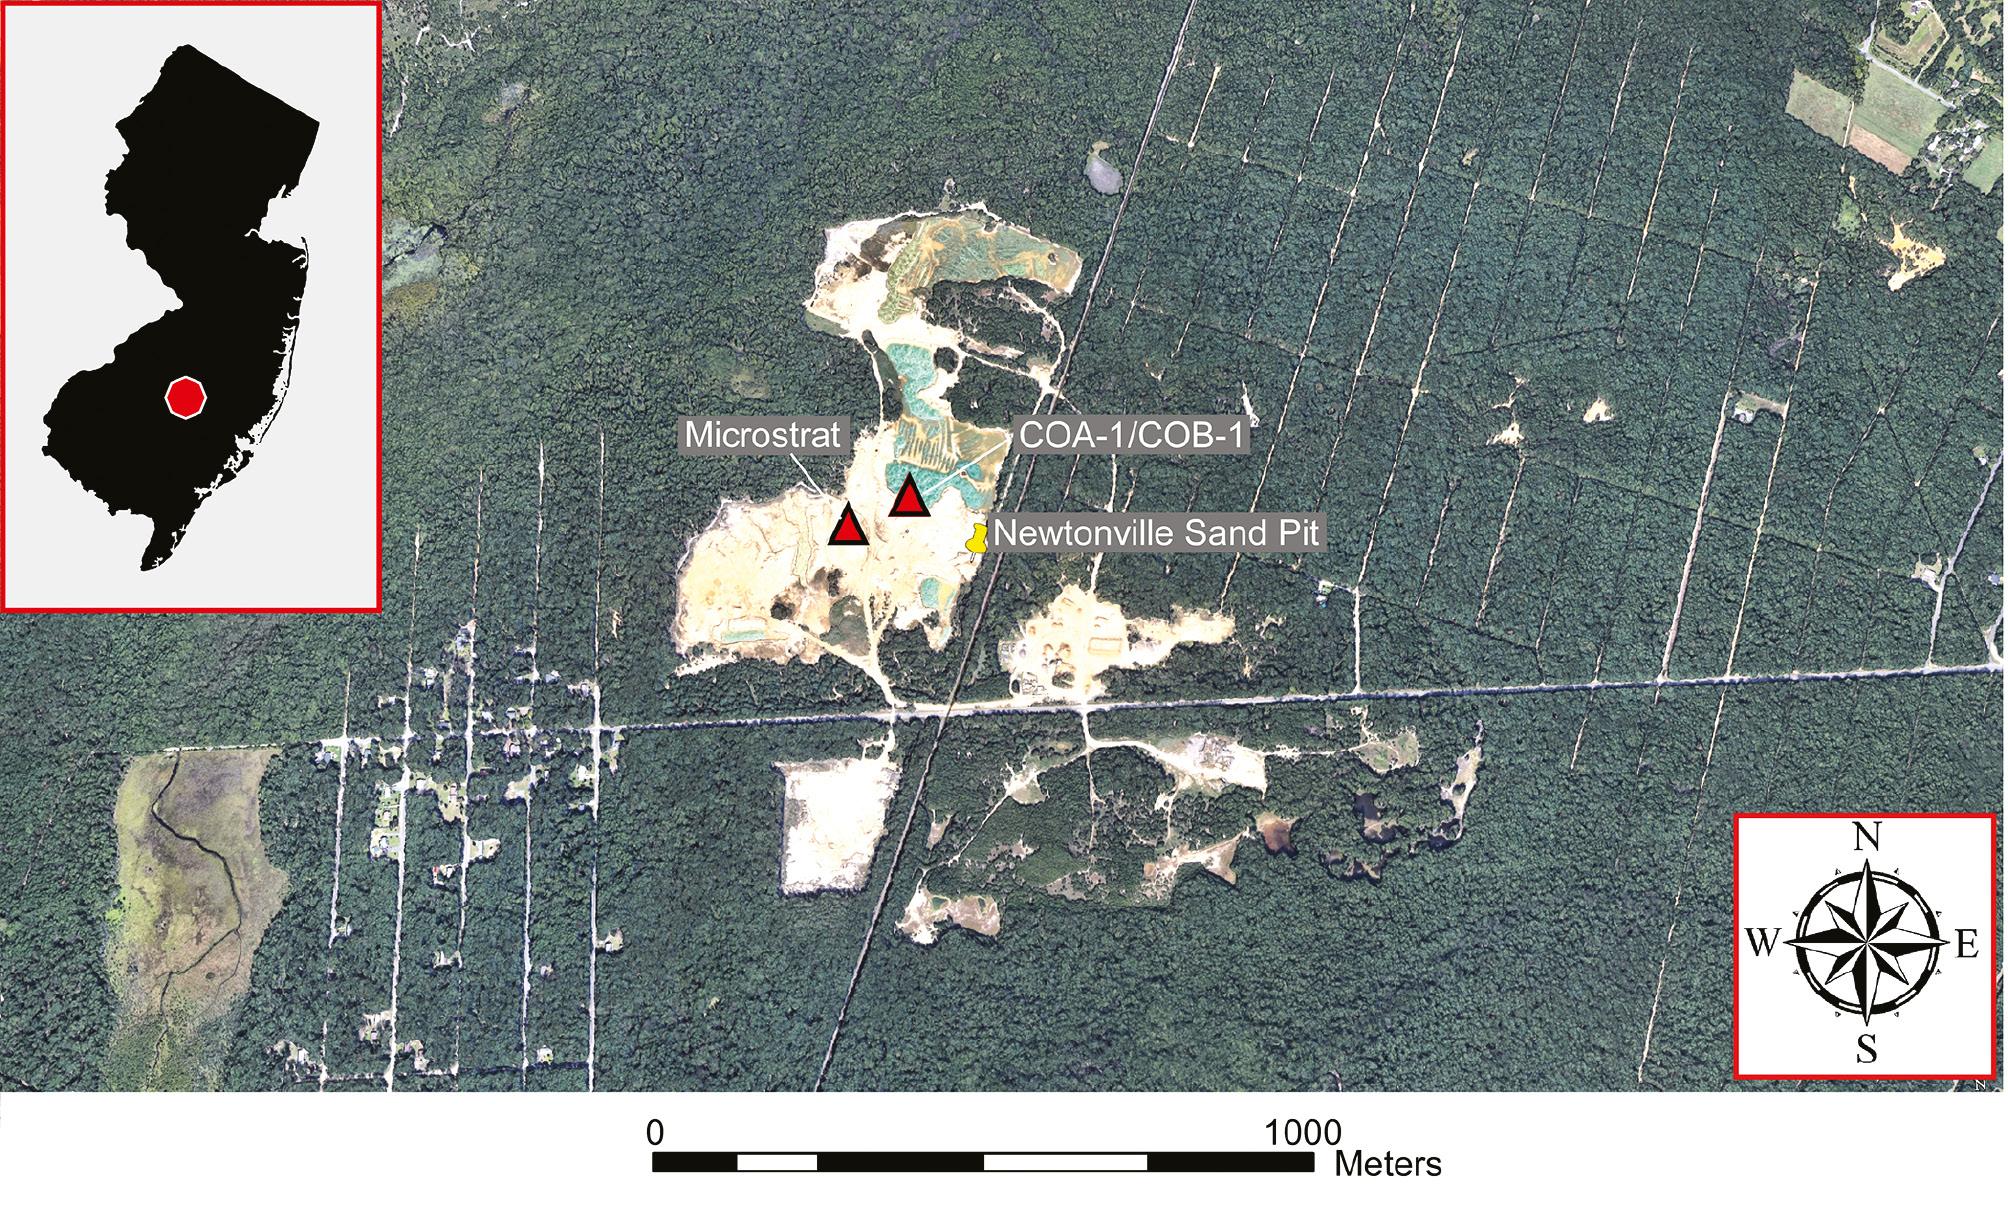
Areas sampled (microstrat and COA-1/COB-1) at Newtonville Sandpit in the New Jersey Pinelands National Reserve (PNR). The image was created using Google Earth and Canvas 11 (Build 1252) software.
The profiles sampled from the Newtonville sand pit sequence include those from a buried A-horizon beneath historic pit tailings (click on Supplementary Information Figure 1). Since the original land surface was scalped during historic mining activities, the depth below the original surface can only be estimated at ∼30–40 cm. Sediment samples for this study are from an intact microstratigraphic sediment block (herein called the “microstrat”) containing an organic-rich fluvially laminated soil layer with underlying yellow colluvial sand. Additional samples (COA-1 and COA-2; click on Supplementary Information Figure 1) are from the same stratigraphic layer collected from an exposed sandpit profile ∼130 m from the microstrat location.
Parsons Island site
Parsons Island is located within the northernmost waters of Chesapeake Bay in Queen Anne’s County, Maryland (38°54′31.24″N; 76°14′47.27″ W) (Figures 1 and 3; click on Supplementary Information Figure 2). The island is 6.5 km south of Kent Narrows and 15.7 km southeast of the Chesapeake Bay Bridge. The island includes forests, agricultural fields, marsh, tidal wetlands, mudflats, oyster bars, and submerged aquatic vegetation. Prior to the 1850s, Parsons Island was connected to the much larger Kent Island to the north. Due to continued and extensive coastal erosion, the landform dwindled from a 1.8 km2 peninsula of Kent Island in 1685 to its ∼0.3 km2 as an isolated island [75].
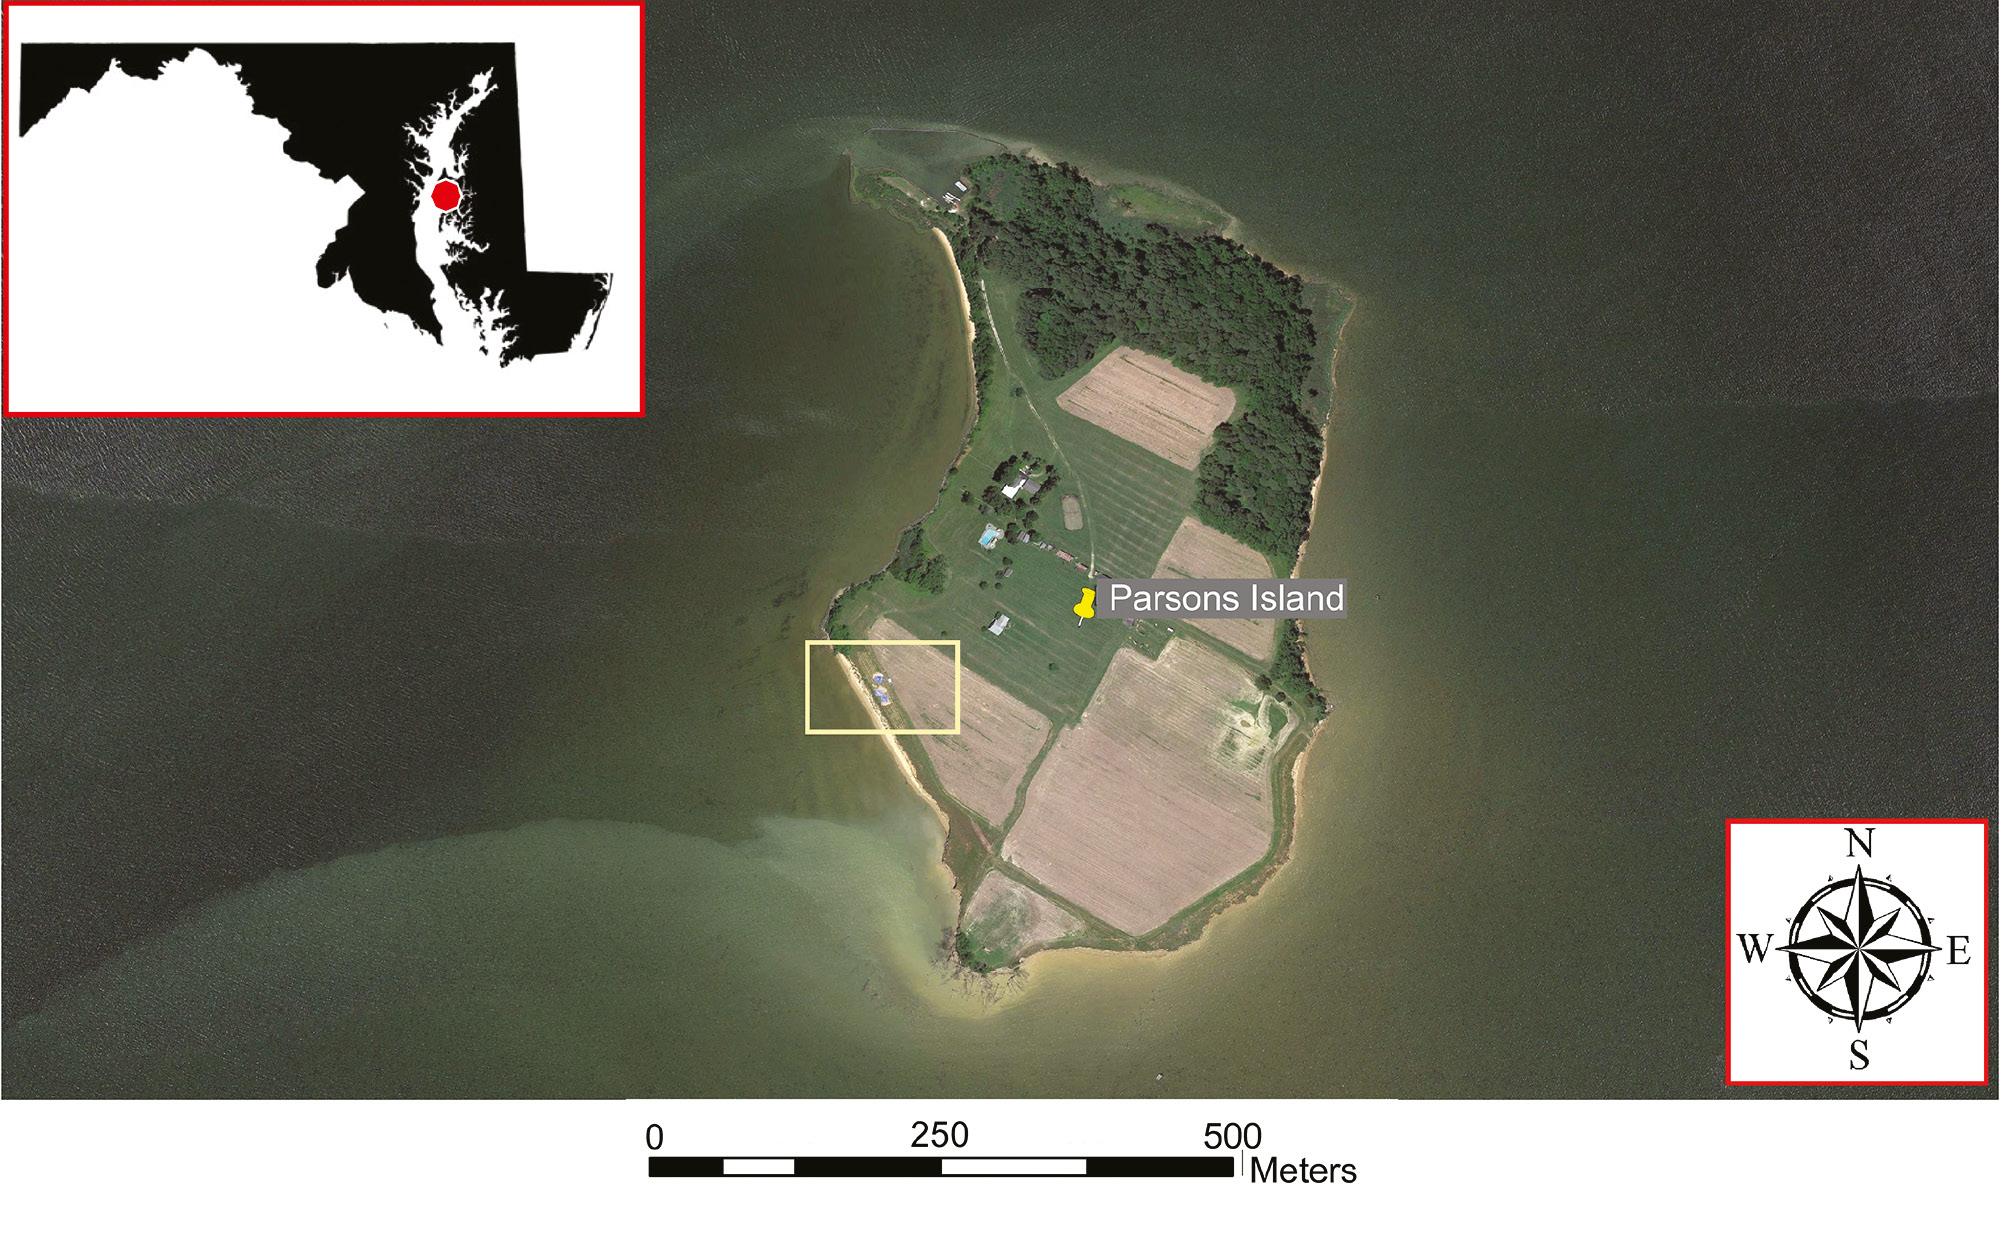
Area sampled at Parsons Island in the Chesapeake Bay, Maryland. The image was created using Google Earth and Canvas 11 (Build 1252) software. The yellow rectangle indicates the area of the bluff sampled.
The underlying sequence at Parsons Island is of late Pleistocene age and part of the Kent Island Formation that ranges in age from ∼60 to 29 kya (Marine Isotopic Stage 3). Shallow Holocene deposits of variable thickness overlay the Late Pleistocene sediments at Parsons Island and elsewhere in the Delmarva Peninsula and immediately overlie the Paw Paw Loess of Younger Dryas age discussed below. See Fig. 2.8 in Lowery [75].
Surficial aeolian deposits in the area are dominated by a terminal Pleistocene deposit known as the Paw Paw Loess [76] that was deposited during the cooler Younger Dryas climate episode dating from ∼12,800 to 11,600 years BP [75, 77, 78]. As discussed below, vitrified or ‘glasslike carbon’ (GLC) found at the base of the Paw Paw Loess at Parsons Island suggests upland loess deposition began at the Younger Dryas onset ∼12,731 ± 14 cal BP (D-AMS 043965; 95% range: 12,757–12,702 cal BP; 10,753 ± 37 radiocarbon years before present (rcybp, 1950). The median calibrated date, acquired for the stratum immediately above the YDB level, is, as expected, slightly younger than the established YDB age range and yet statistically isochronous with the YDB age of 12,835–12,735 cal BP (95% probability) reported by Kennett et al. [1].
The thickness of the Paw Paw Loess is regionally variable across the Delmarva Peninsula, ranging from ∼40 to 110 centimeters thick [79–81]. Prior to European contact, the Paw Paw Loess may have been much thicker in places but has been eroded due to agricultural development over the past 300 years [75].
Lowery [75] notes that: “… the surface contact between the Younger Dryas Paw Paw Loess and any underlying strata is represented by an unconformity. The erosional event that produced this unconformity may have had a duration of less than half a century.” This inference is based on Clovis artifacts from many sites along the Delmarva Peninsula in unconformable sediments immediately below the base of the Paw Paw Loess and the presence of sediments as old as 18 kya [78]. Lowery [75] also notes that “…the initial onset of the Younger Dryas circa 12,800 years ago seems to have markedly destabilized the region’s upland landscape. It is unclear what caused this significant upland erosion across such an extensive area. It is assumed that the destabilization and upland erosion are the result of marked climatic changes coupled with upland vegetation stress, as well as biota overgrazing.”
A portion of the Paw Paw Loess in a well-exposed bluff on a southwestern-facing shoreline at Parsons Island was sampled for sediment geochemistry, granulometry, and OSL dating in 2018 (Figure 3; click on Supplementary Information Figure 2). Sediment samples were collected at 5-cm intervals from the surface to greater than 180 cm below the surface (cmbs).
Flamingo Bay site (38AK469)
This site is located on the rim of Flamingo Bay, a Carolina Bay. This bay is on the U.S. Department of Energy’s (DOE) Savannah River Site (SRS) in the Upper Coastal Plain of South Carolina (33°20′14.13″N; 81°40′42.33″ W) (Figures 1 and 4).
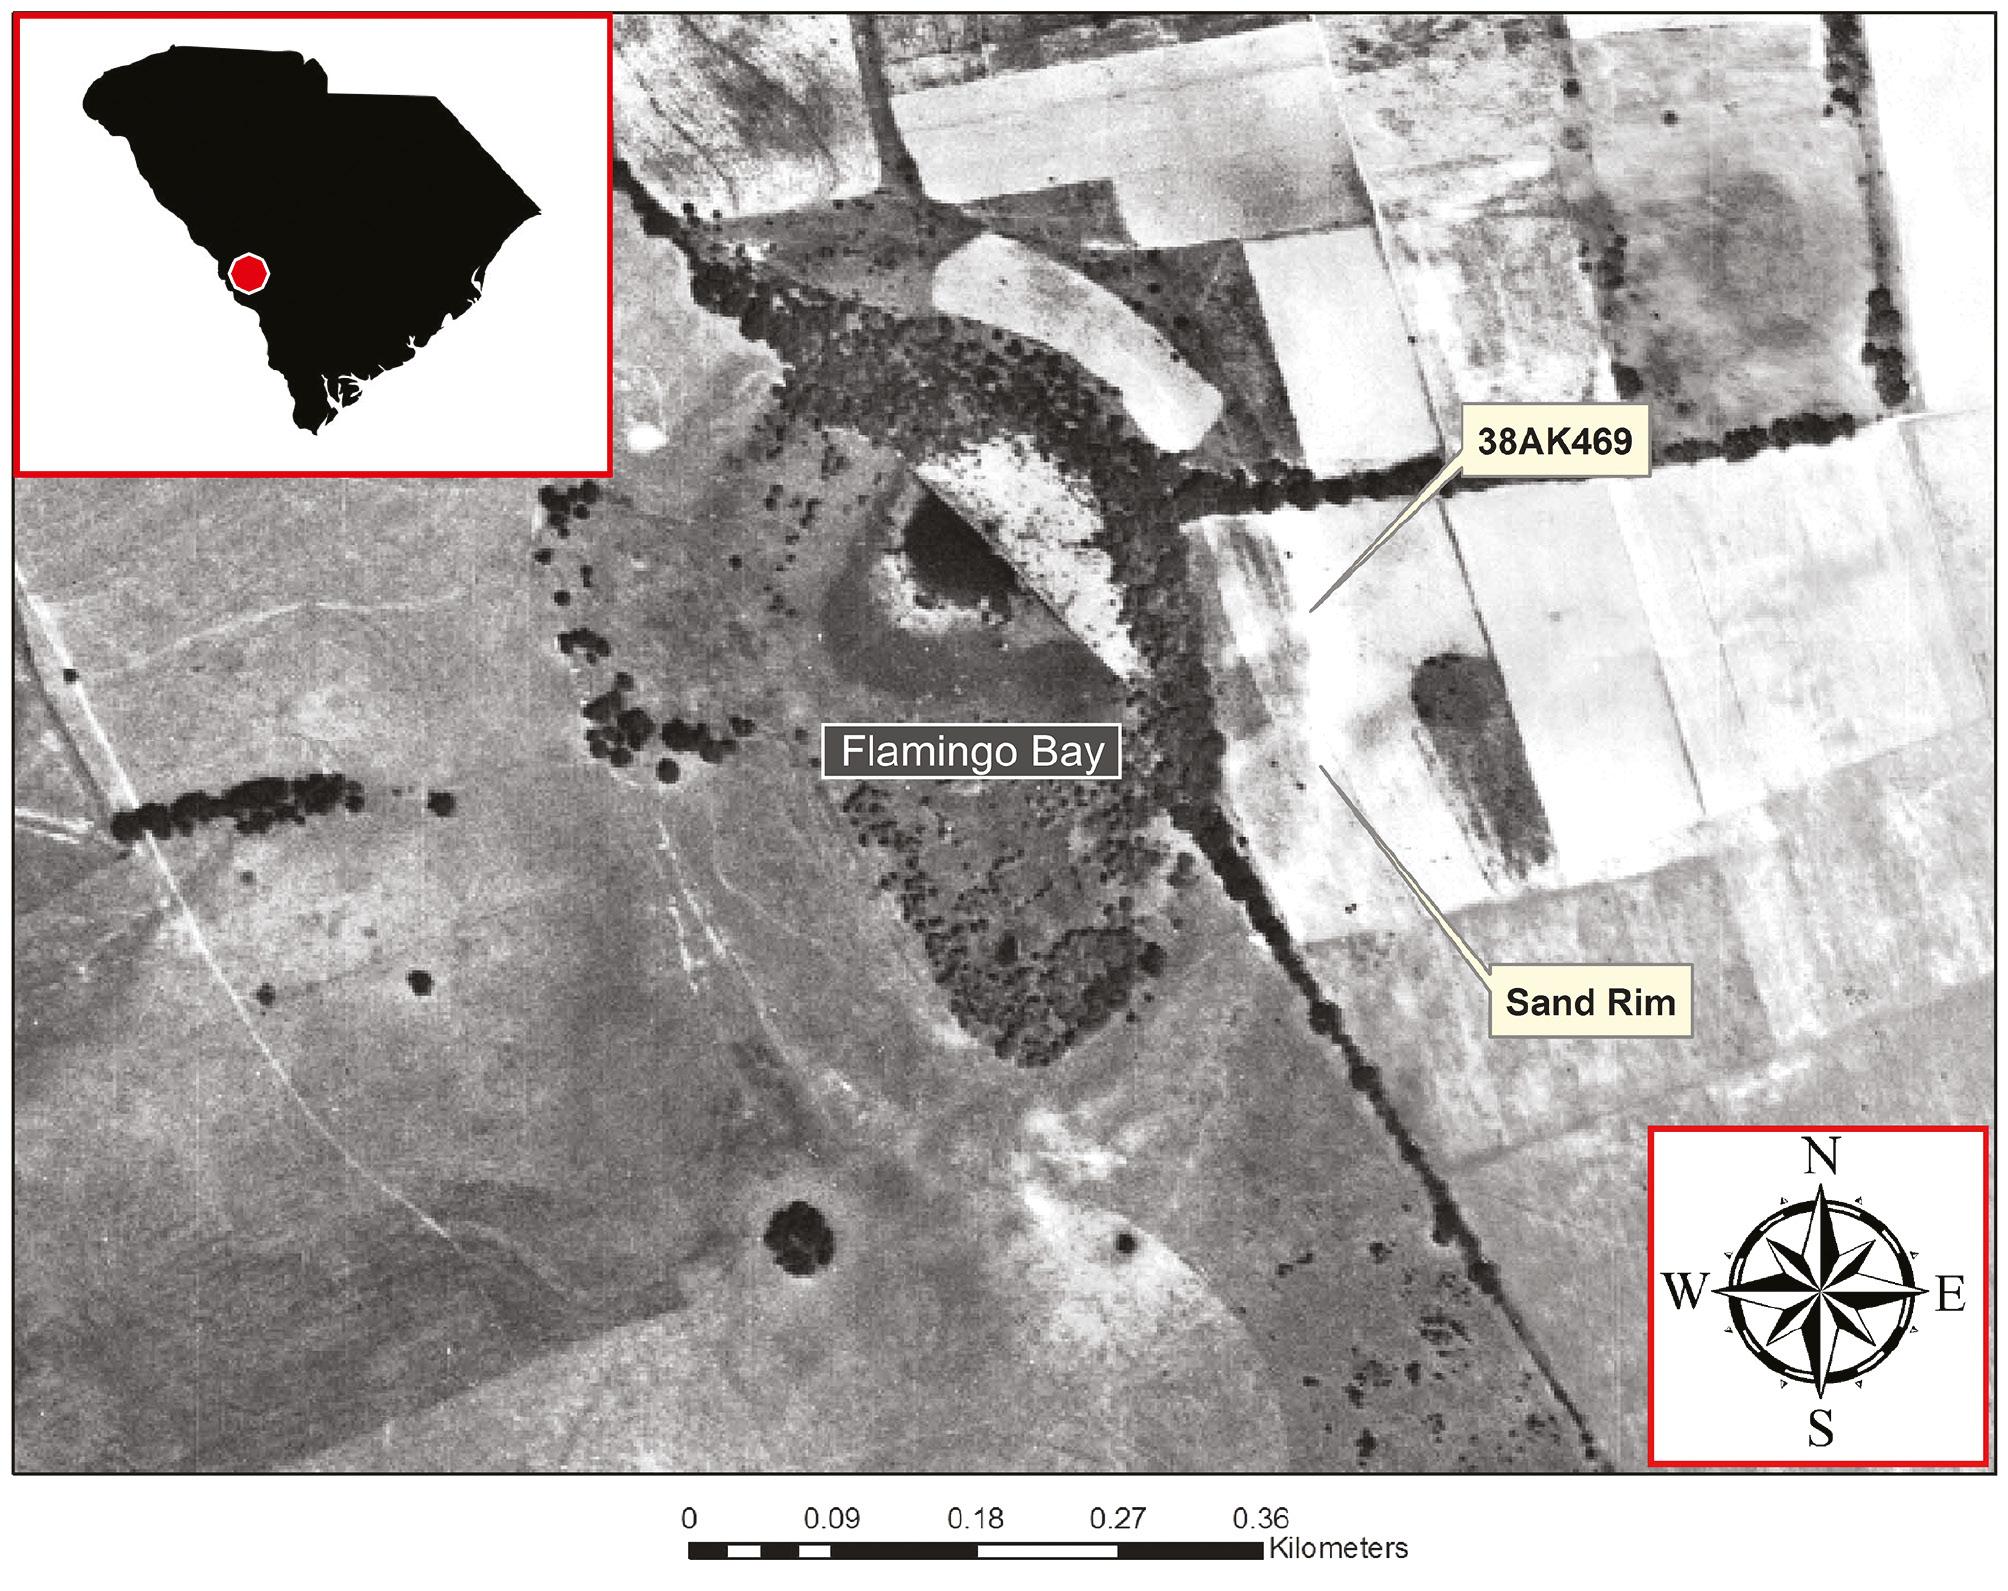
Aerial image showing the area sampled at Flamingo Bay at site 38AK469 on the Savannah River Site (SRS), Aiken County, South Carolina. The image was produced using historic aerial imagery with Canvas 11 (Build 1252) software.
Carolina bays are shallow, elliptically shaped wetland depressions (ponds or lakes) oriented (NW-SE in the Carolinas) and occur in large numbers throughout the Coastal Plain portion of the South Atlantic Slope [82–86]. Several hundred thousand bays exist between Maryland and northern Florida, with the greatest concentrations in the Carolinas and Georgia [87]. Carolina bays often exhibit elevated rims represented by fine sand to gravel-sized sediments. Although there are multiple hypotheses about bay origins, the preferred hypothesis proposes that these sediments were deposited by high-energy, lacustrine (lake) processes involving shoreface (water-lain) and eolian (wind-blown) sedimentation [83, 88–91].
Optically stimulated luminescence (OSL) dates from Flamingo Bay [92] suggest initial formation at 108.7 ± 10.9 ka BP followed by rejuvenation at 40.3 ± 4.0 ka BP (click on Supplementary Information Figure 3). The shallow burial of in-situ archaeological assemblages on the sand rim at Flamingo Bay and other Carolina Bays indicate continued low rates of eolian deposition into the Holocene and/or the small-scale reworking of existing eolian sediments through slope-wash [88].
The eastern sand rim of Flamingo Bay contains a shallowly stratified multicomponent archaeological site (38AK469). Paleoamerican artifacts, including Clovis points and tools, have been excavated below more recent Archaic, Woodland, and Mississippian occupations. Dating at Flamingo Bay has been difficult due to the acidic and heavily leached sandy sediments. No radiocarbon dates of Paleoamerican age have been obtained from the site, and OSL age estimates have provided ages with large uncertainties; however, the stratigraphic level for Early Paleoindian (i.e., Clovis technocomplex), dating to ∼13,050 to 12,750 cal BP [93], occurs at ∼50–55 cmbs in the area of the block excavation where sediment samples were collected.
In a previous study [3], a large Pt peak anomaly and smaller Pt/Pd anomaly at Flamingo Bay coincide with the uppermost range of Clovis artifacts at ∼50–55 cmbs. Based on abundance anomalies of Pt in well-dated western and Midwestern YDB sites, the abundance anomaly depth at Flamingo Bay is consistent with the onset of the Younger Dryas.
Sediment samples were collected at Flamingo Bay (38AK469) in continuous 2.5-cm intervals to a depth of 90 cmbs. These samples were previously tested for Pt and shown to have significant Pt and Pt/Pd peaks in one sample at ∼50–55 cmbs, consistent with the age of YD onset [3]. This study examined samples bracketing the YDB layer (and Pt anomaly) (40–60 cmbs) for microspherules, meltglass, and shock-fractured quartz presence.
Results
Newtonville
Multiple analyses were conducted on a fluvially laminated microstratigraphic sedimentary block (microstrat; size of ∼25 × 30 × 30 cm) removed from the sequence and on samples collected from a sandpit profile exposure called COA-1 and COB-1, which were ∼130 m apart (Figures 1 and 2). From the microstrat block, sediments were sampled in contiguous 2-cm intervals. Analysis of these samples revealed a large microspherule abundance peak (∼4500/kg; click on Supplementary Information Table 1; Figures 5–7 and Supplementary Information Figures 4–18), including a titanomagnetite spherule (Supplementary Information Figure 19) and a rare zircon spherule that has not been previously reported for the YDB layer (Supplementary Information Figure 20). The second sample location, called COA-1 and COB-1 (see Figure 2), produced ∼10,000 microspherules/kg in COA-1 (Supplementary Information Table 1). Sample COB-1 is stratigraphically deeper than COA-1 and contains significantly fewer microspherules (∼2,000/kg) and no other proxies (Supplementary Information Figure 1). Other than in COB-1, few microspherules were observed above or below this peak. Microspherules ranged from <1 to over 100 μm in diameter, with most between 10 and 25 μm. For this site, we use this stratigraphic reference level system rather than cm below surface (cmbs) because the original surface has been scalped during mining activities. In the microstrat block, a microspherule peak at 11–13 cm below datum (cmbd) represents the YDB layer (age range of 12,835–12,735 cal BP), as supported by an AMS date on glasslike carbon (GLC) from the microspherule peak layer (12,783 ± 29 cal BP; 95% range 12,833–12,738 cal BP) (Table 1). There are anomalously young AMS dates on GLC and carbon spherules that were measured from this YDB-aged sample. These likely result from the downward redeposition of charcoal from recent fire events (click on Supplementary Information Figure 1).
![Newtonville microstratigraphic block distribution of cosmic-impact-related proxies. Pt (ppb = ±0.1); YDB-aged microspherules (peak = 4,483/kg); shock-fractured quartz and meltglass in the Newtonville, New Jersey sedimentary section across the onset of the YD. This level marks the boundary (12,783 cal BP) between late Pleistocene colluvium (brown) and the YD gray sediments in the microstratigraphic block sampled at 2-cm intervals. The stratigraphic level of shock-fractured quartz is from sample COA-1 at the base of the gray sediment layer (click on Supplementary Information Figure 1), a YDB AMS date (12,783 ± 29 cal BP; 95% range: 12,833–12,738 cal BP on glasslike carbon (GLC) and the level of the microspherule peak. The dendritic microspherule image (a) was produced using SEM, and the shock-fractured quartz grain image (b) is an optical image using transmitted light (click on Supplementary Information Table 1). Meltglass fragments (click on Supplementary Information Figures 21–22), indicated by the symbol, peaked in the YDB layer, with a few above the YDB likely due to redeposition. The background image shows the intact sedimentary block (∼25 × 30 × 20 cm) surrounded by loose sediment from the sandpit profile where it was detached. Since sandpit mining operations scalped the original surface, sample depths are shown as centimeters below datum (cmbd). The base of gray sediment is estimated to have been 30–40 cm below the current surface (cmbs) [94].](/document_file/c8acd93e-88a9-43fb-b83e-8086b1baf4f3/ScienceOpen/image/aci20240003_fig5.jpg)
Newtonville microstratigraphic block distribution of cosmic-impact-related proxies. Pt (ppb = ±0.1); YDB-aged microspherules (peak = 4,483/kg); shock-fractured quartz and meltglass in the Newtonville, New Jersey sedimentary section across the onset of the YD. This level marks the boundary (12,783 cal BP) between late Pleistocene colluvium (brown) and the YD gray sediments in the microstratigraphic block sampled at 2-cm intervals. The stratigraphic level of shock-fractured quartz is from sample COA-1 at the base of the gray sediment layer (click on Supplementary Information Figure 1), a YDB AMS date (12,783 ± 29 cal BP; 95% range: 12,833–12,738 cal BP on glasslike carbon (GLC) and the level of the microspherule peak. The dendritic microspherule image (a) was produced using SEM, and the shock-fractured quartz grain image (b) is an optical image using transmitted light (click on Supplementary Information Table 1). Meltglass fragments (click on Supplementary Information Figures 21–22), indicated by the symbol, peaked in the YDB layer, with a few above the YDB likely due to redeposition. The background image shows the intact sedimentary block (∼25 × 30 × 20 cm) surrounded by loose sediment from the sandpit profile where it was detached. Since sandpit mining operations scalped the original surface, sample depths are shown as centimeters below datum (cmbd). The base of gray sediment is estimated to have been 30–40 cm below the current surface (cmbs) [94].
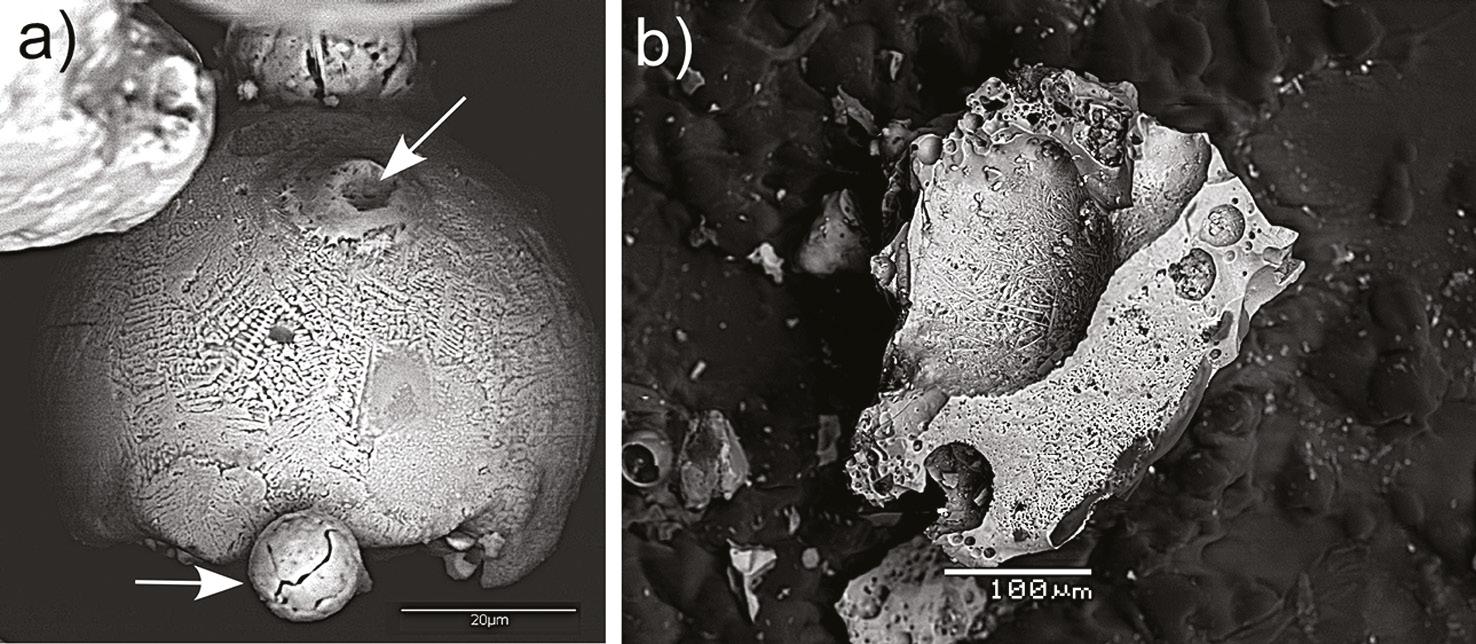
SEM images of (a) dendritic iron (Fe) microspherules and (b) vesicular aluminosilicate meltglass fragment from YDB-aged COA-1 sample, Newtonville sand pit (click on Supplementary Information Figure 1). Arrows in (a) call attention to multiple spherules and a secondary spherule with a dimple caused by impact momentum.
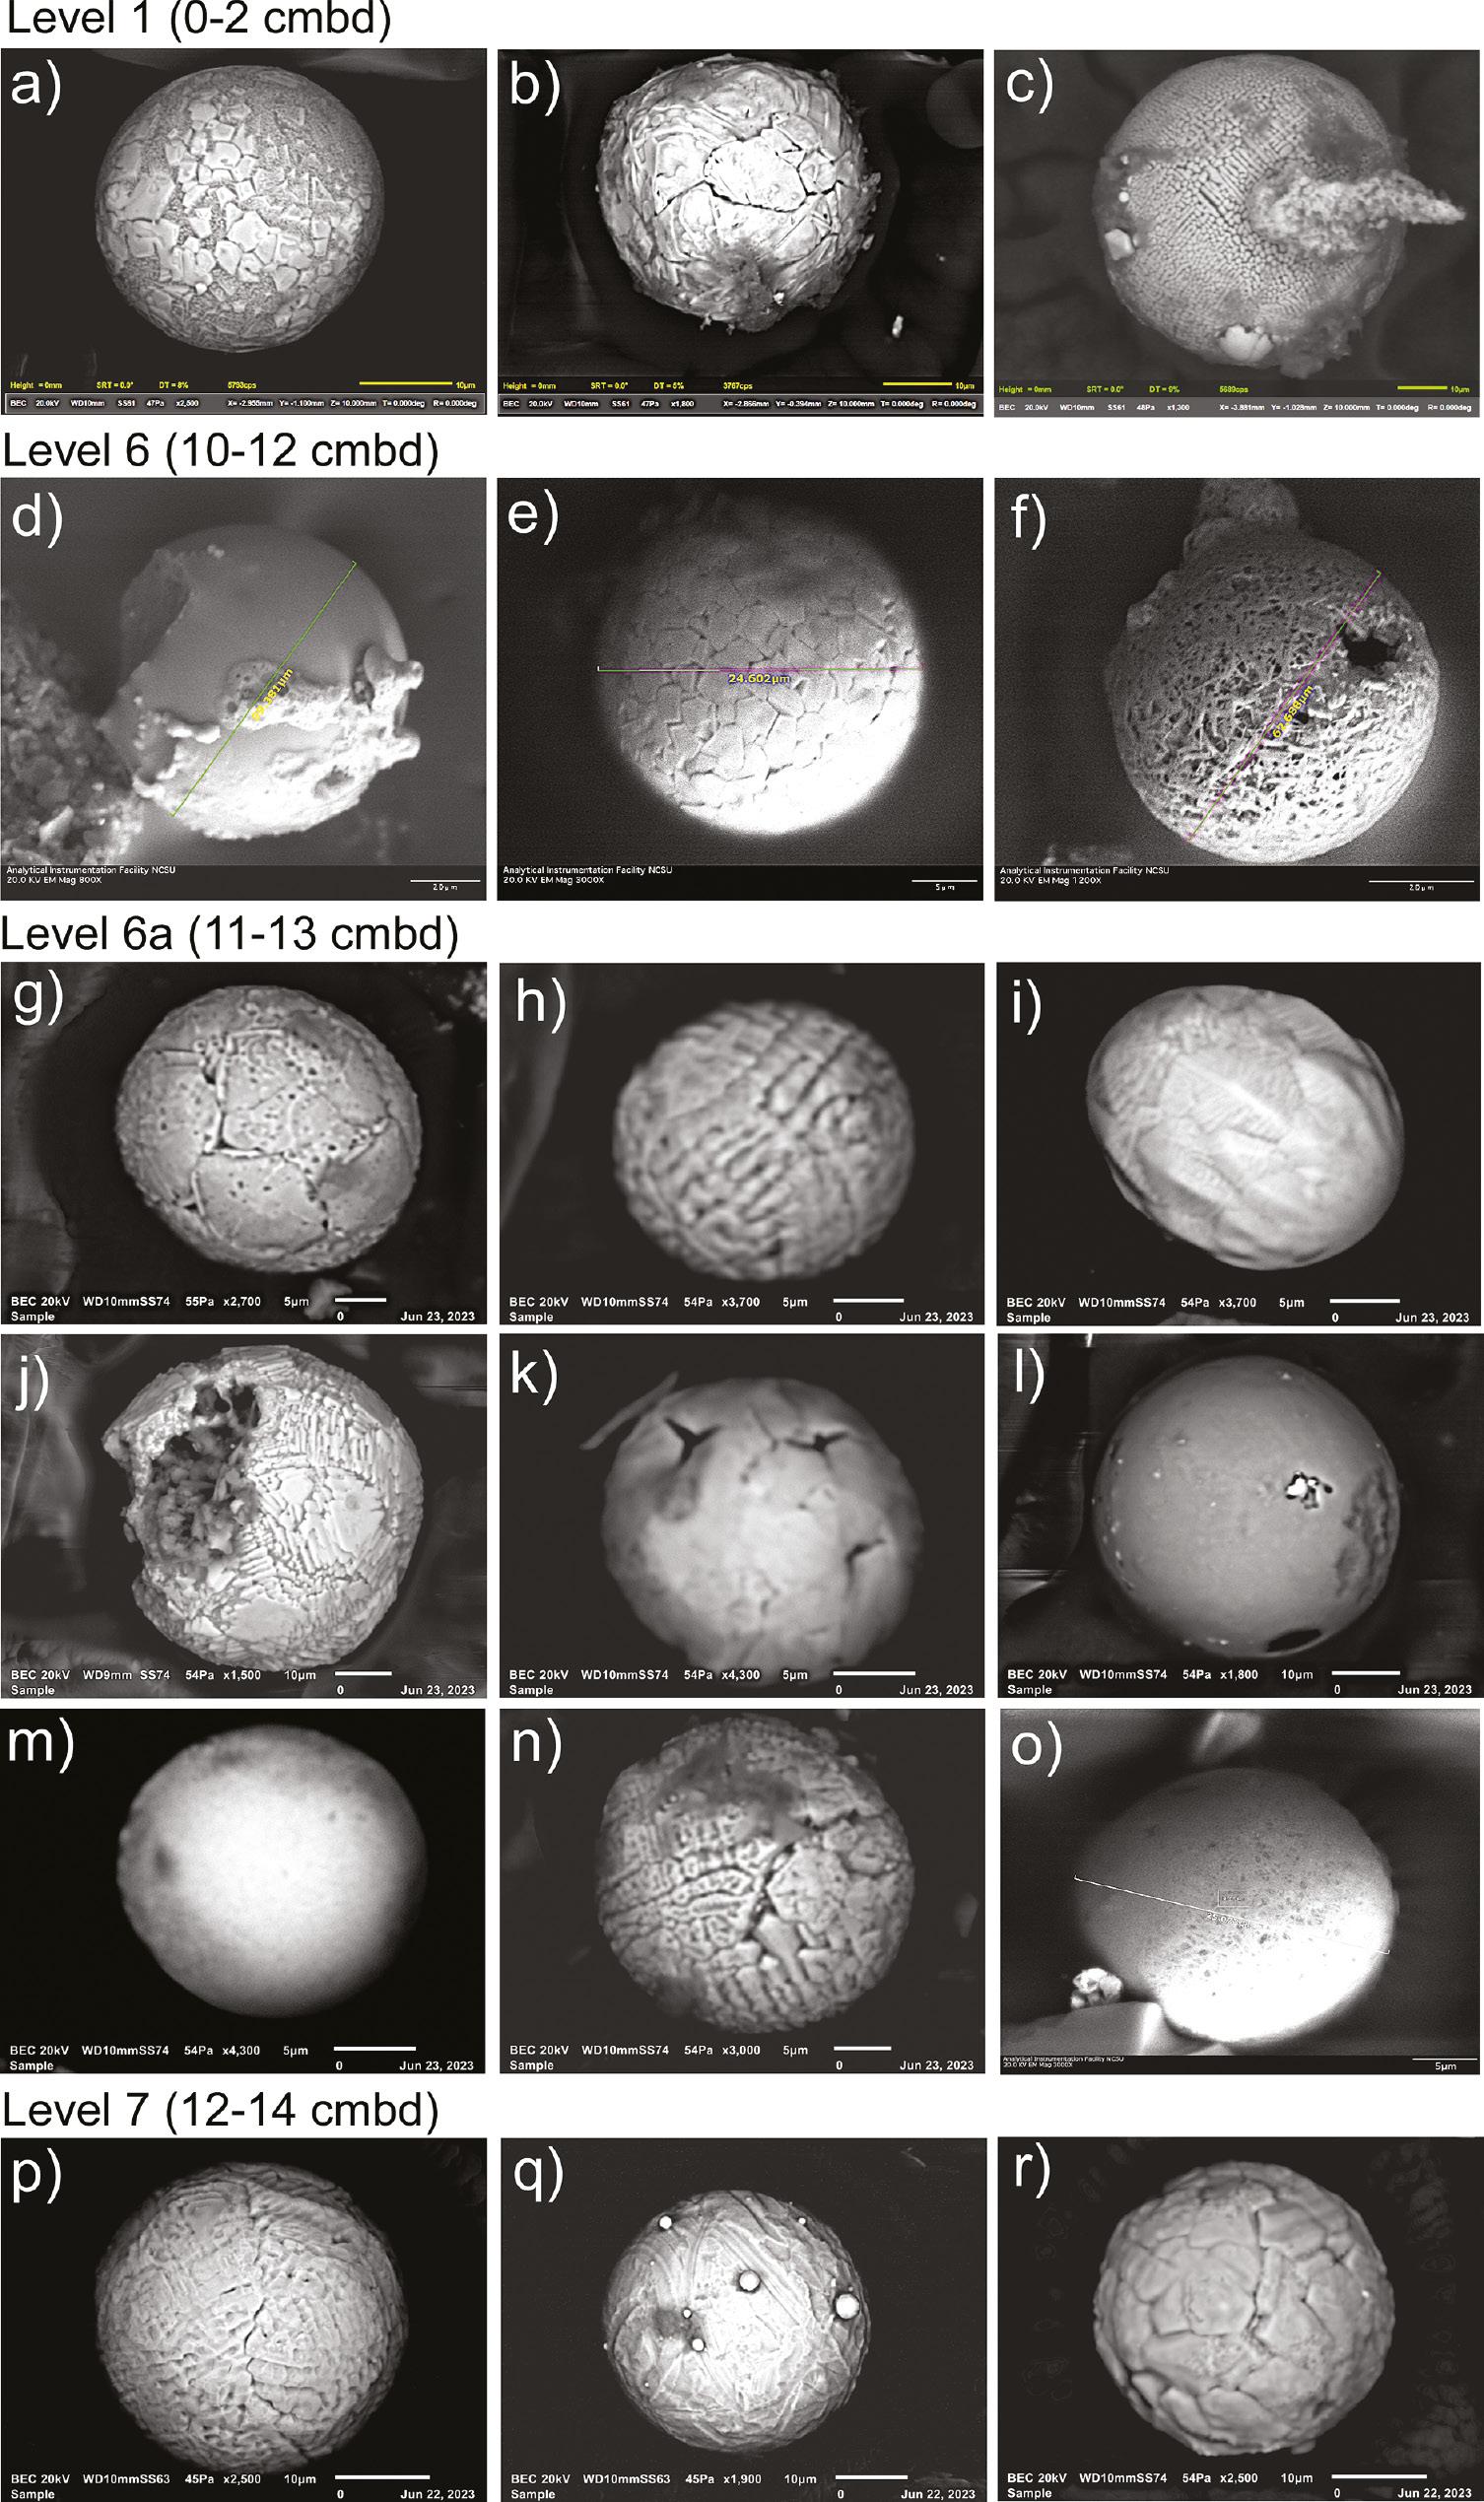
Examples of magnetic microspherules from Newtonville recovered from the microstratigraphic sediment block samples (a-r) taken at 2-cm intervals (see Figures 5, 6, click on Supplementary Information Table 1, and Supplementary Information Figures 4–20). Microspherule abundances (e.g., 13/kg) are much lower above and below the YDB peak (4483/kg) (click on Supplementary Information Table 1), and their presence likely results from redeposition. Microspherule surface features are variable, with most exhibiting dendritic patterns.
The YDB layers in the microstrat block and COA-1 are marked by other criteria indicative of high pressures and temperatures. These include the following:
Anomalously high Pt peaks.
Meltglass fragments in COA-1 (Figure 6b) and microstrat layers (click on Supplementary Information Figures 21, 22).
A fractured zircon grain (click on Supplementary Information Figures 23–25), displaying fracture infilling likely produced by abrupt high-temperature melting and quenching.
Melted ulvöspinel, an iron-titanium oxide mineral (TiFe2O4; click on Supplementary Information Figure 26) that forms at very high temperatures. Harris and Schultz [95, 96] concluded that this melted mineral is consistent with the anomalously high temperatures and pressures associated with airbursts or impact events. This interpretation is consistent with the associated high-temperature mineral assemblages at the Newtonville site.
Multiple anomalous elemental peak abundances (click on Supplementary Information Figure 27) with siderophile and rare earth elements, including chromium, samarium, cobalt, cadmium, neodymium, gadolinium, and scandium (click on Supplementary Information Figure 27a).
Anomalously enriched potassium, silicon, aluminum, calcium, and sulfur values are also enriched in the YDB layer containing abundant spherules and meltglass but depleted relative to non-adjacent samples (click on Supplementary Information Figure 27b–d).
Phosphorus also exhibits an abundance peak in a microstrat sample immediately above the base of the YD (click on Supplementary Information Figure 27b–d).
Quartz grains with potential planar deformation features (PDFs) were previously identified [17] based on optical transmission microscope images in COA-1 (click on Supplementary Information Figure 28). Furthermore, based on advanced techniques, we have confirmed the presence of such shock-fractured quartz grains in this layer, which is discussed in detail below (click on Supplementary Information Figures 29–30).
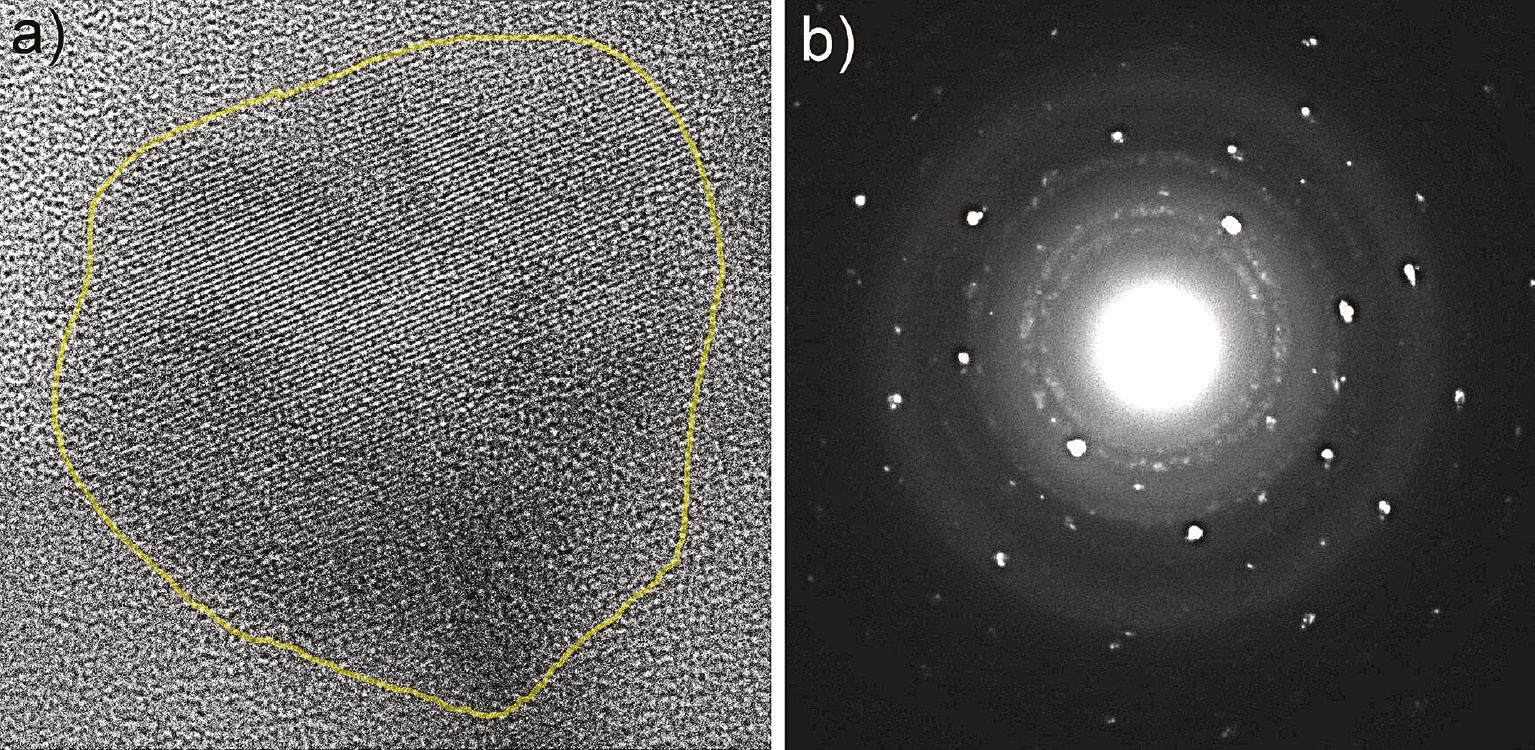
TEM image (a) and selected area diffraction pattern (SAD) (b) of an n-diamond from COA-1 sample at Newtonville sand pit (click on Supplementary Information Figure 1).
Parsons Island site
The Parsons Island site is represented by a sequence of contiguous 5-cm samples from the Paw Paw Loess. This layer sits above significantly older sediments below and underlies a sequence of disturbed sediments of the Ap horizon/plowzone (Figures 3, 9, and Supplementary Information Figure 2). The base of the Paw Paw Loess (45–50 cm at this site) is the YDB layer based on the following criteria:
![Parsons Island Sequence. Lithology, ages (radiocarbon & OSL), the abundance distribution of microspherules, Pt, shock-fractured quartz, and meltglass. The AMS date (12,731 ± 14 cal BP; 95% range: 12,757–12,702 cal BP; on glasslike carbon (GLC) collected from sample 40–45 cmbs, and (a) the Bayesian modeled median age of the Pt abundance anomaly (12,835–12,735 cal BP; 12,785 ± 50 cal BP at 95% confidence interval) documented at YDB sites across North America [1]. (b) SEM image of a dendritic microspherule; (c) cathodoluminescence (CL) image of shock-fractured quartz grain. Blue represents natural quartz that has not been melted; orange represents quartz that has been melted and then annealed; black represents fractures filled with amorphous silica.](/document_file/c8acd93e-88a9-43fb-b83e-8086b1baf4f3/ScienceOpen/image/aci20240003_fig9.jpg)
Parsons Island Sequence. Lithology, ages (radiocarbon & OSL), the abundance distribution of microspherules, Pt, shock-fractured quartz, and meltglass. The AMS date (12,731 ± 14 cal BP; 95% range: 12,757–12,702 cal BP; on glasslike carbon (GLC) collected from sample 40–45 cmbs, and (a) the Bayesian modeled median age of the Pt abundance anomaly (12,835–12,735 cal BP; 12,785 ± 50 cal BP at 95% confidence interval) documented at YDB sites across North America [1]. (b) SEM image of a dendritic microspherule; (c) cathodoluminescence (CL) image of shock-fractured quartz grain. Blue represents natural quartz that has not been melted; orange represents quartz that has been melted and then annealed; black represents fractures filled with amorphous silica.
A large peak in microspherules (500/kg) (click on Supplementary Information Table 2, Figures 9, 10, and Supplementary Information Figures 31–40).
A peak in Pt.
Meltglass fragments (click on Supplementary Information Figure 41).
Shock-fractured quartz grains, as discussed in detail below. No glass-filled fractures in quartz grains were observed immediately above or below the YDB layer. The results of the granulometry and sediment geochemistry (δ13C, δ15N, and C/N ratios are shown in Supplementary Information Figures 42 and 43) and discussed in the Supplementary Information, “Parsons Island Bulk Sedimentary Organic Geochemistry.”
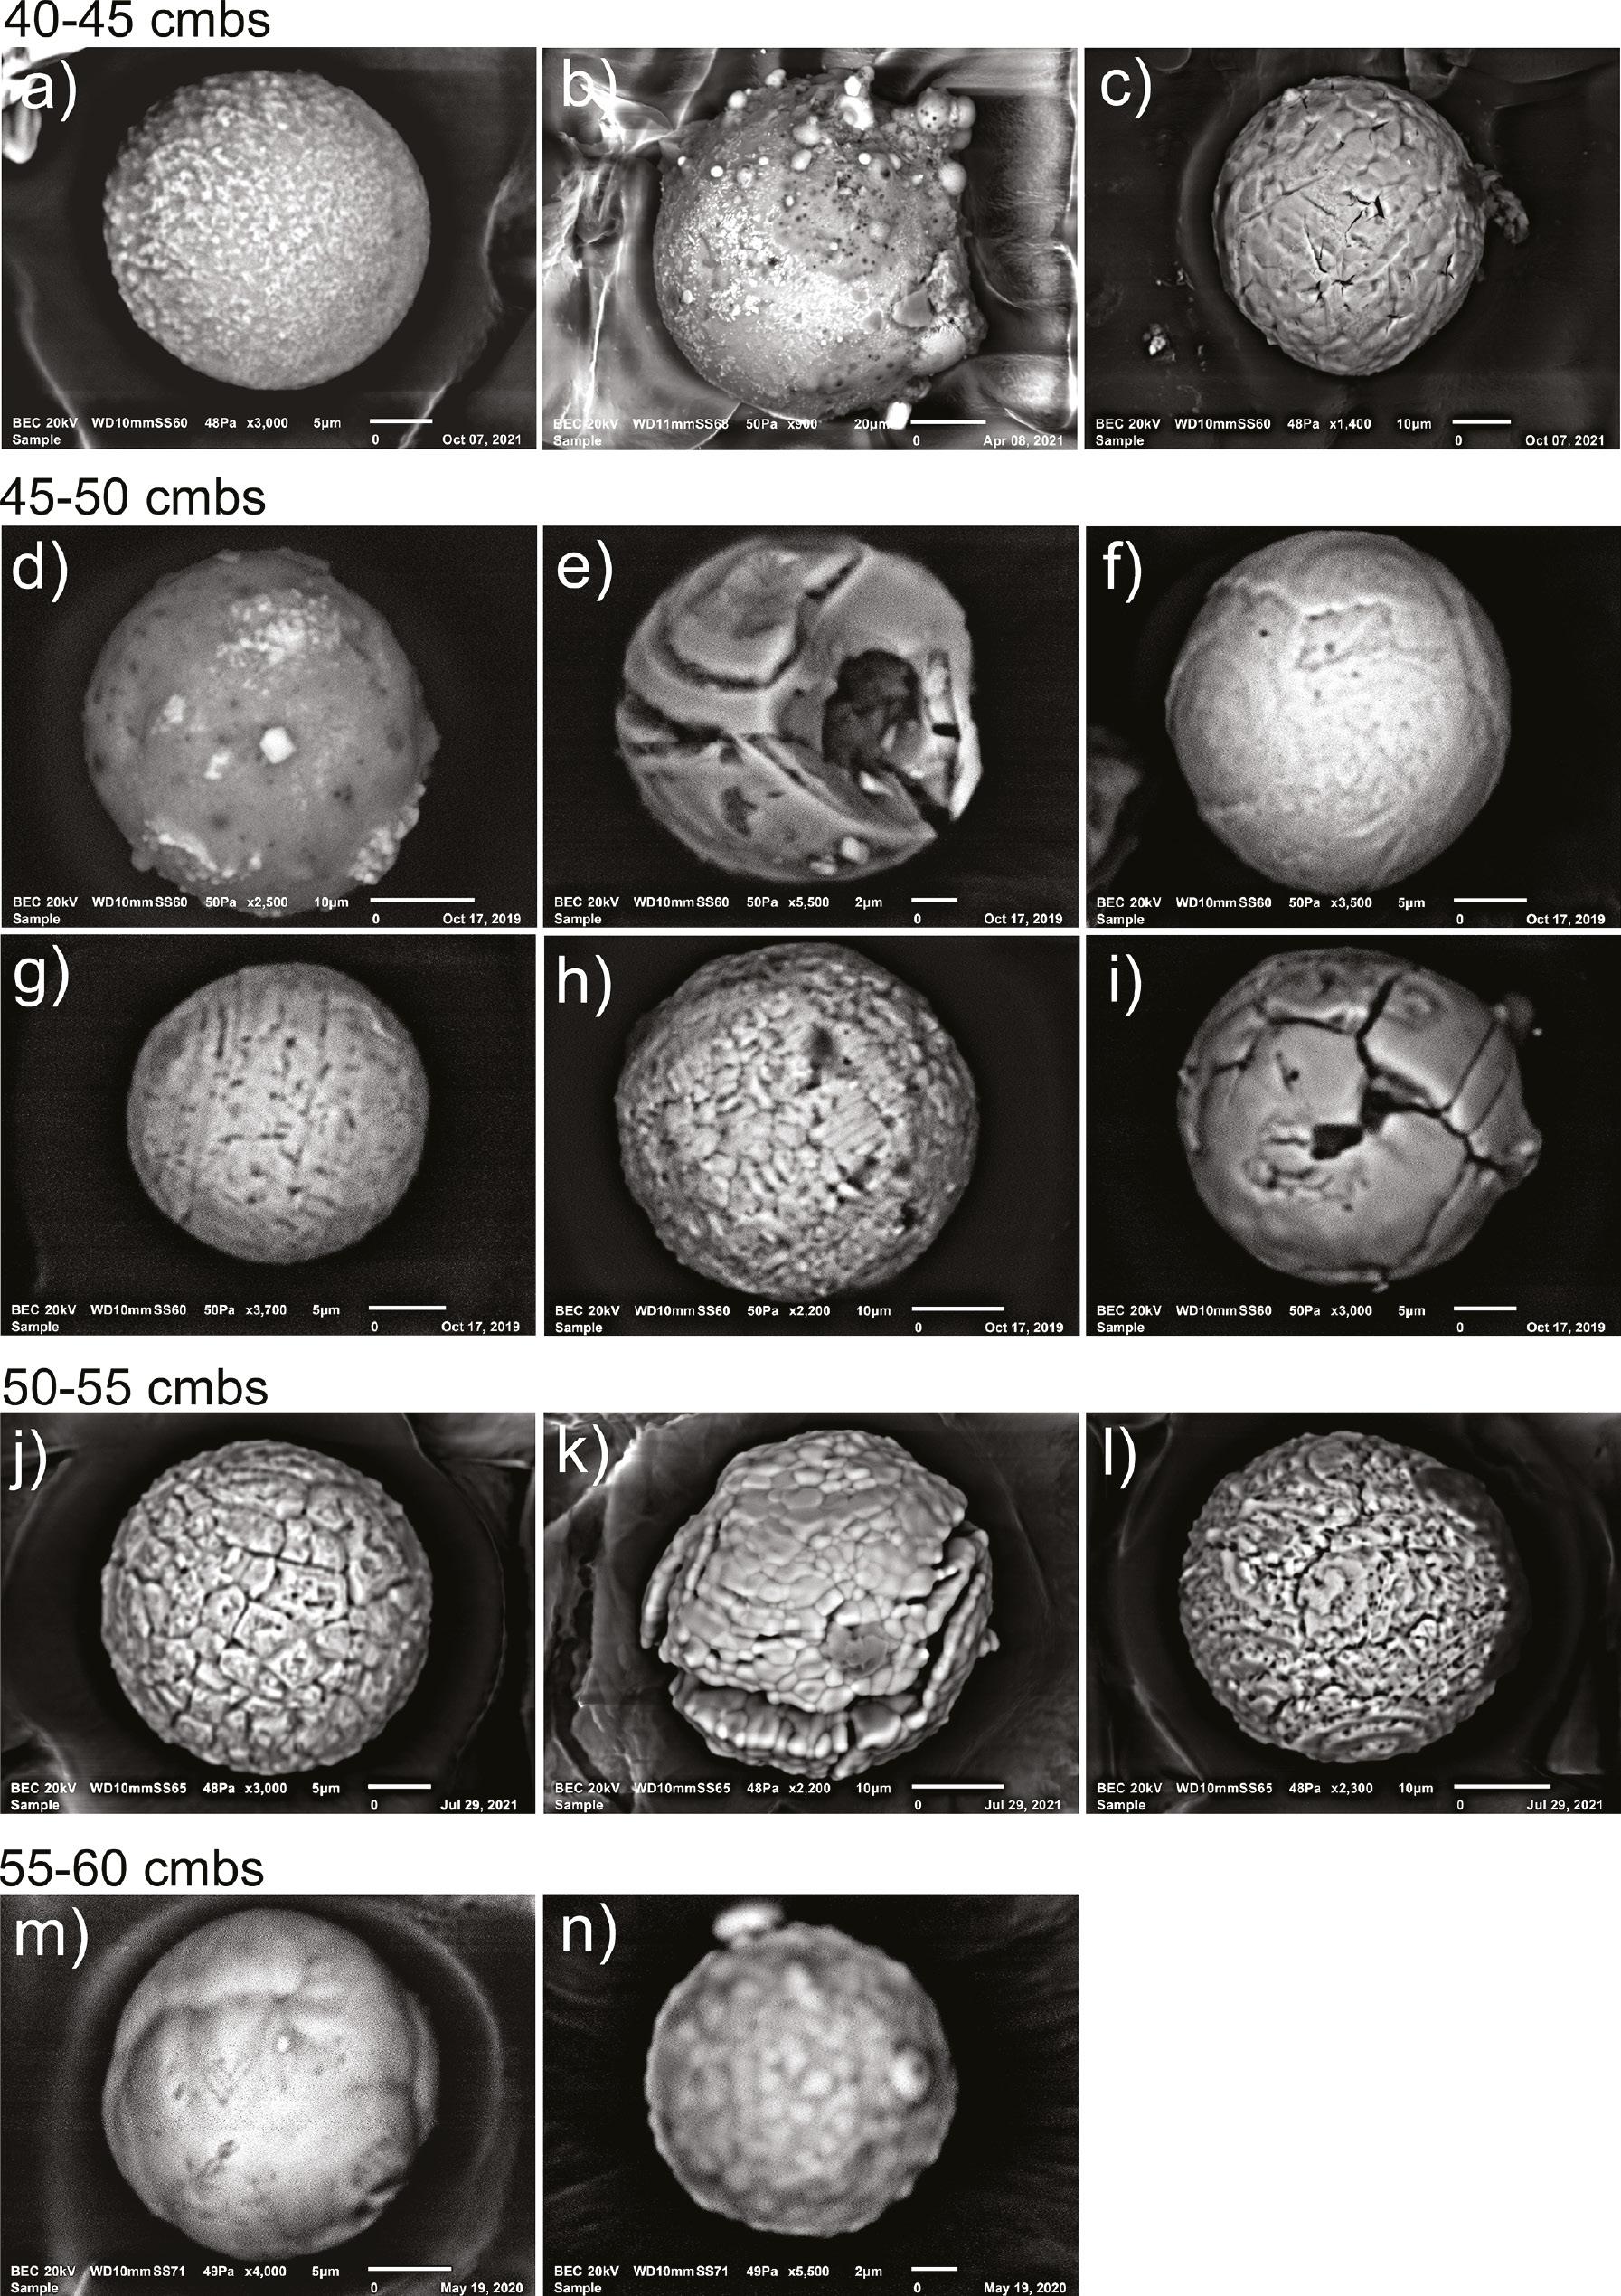
Magnetic microspherules from Parsons Island. They were extracted from 5-cm interval samples between 40 and 60 cm, as shown. Peak abundances occur at 45–50 cm. (click on Supplementary Information Table 2, Figure 9, and Supplementary Information Figures 31–41).
A YD onset age for the level containing these abundant proxies is supported by a high-precision AMS date on GLC (12,731 ± 14 cal BP; 95% range: 12,757–12,702 cal BP; D-AMS 043965: 10,753 ± 37 rcybp) from near the base of the Paw Paw Loess and immediately above the level containing YDB impact proxies.
Flamingo Bay
An analysis of contiguous sediment samples from Flamingo Bay at site 38AK469 (Figure 1) previously revealed a distinct Pt peak in a single 2.5-cm sample at a depth of 52.5–55 cmbs. This anomaly was associated with a Clovis point. The age of the layer is considered the YD onset based on similar Pt abundance peaks at sites across North America in well-dated YDB strata [3, 4]. Further analyses of these samples revealed a peak in iron-rich microspherules in the same sample at a depth of 52.5–55 cmbs (click on Supplementary Information Table 3, Figures 11 and 12, and Supplementary Information Figures 44, 45). A few such microspherules were found above this Pt anomaly (click on Supplementary Information Table 3) and likely resulted from vertical reworking, which is common in sandy sites. In addition to microspherules and Pt, shock-fractured quartz grains were identified in this sample and were absent in the samples examined higher and lower in the sequence.
![Flamingo Bay Sequence, South Carolina (38AK469) showing the abundance distribution of Pt (error = ± 0.1 ppb) and microspherules, shock-fractured quartz, and temporally diagnostic hafted bifaces. Peaks in Pt and microspherules and the presence of shock-fractured quartz mark the YDB. a) SEM image of dendritic microspherule. b) Shocked-fractured quartz grain image is optical using epi-illumination. Hafted bifaces silhouettes represent a generalized archaeostratigraphy for the downslope portion of the main excavation block at Flamingo Bay. The accepted age range for Clovis tools is ∼13,050–12,750 cal BP [97] and overlaps with the YDB at ∼50–55 cmbs. This figure is modified from Moore et al. [3]. Note that Pt abundance on the graph is an average of two measurements from the same sample (click on Supplementary Information Table 3).](/document_file/c8acd93e-88a9-43fb-b83e-8086b1baf4f3/ScienceOpen/image/aci20240003_fig11.jpg)
Flamingo Bay Sequence, South Carolina (38AK469) showing the abundance distribution of Pt (error = ± 0.1 ppb) and microspherules, shock-fractured quartz, and temporally diagnostic hafted bifaces. Peaks in Pt and microspherules and the presence of shock-fractured quartz mark the YDB. a) SEM image of dendritic microspherule. b) Shocked-fractured quartz grain image is optical using epi-illumination. Hafted bifaces silhouettes represent a generalized archaeostratigraphy for the downslope portion of the main excavation block at Flamingo Bay. The accepted age range for Clovis tools is ∼13,050–12,750 cal BP [97] and overlaps with the YDB at ∼50–55 cmbs. This figure is modified from Moore et al. [3]. Note that Pt abundance on the graph is an average of two measurements from the same sample (click on Supplementary Information Table 3).
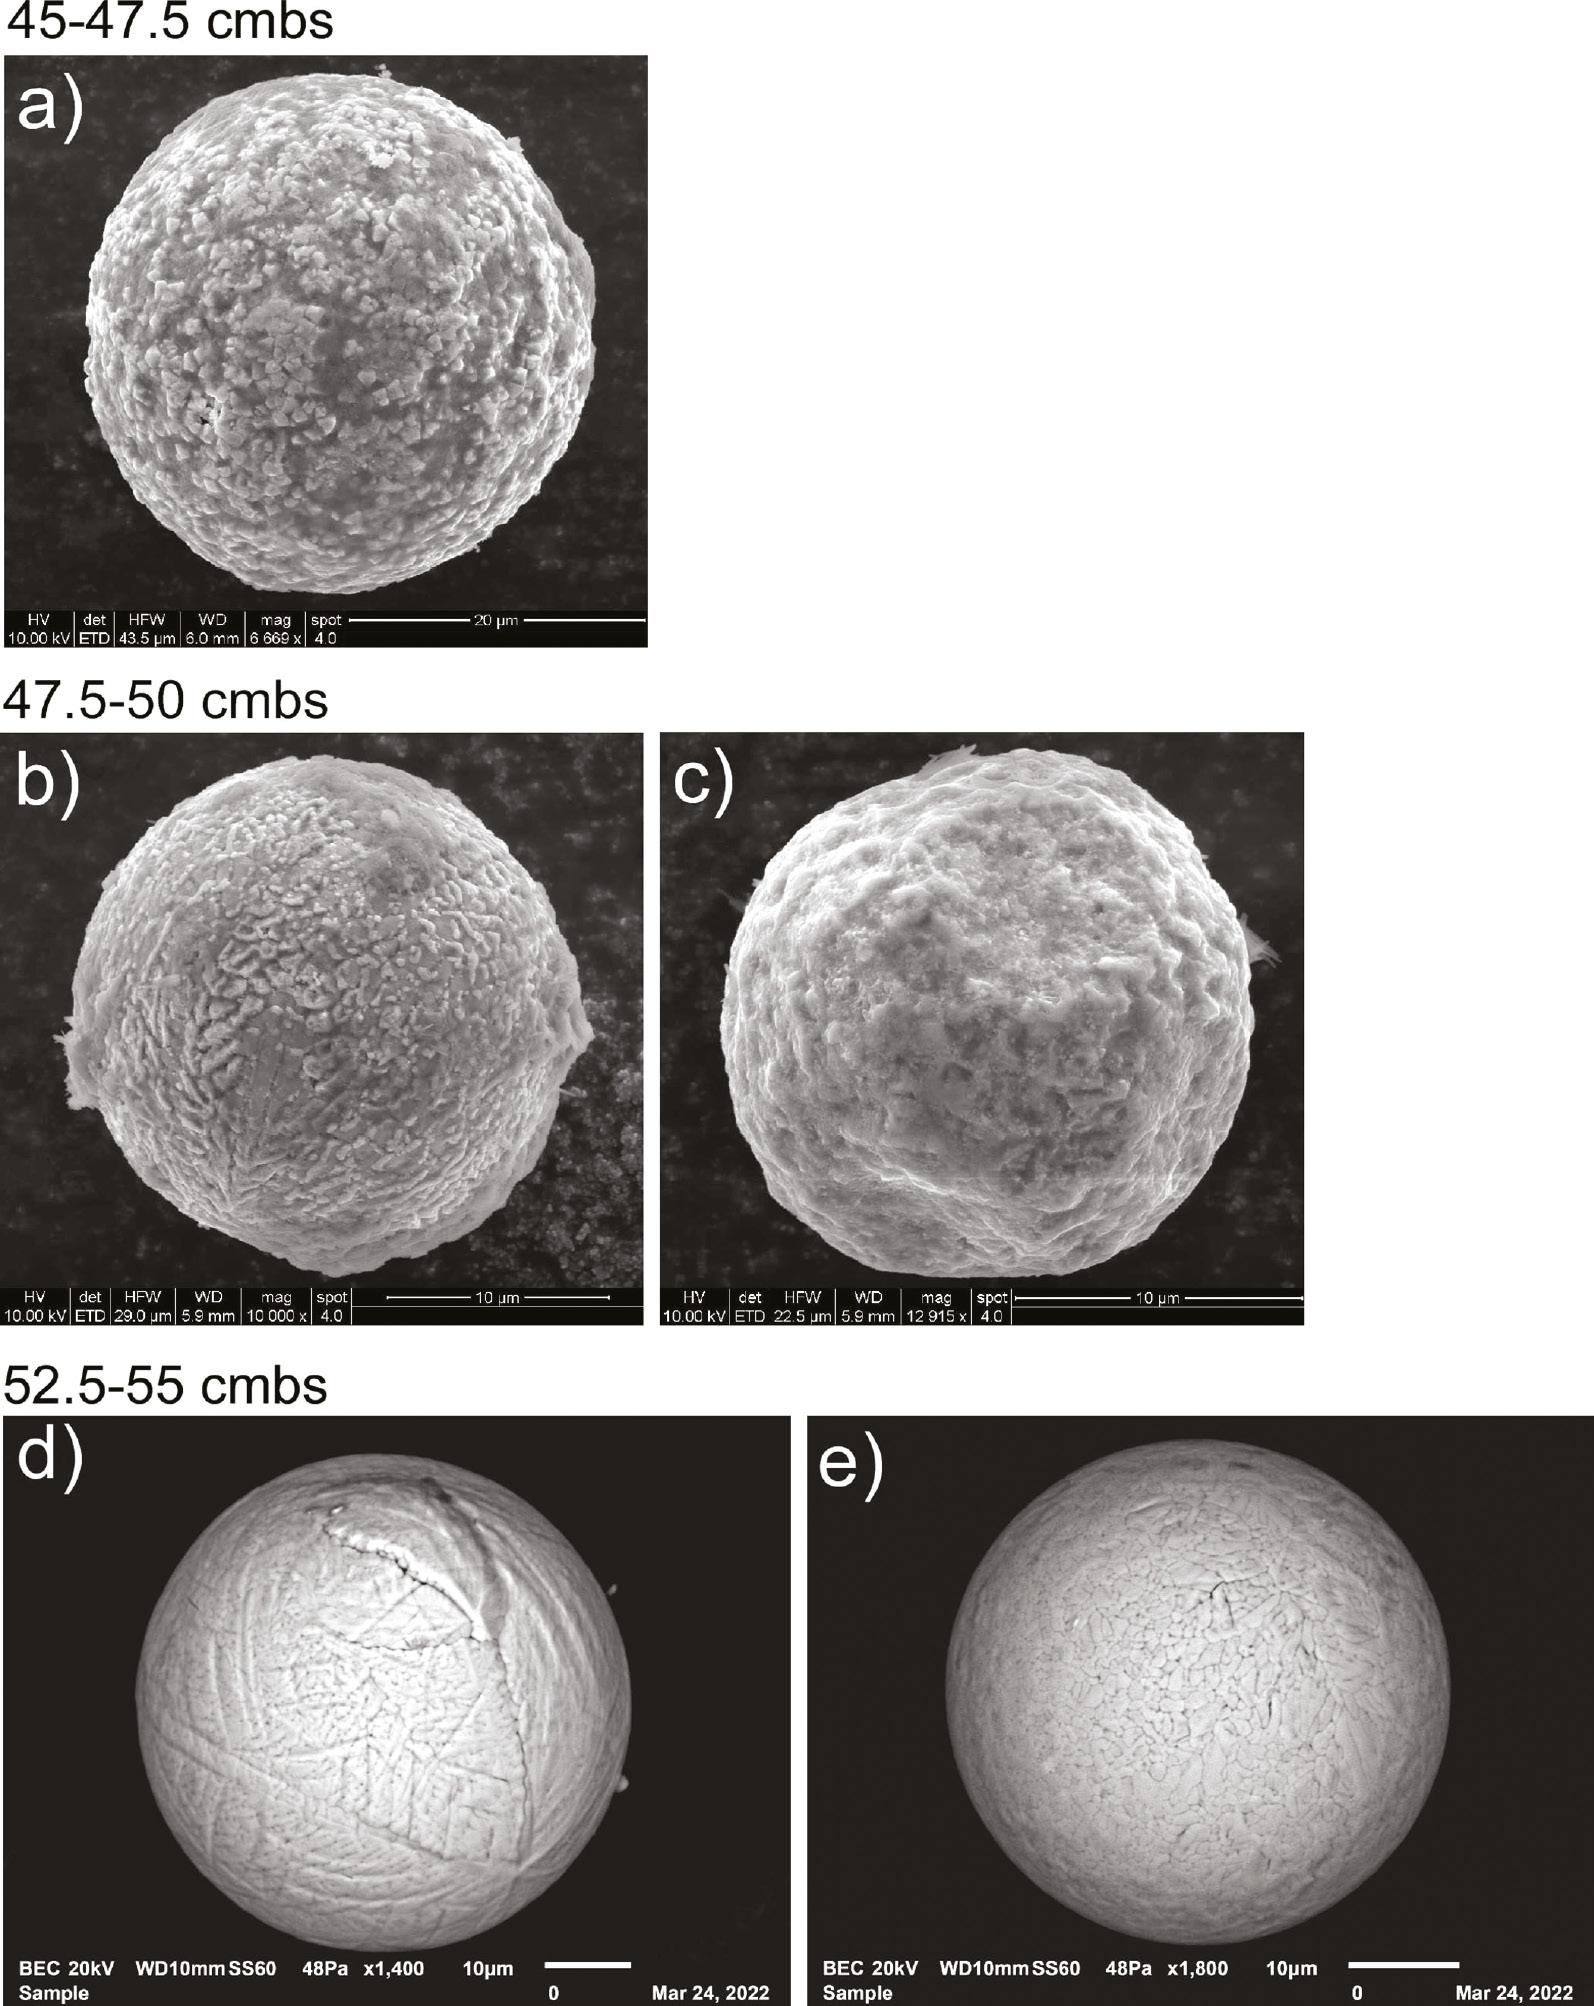
Representative examples of magnetic microspherules from Flamingo Bay (38AK469) (a and e) (see Figure 11, click on Supplementary Information Table 3, and Supplementary Information Figures 44 and 45).
Age depth models for the three sites
We produced Bayesian age-depth models for the three sites based on radiocarbon and OSL dates, age ranges of culturally datable lithic artifacts, and age of the Pt peak of 12,785 ± 50 cal BP (12,835–12,735 cal BP) [1–3]. We performed Bayesian analysis for each site using OxCal v4.4.4, r:5 [98] using the InCal20 calibration curve [99] (Figures 13–15). The OSL dates have high uncertainties, typically ranging from 1000–2000 years, making for low precision and accuracy for the age-depth models produced using OSL alone. In contrast, the Bayesian analyses incorporating the Pt anomaly and designated ages of lithics displayed much higher statistical certainty, typically of ±50–200 years.
![Bayesian age/depth model for Newtonville. The age-depth model uses one OSL date (black text), two radiocarbon dates, and the age of the Pt peak (YDB layer) (green text). The OxCal program rejected two radiocarbon dates as being anomalously young. The age of the Pt peak, as previously determined, is 12,785 ± 50 cal BP (12,835–12,735 cal BP) [1–3], and its chronostratigraphic position is statistically supported with an Agreement Index of 113 (well above the lower acceptable limit of 60), confirming its utility as a chronostratigraphic marker.](/document_file/c8acd93e-88a9-43fb-b83e-8086b1baf4f3/ScienceOpen/image/aci20240003_fig13.jpg)
Bayesian age/depth model for Newtonville. The age-depth model uses one OSL date (black text), two radiocarbon dates, and the age of the Pt peak (YDB layer) (green text). The OxCal program rejected two radiocarbon dates as being anomalously young. The age of the Pt peak, as previously determined, is 12,785 ± 50 cal BP (12,835–12,735 cal BP) [1–3], and its chronostratigraphic position is statistically supported with an Agreement Index of 113 (well above the lower acceptable limit of 60), confirming its utility as a chronostratigraphic marker.
![Bayesian age/depth model for Parsons Island. The age-depth model uses 5 OSL dates (black text), 1 radiocarbon date, and the age of the Pt peak (green text). The age of the Pt peak, as previously determined, is 12,785 ± 50 cal BP (12,835–12,735 cal BP) [1–3]. The Pt peak (YDB layer) is given the previously determined datum age range of 12,785 ± 50 cal BP (12,835–12,735 cal BP) [1–3] and its chronostratigraphic position is statistically supported with an Agreement Index of 113 (well above the lower acceptable limit of 60), confirming its utility as a chronostratigraphic marker.](/document_file/c8acd93e-88a9-43fb-b83e-8086b1baf4f3/ScienceOpen/image/aci20240003_fig14.jpg)
Bayesian age/depth model for Parsons Island. The age-depth model uses 5 OSL dates (black text), 1 radiocarbon date, and the age of the Pt peak (green text). The age of the Pt peak, as previously determined, is 12,785 ± 50 cal BP (12,835–12,735 cal BP) [1–3]. The Pt peak (YDB layer) is given the previously determined datum age range of 12,785 ± 50 cal BP (12,835–12,735 cal BP) [1–3] and its chronostratigraphic position is statistically supported with an Agreement Index of 113 (well above the lower acceptable limit of 60), confirming its utility as a chronostratigraphic marker.
![Bayesian age/depth model for Flamingo Bay. This age-depth model uses age ranges of 6 culturally identifiable lithic artifacts (orange-brown) and the age range of the Pt peak (YDB layer) (green text). The Pt peak (YDB layer) is given the previously determined datum age range of 12,785 ± 50 cal BP (12,835–12,735 cal BP) [1–3], and its chronostratigraphic position is statistically supported with an Agreement Index of 113 (well above the lower acceptable limit of 60), confirming its utility as a chronostratigraphic marker.](/document_file/c8acd93e-88a9-43fb-b83e-8086b1baf4f3/ScienceOpen/image/aci20240003_fig15.jpg)
Bayesian age/depth model for Flamingo Bay. This age-depth model uses age ranges of 6 culturally identifiable lithic artifacts (orange-brown) and the age range of the Pt peak (YDB layer) (green text). The Pt peak (YDB layer) is given the previously determined datum age range of 12,785 ± 50 cal BP (12,835–12,735 cal BP) [1–3], and its chronostratigraphic position is statistically supported with an Agreement Index of 113 (well above the lower acceptable limit of 60), confirming its utility as a chronostratigraphic marker.
An agreement Index of ∼100 or greater for the three sites (the lower acceptable limit is ≥60) confirms the utility of the peak levels of Pt and microspherule as a chronostratigraphic marker for the YD onset. For the data tables and coding used in the Bayesian modeling, click on Supplementary Information “Bayesian Data” and Supplementary Information Tables 4–6.
Key additional proxies in support of a cosmic impact
High-temperature melted minerals
Previous studies [5, 7, 13, 16] reported blebs of melted high-temperature minerals on YDB-age spherules and meltglass surfaces from Abu Hureyra, Syria, the Melrose site, Pennsylvania, and the Blackville site, South Carolina. The last two sites are in the eastern United States, as are the three sites in this paper. Given this earlier YDB evidence of high-temperature, highly reduced, melted minerals, we investigated their presence in the YDB at the three sites.
Our investigations identified the presence of minerals that are known to wholly or partially melt at given temperatures: mineral oxides including magnetic and titano-magnetite quartz and zircon from ∼1700 to 2000°C and chromite and chromferide from ∼2000 to 2600°C. Some minerals show evidence of formation at varying temperatures under reducing conditions, thus producing oxygen-deficient minerals (see Table 2). Using SEM to examine particles, we identified 22 minerals known to melt at high temperatures. Equilibrium temperatures ranged from ∼1250°C for bulk sediment to 3053°C for osmium (Table 2). These are described for the YDB at the following three sites.
High-temperature melted minerals and materials were observed in the YDB at the three sites.
| Phase | Formula | ∼Melt T (°C) | Phase | Formula | ∼Melt T (°C) |
|---|---|---|---|---|---|
| Cerium | CeO2 | 2400 | Paladium | Pd | 1555 |
| Chromferide | Fe1.5Cr0.2 | 1900 | Platinum | Pt | 1768 |
| Chromite | (Fe)Cr2O4 | 2190 | Quartz | SiO2 | 1713 |
| Iridium | Ir | 2466 | Rhodium | Rh | 1964 |
| Iron oxide (hematite) | Fe2O3 | 1565 | Ruthenium | Ru | 2334 |
| Iron oxide (magnetite) | Fe3O4 | 1590 | Sediment | Si-Ca-rich | 1250 |
| Iron, native | Fe | 1538 | Spherules, Fe-rich | Fe + Fe oxides | 1420 |
| Lanthanum | La2O3 | 2315 | Spherules, Si-rich | Si, Ca, Al, Fe oxides | 1250 |
| Nickel | Ni | 1455 | Titanomagnetite | TiFe2O4 | 1625 |
| Nickel iron | NiFe | 1430 | Ulvöspinel | TiFe2+2O4 | 1625 |
| Osmium | Os | 3053 | Zircon | ZrSiO4 | 1775 |
Shown are mineral names, chemical formulae, and melting points, ranging from 1250°C to 3053°C.
Newtonville
Thirteen melted objects included a mineralized carbon spherule embedded with melted blebs enriched in PGEs, including osmium (1.26 wt%; melting point = 3053°C), iridium (1.16 wt%; melting point = 2466°C), and platinum (2.05 wt%; melting point = 1768°C). Click on Supplementary Information Figure 46.
We analyzed seven spherules and melted objects that were Fe-rich but highly depleted in oxygen (FeO; melting point = 1538°C), suggesting that they formed under highly reducing conditions that are rare on the Earth but common in impact-related material. The Fe content averaged 87.0 wt% (range: 75.7 to 93.8 wt%), with O2 content that averaged 6.7 wt% (range: 0.54 to 14.83 wt%). Click on Supplementary Information Figures 47 through 53.
We also investigated one melted, aerodynamically-shaped titanomagnetite spherule (click on Supplementary Information Figure 54). One melted titanomagnetite bleb (click on Supplementary Information Figure 55) and one broken spherule (click on Supplementary Information Figure 56) composed of ulvöspinel, a form of titanomagnetite with a melting point of ∼1625°C. One spherule was composed of zircon with a melting point of ∼1775°C (click on Supplementary Information Figures 57, 58). Such spherules are highly unusual because zircon tends to dissociate rather than melt. In addition, one zircon grain displaying fractures filled with melted zircon appears to have undergone shock metamorphism at temperatures ≥1775°C (click on Supplementary Information Figures 59–62).
Parsons Island
Using SEM-EDS, we investigated 12 objects from the YDB at this site that contained detectable levels of PGEs and other elements commonly found in meteoritic material. Ru averaged 250 ppm with a range up to 900 ppm (melting point = 2334°C), Rh averaged 192 ppm with a range up to 900 ppm (melting point = 1964°C), Pd averaged 567 ppm with a range up to 2300 ppm (melting point = 1555°C), Os averaged 0.3 wt% with a range up to 2.07 wt% (melting point = 3053°C), Ir averaged 0.52 wt% with a range up to 1.58 wt% (melting point = 2466°C), and Pt averaged 0.28 wt% with a range up to 0.86 wt% (melting point = 1768°C). Cr averaged 1.09 wt% with a range up to 12.51 wt% (melting point = 1907°C), Co averaged 42 ppm with a range up to 300 ppm (melting point = 1495°C), and Ni averaged 48 wt% with a range up to 4.94 wt% (melting point = 1455°C). Click on Supplementary Information Figures 63–74. One melted PGE-enriched object was composed of chromferide (Fe1.5Cr0.2) with a melting point of ∼1900°C (clickn on Supplementary Information Figure 74). Gurov et al. [100] reported finding melted chromferide associated with the El’gygytgyn crater in Russia.
Flamingo Bay
In the YDB layer at this site, we identified one carbon spherule embedded with melted PGE-rich blebs. The Pd abundance was 300 ppm (melting point = 2334°C), Ir averaged 800 ppm (melting point = 2466°C), and Pt was 500 ppm (melting point = 1768°C). Cr averaged 100 ppm (melting point = 1907°C). Click on Supplementary Information Figure 75.
Shock-fractured quartz
The results of our shock-fractured quartz investigations are new and, thus, require a separate integrated section for the three study sites. The solid identification of glass-filled shock-fractured quartz requires multiple observations using a variety of analytical approaches. Thus, we employed a comprehensive suite of analytical techniques and instruments to study these grains. These included optical transmission microscopy (OPT), epi-illumination microscopy (EPI), scanning electron microscopy (SEM), energy dispersive spectroscopy (EDS), focused ion beam milling (FIB), transmission electron microscopy (TEM), scanning transmission electron microscopy (STEM), fast-Fourier transform (FFT), cathodoluminescence (CL), and electron backscatter diffraction (EBSD). All procedures and instruments are discussed in detail in the Supplementary Information, “Instrumentation and Analytical Details.”
For all three sites, the YDB layer had been previously identified by the presence of multiple materials known to be produced during cosmic impacts and airbursts. One or more 26 × 46-mm (8 cm2) thin sections were prepared and investigated for each layer at each site. For Newtonville sample UP-COA1, ∼8,700 sand grains, representing quartz, feldspar, and other minerals, were examined and found to contain 8 shock-fractured quartz grains on one 8-cm2 slide. For Newtonville sample UP-11–13, of ∼9,300 examined sand grains, 6 were identified as shock-fractured quartz grains. For Parsons Island, 22 shocked quartz grains were identified amongst ∼56,000 sand grains from the Pars-45 sample. For Flamingo Bay, 5 shocked quartz grains out of ∼7400 sand grains were found in the Flam-52.5 sample (Figures 16–19). The stratigraphic distribution of the shock-fractured quartz grain is summarized in Figure 20. The YDB layer was sampled at each of the three sites and is marked by peak abundances. In addition, one to two other layers outside the YDB were likewise investigated.
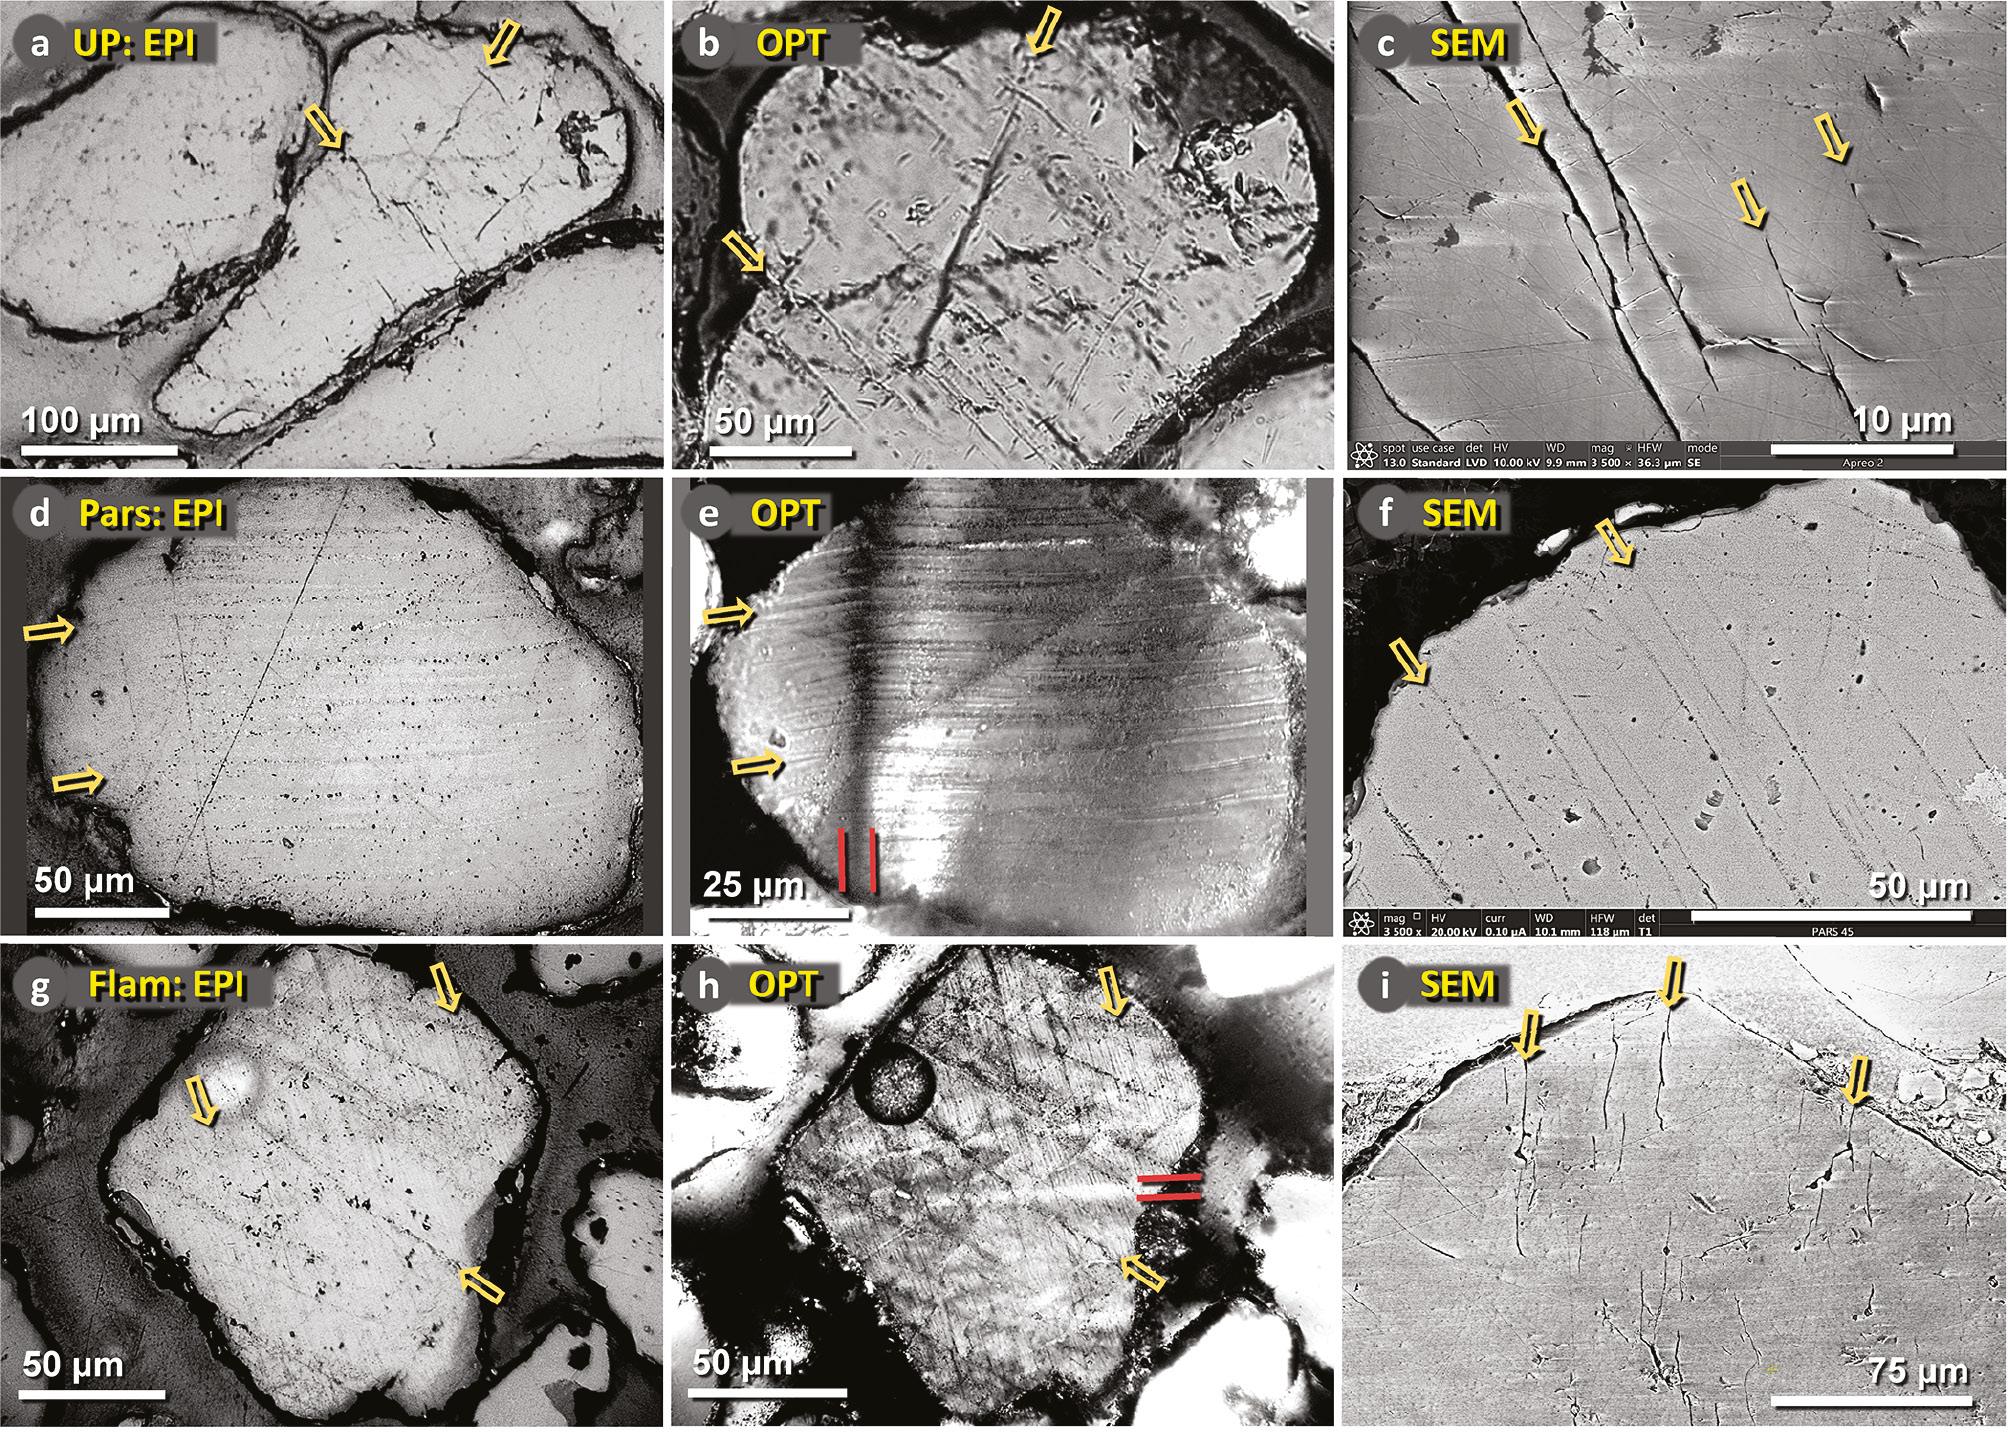
Shock-fractured quartz grains from Newtonville Site (a-c), Parsons Island Site (d-f), and Flamingo Bay (g-i). Images were acquired using optical microscopy and SEM. Yellow arrows identify selected shock fractures. Visible fractures were subsequently determined by EBSD and TEM to contain amorphous silica. In panels e and h, the red bars mark selected areas of undulose extinction that occur under crossed polarizers when different parts of the grain reach extinction at different polarities. This optical phenomenon commonly results from heterogeneous distortion of the crystal’s lattice by mechanical or thermal stress. (a) Newtonville (UP-11–13 cmbd) 23x13; epi-illuminated microscope (EPI) image. (b) Newtonville (UP-11–13 cmbd) quartz grain 23x13; transmitted-light optical microscope (OPT) image. (c) Newtonville (UP-11–13 cmbd) 23x13; secondary electron scanning electron microscope (SEM) image. (d) Pars-45 quartz grain 22x12; EPI image. (e) Pars-45 quartz grain 22x12; OPT image under crossed polars, rotated slightly off maximum for greater visibility. (f) Pars-45 quartz grain 22x12; backscatter electron scanning electron microscope (SEM-BSE) image. (g) Flam-52.5 quartz grain 33x-07; EPI image. (h) Flam-52.5 quartz grain 33x-07; OPT image under crossed polars, rotated slightly off maximum for better visibility. (i) Flam-52.5 quartz grain 20x12; SEM-BSE image.
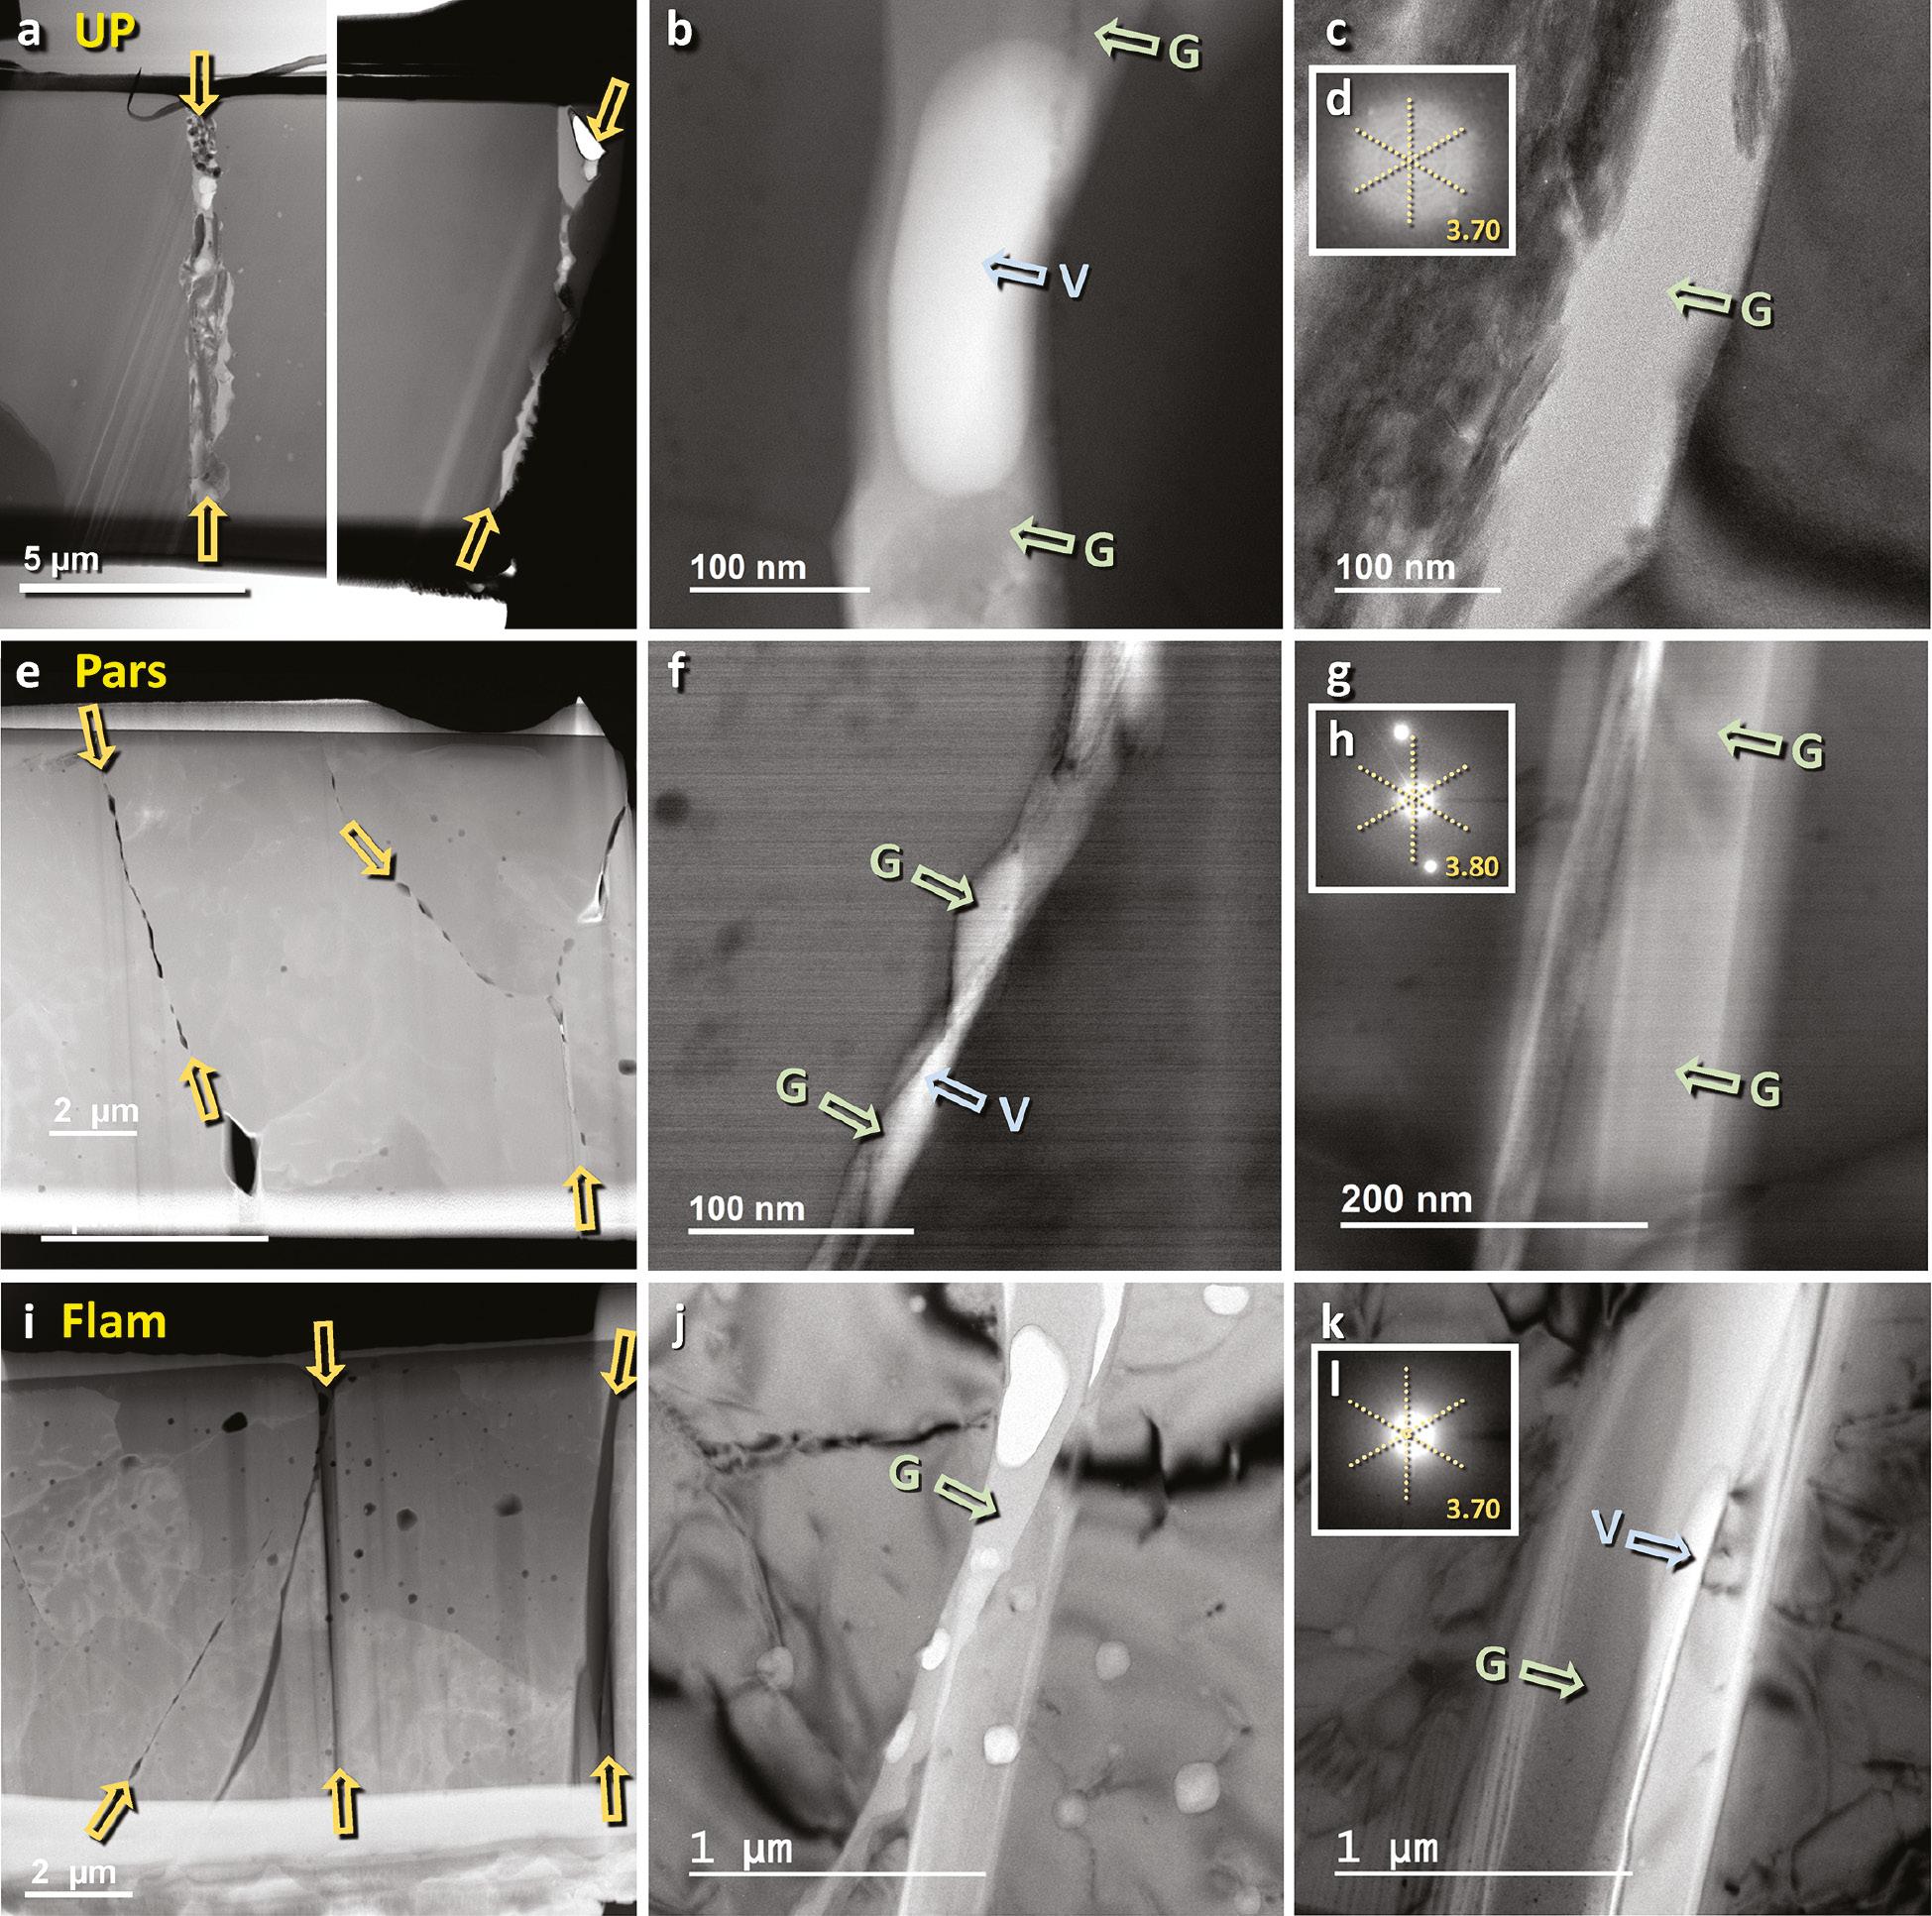
Shock-fractured quartz grains from Newtonville Site (a-c), Parsons Island Site (d-f), and Flamingo Bay (g-i). Images were acquired using scanning-transmission electron microscopy (STEM), transmission electron microscopy (TEM), fast-Fourier transform (FFT), and selected area diffraction (SAD). Yellow arrows identify selected shock fractures. Green arrows labeled “G” mark amorphous silica (glass) areas filling most fractures. Blue arrows labeled “V” mark voids or vesicles typically associated with fractures. All three sites display quartz grains with shock fractures intermittently filled with amorphous silica, as confirmed using FFT and SAD. (a) Newtonville (UP-COA1) quartz grain 08x03B. STEM image. (b-c) Newtonville (UP-COA1) quartz grain 08x03B. TEM image. (d) Newtonville (UP-COA1) quartz grain 08x03B. FFT image confirms non-crystallinity, i.e., the filling is amorphous quartz. (e) Pars-45 quartz grain 22x-07. STEM image. (f-g) Pars-45 quartz grain 22x-07. TEM image. (h) Pars-45 quartz grain 22x12. The SAD image confirms non-crystallinity, i.e., the filling is amorphous quartz. (i) Flam-52.5 quartz grain 20x13. STEM image. (j-k) Flam-52.5 quartz grain 20x13. TEM image. (l) Flam-52.5 quartz grain 20x13. FFT image confirms non-crystallinity, i.e., the filling is amorphous quartz.
![Shock-fractured quartz grains from Newtonville Site (a-b), and Parsons Island Site (d-f), and Flamingo Bay (g-i). Images were acquired using SEM-based cathodoluminescence (CL). Yellow arrows mark linear, non-luminescent black bands, commonly accepted to indicate open fractures or, in this case, amorphous material [38, 101–103]. (a) Newtonville (UP-11–13 cmbd) quartz grain 35x03. Panchromatic CL image. (b) Newtonville (UP-COA1) quartz grain 08x-03. Panchromatic CL image. (c) Pars-45 quartz grain 09x-12. Composite color (RGB) CL image. Blue represents unmelted quartz; orange represents melted quartz that has been annealed; black represents fractures filled with amorphous silica. Note that the fractures in this grain radiate from the area at the upper right, potentially resulting from a high-pressure collision with another grain. (d) Pars-45 quartz grain 07x06. Composite color (RGB) CL image. (e-f) Pars-45 quartz grain 22x12. Panchromatic CL image.](/document_file/c8acd93e-88a9-43fb-b83e-8086b1baf4f3/ScienceOpen/image/aci20240003_fig18.jpg)
Shock-fractured quartz grains from Newtonville Site (a-b), and Parsons Island Site (d-f), and Flamingo Bay (g-i). Images were acquired using SEM-based cathodoluminescence (CL). Yellow arrows mark linear, non-luminescent black bands, commonly accepted to indicate open fractures or, in this case, amorphous material [38, 101–103]. (a) Newtonville (UP-11–13 cmbd) quartz grain 35x03. Panchromatic CL image. (b) Newtonville (UP-COA1) quartz grain 08x-03. Panchromatic CL image. (c) Pars-45 quartz grain 09x-12. Composite color (RGB) CL image. Blue represents unmelted quartz; orange represents melted quartz that has been annealed; black represents fractures filled with amorphous silica. Note that the fractures in this grain radiate from the area at the upper right, potentially resulting from a high-pressure collision with another grain. (d) Pars-45 quartz grain 07x06. Composite color (RGB) CL image. (e-f) Pars-45 quartz grain 22x12. Panchromatic CL image.
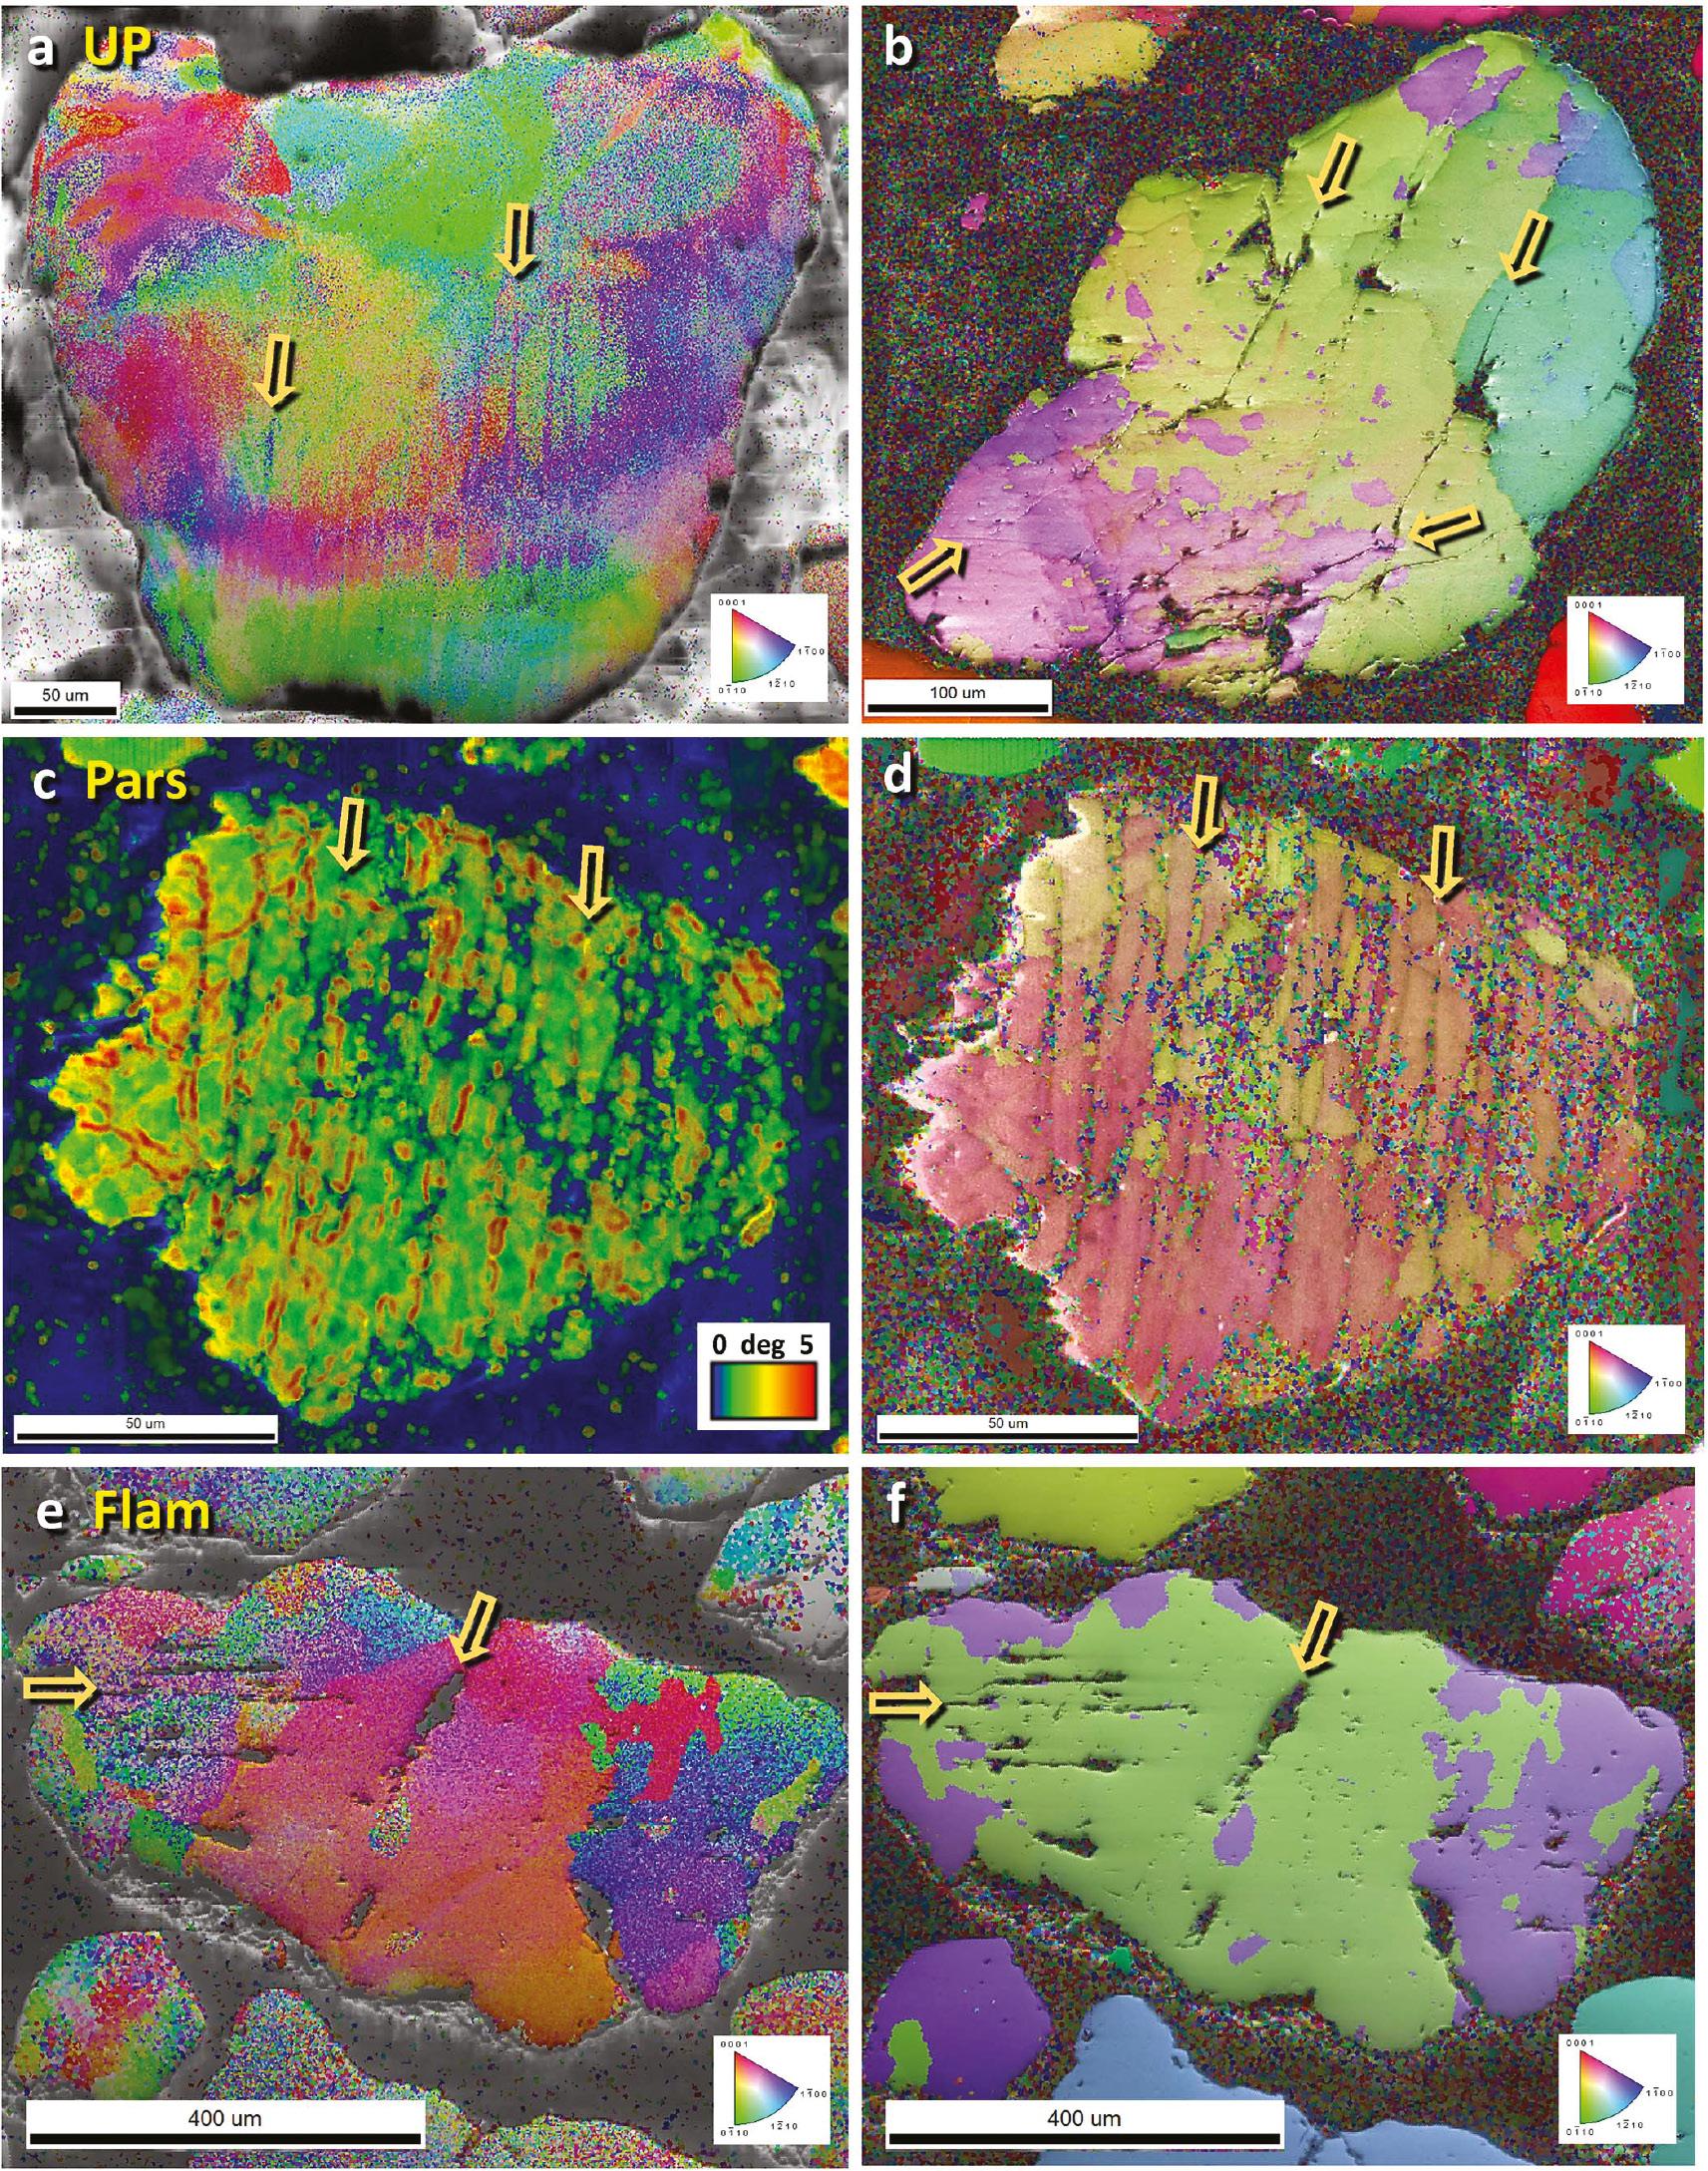
Shock-fractured quartz grains from Newtonville Site (a-c), Parsons Island Site (d-f), and Flamingo Bay (g-i). Images were acquired by electron backscatter diffraction (EBSD). The yellow arrows mark fractures. The inset legend at the lower right for each image except panel c shows the color-coded Miller-Bravais crystalline axes. For a detailed description of the EBSD analytical techniques used in this Figure, click on Supplementary Information, “Methods: Instrumentation and Analytical Details.” (a) Newtonville (UP-COA1) quartz grain 18x14. The wide range and variation of colors indicate thermal or mechanical damage to this grain’s lattice. (b) Newtonville (UP-COA1) quartz grain 13x06. The green and red colors represent the two Dauphine twin domains rotated 60° around the c-axis. The twinning is minimally associated with the fractures. (c) Pars-45 quartz grain 22x-07. A multi-colored misorientation scale is inset at the lower right. The colors represent the degrees of misorientation (i.e., damage) of the crystalline structure, ranging from 0 degrees (blue) to ∼5 degrees (red). The largest misorientations (red) are concentrated along the fractures. (d) Pars-45 quartz grain 22x-07. Reddish colors represent the quartz matrix, and orange-tan colors indicate Dauphine twinning rotated 60° around the c-axis. The twinning is closely associated with the fractures. (e) Flam-52.5 quartz grain 19x13. The wide range of colors and their extent indicate that this grain has sustained substantial lattice damage. (f) Flam-52.5 quartz grain 19x13. Green colors represent the quartz matrix, and purple indicates Dauphine twinning rotated 60° around the c-axis. The twinning is minimally associated with the fractures.
![The number of shock-fractured quartz grains observed by depth at (a) Newtonville, microstrat, (b) Parsons Island, and (c) Flamingo Bay. Shock-fractured quartz grains were observed only in the YDB layer, co-occurring with the peaks in microspherules, Pt, and anomalously high values in various other elements. Also shown is generalized archaeostratigraphic data for Flamingo Bay (38AK469) (i.e., Paleoindian through Woodland hafted biface silhouettes), radiocarbon dates (cal BP), and YDB layer (blue bar) each sample for the Flamingo Bay sequence is plotted in the middle of the sample interval. The accepted date range for the Clovis culture is ∼13,050–12,750 cal BP [93], and the YDB proxy layer overlaps with the base of the Younger Dryas episode estimated at ∼50–55 cmbs. In Kennett et al. [1], a Bayesian analysis of dates from YDB sites across North America shows synchronous deposition of the YDB proxy layer at ∼12,785 ± 50 years (range 12,735 to 12,835) cal BP [3]. Note that Pt abundance on the graph is an average of two measurements from the same sample.](/document_file/c8acd93e-88a9-43fb-b83e-8086b1baf4f3/ScienceOpen/image/aci20240003_fig20.jpg)
The number of shock-fractured quartz grains observed by depth at (a) Newtonville, microstrat, (b) Parsons Island, and (c) Flamingo Bay. Shock-fractured quartz grains were observed only in the YDB layer, co-occurring with the peaks in microspherules, Pt, and anomalously high values in various other elements. Also shown is generalized archaeostratigraphic data for Flamingo Bay (38AK469) (i.e., Paleoindian through Woodland hafted biface silhouettes), radiocarbon dates (cal BP), and YDB layer (blue bar) each sample for the Flamingo Bay sequence is plotted in the middle of the sample interval. The accepted date range for the Clovis culture is ∼13,050–12,750 cal BP [93], and the YDB proxy layer overlaps with the base of the Younger Dryas episode estimated at ∼50–55 cmbs. In Kennett et al. [1], a Bayesian analysis of dates from YDB sites across North America shows synchronous deposition of the YDB proxy layer at ∼12,785 ± 50 years (range 12,735 to 12,835) cal BP [3]. Note that Pt abundance on the graph is an average of two measurements from the same sample.
Initial candidate quartz grains were selected using light microscopy based on the presence of closely-spaced, parallel to sub-parallel, open fractures, often with material filling the fractures. For details, see Methods: Instrumentation and Analytical Details. These candidate grains were then carefully analyzed by SEM, TEM, and EBSD to confirm the glass-filled fractures. We observed no candidates for shock-fractured quartz in >8,000 sand grains from each layer examined above and below the YDB layer for each of the three sites. Notably, naturally fractured and quartz grains displaying tectonic lamellae (closed and non-fractured) were prevalent, although none analyzed contained amorphous silica.
Summary of geochemical and other proxies
For the three sites, we report abundance peaks in Pt, microspherules, meltglass, nanodiamonds, high-temperature melted minerals, and glass-filled fractured quartz. At Flamingo Bay, the Pt peak is chronostratigraphically associated with Clovis cultural artifacts (Figure 21).
![Stratigraphic Distribution of analyzed proxies and placement of the YDB layer. (a) Newtonville, microstrat (b) Parsons Island, and (c) Flamingo Bay. Graphs show platinum (Pt) abundances in ppb (error = ±0.1 ppb), the Pt peak, the microspherules peak, and the presence of nanodiamonds and meltglass. Also shown is generalized archaeostratigraphic data for Flamingo Bay (38AK469) (i.e., Paleoindian through Woodland hafted biface silhouettes), radiocarbon dates (cal BP), and YDB layer (blue bar) each sample for the Flamingo Bay sequence is plotted in the middle of the sample interval. The accepted date range for the Clovis culture is ∼13,050–12,750 cal BP [93], and the YDB proxy layer overlaps with the base of the Younger Dryas episode estimated at ∼50–55 cmbs. In Kennett et al. [1], a Bayesian analysis of dates from YDB sites across North America shows synchronous deposition of the YDB proxy layer at ∼12,785 ± 50 years (range 12,735 to 12,835) cal BP [3]. Note that Pt abundance on the graph is an average of two measurements from the same sample.](/document_file/c8acd93e-88a9-43fb-b83e-8086b1baf4f3/ScienceOpen/image/aci20240003_fig21.jpg)
Stratigraphic Distribution of analyzed proxies and placement of the YDB layer. (a) Newtonville, microstrat (b) Parsons Island, and (c) Flamingo Bay. Graphs show platinum (Pt) abundances in ppb (error = ±0.1 ppb), the Pt peak, the microspherules peak, and the presence of nanodiamonds and meltglass. Also shown is generalized archaeostratigraphic data for Flamingo Bay (38AK469) (i.e., Paleoindian through Woodland hafted biface silhouettes), radiocarbon dates (cal BP), and YDB layer (blue bar) each sample for the Flamingo Bay sequence is plotted in the middle of the sample interval. The accepted date range for the Clovis culture is ∼13,050–12,750 cal BP [93], and the YDB proxy layer overlaps with the base of the Younger Dryas episode estimated at ∼50–55 cmbs. In Kennett et al. [1], a Bayesian analysis of dates from YDB sites across North America shows synchronous deposition of the YDB proxy layer at ∼12,785 ± 50 years (range 12,735 to 12,835) cal BP [3]. Note that Pt abundance on the graph is an average of two measurements from the same sample.
Discussion
Many studies have documented a broadly multi-continental distribution of YDB glass or iron-enriched and glassy microspherules [e.g., [7, 12, 14–16, 23] and platinum [e.g., [2–4, 7, 25]. This study’s three widely separated sites along the North America Eastern Seaboard are consistent with this by exhibiting YDB peaks in microspherules and Pt. For the first time, the impact origin of the YDB is further strengthened by documentation of shock-fractured quartz (Figure 20) in the three sites. Furthermore, aluminosilicate meltglass was identified at two sites (Newtonville and Parsons Island), and nanodiamonds were identified at Newtonville [72].
Site dating
The Parsons Island YDB layer is solidly radiocarbon-dated. Although the shallow surficial stratigraphy at Newtonville produced mixed radiocarbon ages, likely because of bioturbation, a YD-onset AMS date on GLC is consistent with multiple impact proxies of YDB age. Similarly, although the Flamingo Bay profile is not well radiometrically dated, the stratified presence of Clovis artifacts (∼13,050 to 12,750 cal BP) [93] provides a chronostratigraphic datum for the YDB.
Previous studies [3, 4] proposed that the platinum abundance anomaly in YDB sediments across North America is a reliable chrono- and litho-stratigraphic datum for the YD onset constrained to 12,835 to 12,735 cal BP (at 95% probability) [1]. The age of the Pt anomaly is consistent with that of the GISP2 Greenland ice core [2]. Notably, the GISP2 Pt anomaly occurs precisely in the same ice core sample as the oxygen isotope excursion and an increase in dust content that marks the onset of the Younger Dryas cooling episode ∼12,800 years ago. This interpretation was based on a detailed analysis of multiple climate proxies from a single ice core, GISP2 [20] (click on Supplementary Information Figure 76). However, this conclusion was disputed by Holliday et al. [104], who claimed the YD onset occurred 30 years before the Pt peak. Holliday et al. based that conclusion on comparing climate proxies from multiple ice cores using the multi-core GICC05 timescale, and they neglected to consider the GICC05 uncertainties of ± 140 years. Thus, we consider the exact correspondence of the Pt anomaly with the YD onset climate proxies in a single ice core with one timescale in Wolbach et al. [20, 21] to be more reliable than the conclusion of Holliday et al., based on a comparison of multiple cores with a composite age scale having an uncertainty of ± 140 years. For the three sites in this paper, we accept that the age of the Pt anomaly is ∼12,835–12,735 cal BP and conclude that the layer marked by the peaks of Pt and other inferred impact proxies is more predictive in identifying the YDB layer and especially when radiocarbon or OSL dating is limited or problematic.
Shock-fractured quartz
Glass-filled shock-fractured quartz grains were observed at the three sites, based on TEM-FFT and TEM-SAD, demonstrating a lack of crystallinity, i.e., that the filling material is amorphous (glass). SEM-EDS analysis confirmed that this glass filling is quartz. In some cases, EBSD analyses revealed black, non-luminescent quartz filling, consistent with previous independent observations that the non-luminescent material is amorphous [38, 101–103].
A previous study [32] demonstrated that both near-surface nuclear detonations and nuclear airbursts produce very high temperatures and pressures capable of melting quartz and producing shock metamorphism. The most important similarity is that, in both events, the shockwaves from the ground impacts or near-surface airbursts are coupled with the Earth’s surface, thus producing extreme temperatures and pressures that fracture quartz grains, melt or vaporize surficial quartz-rich sediments, and force molten silica into the fractures. These conditions are unlike high-altitude nuclear detonations or cosmic airbursts in which the fireball does not intersect the Earth’s surface. This surface-coupling appears essential to produce shock-generated fractures filled with amorphous silica. Potential formation mechanisms for shock fracturing include compression, tensioning, and thermal metamorphism. Our investigation confirms the presence of glass-filled shock-fractured quartz at each site in the YDB layer, but not above or below.
We concur with the jetting hypothesis suggested by earlier studies [58, 59, 63] that high temperatures appear to vaporize quartz grains and sediment, after which high pressures inject molten silica or vapor into the fractures and any other zones of weakness in exposed quartz grains [59, 63]. We also concur with two more recent studies [6, 32] that molten silica may enter quartz grains along multiple possible zones of weakness: (i) fractures produced by the shockwaves, (ii) fractures produced by high temperatures, (iii) pre-existing quartz fractures, (iv) new fractures that form along pre-existing PDFs and PFs, (v) new fractures along pre-existing tectonic lamellae, and (vi) new fractures along pre-existing subgrain boundaries. In the cases of the pre-existing features, the shock fracturing process overprints and modifies the existing features. Even though these types of fractures may form under substantially different shock and non-shock conditions, all have one common characteristic: the impact events inject them with amorphous silica. To support the suggested connection to airbursts/impacts, Ernstson et al. [105] reported extensive low-pressure, glass-filled fracturing in multiple proposed airbursts during the Cenozoic.
Identifying glass-filled shock-fractured quartz grains at YDB sites adds another significant proxy consistent with an airburst or impact of a fragmented cosmic impactor, as predicted by the Younger Dryas impact hypothesis (YDIH). Tectonic shock metamorphism is ruled out for these three sites because amorphous quartz that fills fractures has never been observed under tectonic conditions, and low-pressure tectonic lamellae with no glass filling were common at the three sites. The glass-filled shock-fractured quartz grains recovered from these three widely separated study sites are significant new evidence because shock metamorphism is a classic indicator of a cosmic impact event.
Formation of high-temperature minerals in meltglass and microspherules
The origin of the 22 high-temperature minerals we have identified in this study requires explanation. Several processes can potentially form high-temperature minerals, and so we compare and contrast them as follows:
Biomass or “haystack” fires
Thy et al. [106] reported that biomass glass or slag is sometimes found in midden piles of African prehistoric settlements with estimated formation temperatures of 1155–1290°C. These temperatures are lower than the melting points of 20 of the 22 minerals observed, making midden fires an unlikely source [7, 16].
Lightning-induced melting
Temperatures in fulgurites reach >1720°C, the melting point of quartz, making lightning a potential source of the numerous high-temperature minerals observed at these three sites. However, we found no examples of the hollow, tubular shapes of fulgurites produced by lightning, thus making lightning an unlikely source [7, 16].
Anthropogenic contamination
Anthropogenic activity can produce high-temperature minerals. However, only modern arc furnaces can reach or exceed the melting points of only about half of the high-temperature minerals observed, making anthropogenesis an unlikely formation mechanism for all the objects [7, 16]. Anthropogenesis appears highly unlikely because such material reaches significant peaks in the YDB layers with few to none of these materials above or below.
Cosmic ablation from meteorites
Two types of microspherules form during the typical rain of meteorites and extraterrestrial debris. The influx of stony meteorites produces only glassy spherules that typically contain >10 wt% MgO [7, 16]. Fe-rich microspherules produced by the influx of iron meteorites typically contain more than a few percent of Ni. Microspherules and meltglass from the three sites meet neither of those conditions, indicating that they were not ablated from meteorites.
Cosmic impact
Nearly all 22 high-temperature minerals observed at these three sites do not melt under natural terrestrial conditions. In particular, native iron, melted zircon, chromferide, and melted PGEs are rare under normal terrestrial conditions but common in cosmic impacts or airbursts [7, 16]. We conclude that the data supports this hypothesis of a cosmic impact. No other hypothesis supports the evidence that is distributed synchronously across widely separated sites.
The YDB as an “impact spherule datum layer”
We suggest that the broad, collective YDB evidence meets the criterion as an “impact spherule datum layer,” as proposed by Simonson and Glass [107]. Previously, microspherule peaks have been reported at each of ∼50 YDB sites widely distributed ∼12,000 miles across four continents [5, 7, 13, 15, 16, 22, 23] (click on Supplementary Information Figure 78). In this study, impact proxies, such as microspherules (all three study sites), meltglass (two of the study sites), and shock-fractured quartz, are widely distributed across nearly 1000 km. Typical YDB sites average ∼1 microspherule >125 microns per cm2 of the YDB surfaces. In contrast, Glass and Simonson [108] showed that for a single 10-km crater, sand-sized particles (>125 microns), as seen for the Ivory Coast microtektites, can be dispersed between ∼1,000 and 3,000 km from the impact site (click on Supplementary Information Figure 77). One possible explanation for this wide distribution is that multiple high-energy, near-surface YDB airbursts/impacts injected into the atmosphere via impact plumes, multi-micron-sized melt products, including shock-fractured quartz, meltglass, and microspherules and dispersed them widely.
These layers typically contain a variety of impact markers, including microspherules, meltglass, and PGE anomalies [107]. Impact microspherule layers are also known for their utility as chronological datums for stratigraphic correlation and age determination, even over vast distances [109].
Although most impact microspherule layers have been linked to large impact craters, many such layers have not been linked to any known crater. Indeed, Glass and Simonson [Table 1 in ref. [109]] reported 21 impact microspherule layers with no known associated crater, including the Australasian tektite field spread across ∼10% of the planet and the Libyan Desert glass field, covering 2500 km2. Similarly, no known crater is associated with the YDB impact microspherule layer. Thus, the discovery and identification of a crater are not required to interpret such a widely distributed microspherule layer as of cosmic impact origin.
The ∼12.8 ka YDB layer at ∼50 broadly distributed sites has been extensively reported to contain abundance peaks of one or more potential impact-related proxies, including iron-enriched or glassy microspherules, meltglass, charcoal, aciniform carbon, soot, glasslike carbon, carbon microspherules, nanodiamonds, PAHs, Pt, Ir, and Ni, among others [5, 7, 13, 15, 16, 22, 23]. Some YDIH critics consider these YDB proxies individually in isolation, claiming they are merely coincidentally associated, and they invoke alternative hypotheses for each proxy’s provenance [104, 110–113]. However, no critic has identified any other non-impact layer that coincidentally contains the broad suite of these proxies found in the YDB layer. It is statistically improbable that these dozen proxies are unrelated and only coincidentally found in the same layer. Instead, the most parsimonious explanation is that the same cosmic impact event produced and deposited them. In support of that, the only known geologic layers found in the Earth’s multi-billion-year stratigraphic record that contain similar peaks in microspherules and related materials, as reported in other studies, are widely acknowledged to result from an extraterrestrial impact.
Conclusions
In this study of three sites along the Eastern Seaboard of the United States, we report YDB abundance peaks in iron-enriched microspherules, glassy microspherules, meltglass, nanodiamonds, high-temperature melted minerals, and platinum, all variably found at >50 sites on four continents, including the Greenland ice sheet. We also investigated the temperatures and conditions required to produce microspherules and meltglass in the 12,800-year-old YDB layers. These materials are associated with melted chromferide, zircon, quartz, titanomagnetite, ulvöspinel, magnetite, native iron, and PGEs with equilibrium melting points ranging from ∼1250° to 3053°C. These high temperatures imply that these materials did not form under normal terrestrial conditions but likely formed during an unusual cosmic impact event. We also report peak abundances of high-temperature, high-pressure shock-fractured quartz in the YDB layer but not in samples taken above or below at each site investigated. These high temperatures and pressures are unlikely to occur under normal terrestrial conditions but are often characteristic of cosmic impact events.
Our observations are consistent with the hypothesis of multiple near-surface atmospheric airburst detonations of a fragmented cosmic impactor ∼12,800 years ago at the onset of the Younger Dryas climate event. These airbursts produced a synchronous layer over much of the world, arguably meeting the formal recognition criteria for classification as an “impact microspherule datum.” The consequences of this event, including possible global effects on environmental ecosystems, glacial ice sheets, megafaunal extinctions, and human populations, are yet to be fully understood but need to be evaluated in the context of a geologically instantaneous and likely catastrophic event. These ramifications are not uniform geographically and must be worked out at the regional and sub-regional levels. Our evidence supports the hypothesis that the abundance anomalies in platinum, microspherules, meltglass, and shock-fractured quartz form a reliable chrono- and litho-stratigraphic datum for the YD onset at ∼12,800 cal BP, consistent with the Younger Dryas impact hypothesis.
Methods
Geochemistry (Pt, Pd, Au)
For geochemical analysis, sediment samples were collected directly from cleaned archaeological unit profiles, stored in plastic bags, and allowed to air dry over several days. Bulk sediment samples were then dry-sieved using a 63-micron sieve to separate the silt and clay fractions from the sand. The silt and clay fraction were then weighed and repackaged in a plastic bag for shipment to Activation Laboratories Inc. (Actlabs) for “1C-Research” analysis. Sediment samples of ∼50 grams are required for the “1C-Research” analysis.
Activation Laboratories Inc. (Actlabs) followed Hoffman and Dunn [114] and used fire assay (FA) and inductively coupled plasma mass spectrometry (ICP-MS) to measure elemental concentrations of the sediment samples from all sites. Before analysis, each sample is mixed with fire assay fluxes (borax, soda ash, silica, litharge), and silver (Ag) is added as a collector. The mixture is placed in a crucible, preheated at 850°C, heated to 950°C, and finished at 1060°C for 60 minutes. After the crucibles are removed from the assay furnace, the molten slag is poured into a crucible, leaving a lead button, which is then preheated to 950°C to recover the Ag (doré bead) plus Au, Pt, and Pd.
The Ag doré bead is digested in hot (95°C) HNO3 + HCl with a special complexing agent to prevent the Au, Pd, and Pt from adsorbing onto the test tube. After cooling for 2 hours, the sample solution is analyzed for Au, Pt, and Pd using a Perkin Elmer Sciex ELAN 9000 ICP-MS. There were two method blanks, three sample duplicates, and two certified reference materials on each tray of 42 samples. The ICP-MS is recalibrated every 45 samples. Smaller sample splits are used for high chromite or sulfide samples. Measurements are reported in parts per billion (ppb) with a lower detection limit for Pt at 0.1 ppb.
Shock-fractured quartz
We employed a comprehensive suite of analytical techniques and instruments to study these thin sections. These included optical transmission microscopy (OPT), epi-illumination microscopy (EPI), scanning electron microscopy (SEM), energy dispersive spectroscopy (EDS), focused ion beam milling (FIB), transmission electron microscopy (TEM), scanning transmission electron microscopy (STEM), fast-Fourier transform (FFT), electron backscatter diffraction (EBSD), cathodoluminescence (CL), and micro-Raman. All procedures and instruments are discussed in detail in the Supplementary Information, “Instrumentation and Analytical Details.”
Each slide was carefully and methodically searched for candidate grains of shocked quartz using optical and transmission microscopy. Grains exhibiting closely spaced, oriented fractures were marked as candidates for shocked quartz, with each requiring focused investigations using multiple techniques. Descriptions of techniques presented below are adapted from Hermes et al. [32], which shares ten co-authors with the current study. These descriptions are publishable under Creative Commons, CC by 4.0 (http://creativecommons.org/licenses/by/4.0/).
Microspherules and meltglass analysis
To analyze sediment samples for magnetic microspherules, we weighed and then ultrasonicated the samples for 30 minutes with a chemical dispersant (sodium metaphosphate). Following ultrasonication, samples are wet-sieved over a 20-micron sieve and dried under a heat lamp. Processed samples are then size sorted, and sediment fractions between ≥63 and <125 and ≥20 and <63 microns are spread thinly on a large sheet of paper. A neodymium magnet is placed inside a plastic bag and slowly moved over the size-sorted sediment fractions to extract the magnetic grains if present. This process is repeated three times to extract most magnetic grains. These grains are then examined under a stereo binocular microscope to determine if microspherule candidates are present. When present, microspherule candidates are counted, and a sample is placed on carbon SEM tape for analysis by scanning electron microscopy (SEM) and energy-dispersive x-ray spectroscopy (EDS) analysis. Only SEM and EDS analysis can confirm the identification of glassy or Fe-rich microspherules [14]. The microspherule counts and total sediment sample weights are used to estimate microspherules/kg for each sample.
After extracting the magnetic fraction to investigate iron-enriched microspherules, the remainder of the sand fraction is examined for meltglass candidates. This aliquot mainly includes larger sand size fractions >63 microns, which are examined with optical microscopy to identify meltglass. When present, meltglass candidates are placed on carbon SEM tape for analysis by scanning electron microscopy (SEM) and energy-dispersive x-ray spectroscopy (EDS) analysis.
OSL dating
Optically Stimulated Luminescence (OSL) samples were acquired from an eroding bluff on the southwestern shoreline of Parsons Island and submitted to the University of Washington Luminescence Dating Laboratory for dating using the single-grain method.
AMS radiocarbon dates were acquired on glasslike carbon (GLC) fragments and carbon microspherules collected from sediment samples at Parsons Island and Newtonville. Samples were dated at the Center for Applied Isotope Studies at the University of Georgia, Direct AMS, and the University of California, Irvine (UCI).