
Introduction
This article is the first of a three-part series about the archeological site at Abu Hureyra, Syria. Here, Part #1 concentrates on shock-fractured quartz as evidence of a local cosmic airburst; Part #2 [1] focuses on impact-related high-temperature meltglass, nanodiamonds, micro-spherules, iridium, and platinum; and Part #3 [2] proposes that multiple cosmic airbursts/impacts triggered Younger Dryas climate change that, in turn, initiated the transition from hunting-and-gathering to cultivation.
Shock metamorphism in quartz
In this study, “fractures” are defined as intragranular cracks in a quartz grain, characterized by wall displacement, and they are typically sub-parallel, sub-planar, and a few microns wide. In particular, we investigate whether the observed fractures formed by impact-related thermal or mechanical stress, commonly known as shock metamorphism, instead of by natural geologic processes. This study focuses primarily on the subset of shock fractures discontinuously filled with amorphous silica (a term we use interchangeably with “glass”), even though some shock fractures contain no detectable glass. However, it is unclear whether these glass-filled features are actual fractures or, in some cases, are some other sub-planar amorphous silica discontinuities, perhaps low-pressure shock lamellae. In any event, amorphous silica is almost always associated with impact-related shock metamorphism.
Previous studies of cosmic impact structures have described shock fractures in quartz and given them various names, including shock extension fractures (SEFs) [3–6], shock fractures [7, 8], and vermicular (i.e., wormlike) microfractures [4, 6, 9]. Here, as in Hermes et al. [10] and previous studies, we adopt the term “shock fractures” to denote microfractures in quartz produced by thermal and mechanical shock.
Multiple studies have reported characteristics of the geologic and impact-related metamorphism types observed in quartz. These types include planar deformation features (PDFs) [11–22], planar fractures (PFs) [20, 23], tectonic deformation lamellae (DLs) [7, 13, 14, 16, 19, 20, 24–27], and sub-planar shock micro-fractures [22, 28–33]. Here, the term “lamellae” denotes closed high-pressure stress features in quartz, whereas “fracture” denotes lower-pressure shock features.
Table 1 compares some commonalities and differences among the types of metamorphic features in quartz [10]. Our analysis of previous work demonstrates that shock fractures are significantly different from PDFs, PFs, and DLs. The most critical reported differences are that shock fractures are typically sub-planar rather than planar, sub-parallel rather than parallel, not crystallographically oriented, and form at lower shock pressures (see Table 1).
Characteristics of metamorphism of quartz.
| Characteristics | Shock fractures | PDFs | PFs | DLs |
|---|---|---|---|---|
| Fractures rather than lamellae | Yes | No | Yes | No |
| Features crystallographically controlled | No | Yes | Yes | Sometimes |
| Multiple oriented sets of fractures/lamellae | Weakly oriented | 1–6+ | 1–6+ | 1–2 |
| Planar fractures/lamellae | Sub-planar | Planar | Planar | Sub-planar |
| Parallel fractures/lamellae | Sub-parallel | Parallel | Parallel | Sub-parallel |
| Thickness of fractures/lamellae | nm to μms | Usually ≤1 μm | Usually ≥3 μm | Usually ≥2 μm |
| Features filled with amorphous silica | Often | Often | Sometimes | Never |
| Spacing between fractures/lamellae | nm to μms | Usually <1 μm | Usually >20 μm | Usually ≥5 μm |
| Estimated formation pressure (Gpa) | ≥3 | ~10–25 | <10 | <1 |
| Estimated formation speed | <1 sec | <1 sec | <1 sec | Very slow |
| Shared features: | 2 of 10 | 4 of 10 | 2 of 10 |
Previous studies of shock fractures [4, 8, 28, 29, 34] share 2 of 10 characteristics with planar deformation features (PDFs), 4 of 10 characteristics with planar fractures (PFs), and 2 of 10 with tectonic deformation lamellae (DLs). The green shading represents features in common with shock fractures in our study. Data are primarily derived from French and Koeberl [20]. The table is adapted from Hermes et al. [10] and is used under Creative Commons, CC by 4.0 (http://creativecommons.org/licenses/by/4.0/).
Abu Hureyra and the Younger Dryas impact hypothesis
This contribution presents new, comprehensive evidence of shock-fracturing of quartz grains supporting the hypothesis that a near-surface cosmic airburst occurred ~12,800 years ago over northern Syria and destroyed the well-known prehistoric village of Abu Hureyra (AH) [35–37]. Archeological investigations at this site (Figure 1) by Moore et al. [1, 36–38] revealed that the site was continuously occupied by humans who initially practiced hunting-and-gathering in the late Epipaleolithic (~13,400 cal BP) before transitioning to full-scale farming by the early Neolithic (~7,500 cal BP) [1]. Moore et al. [2] proposed that the Younger Dryas (YD) impact event (~12,800 cal BP) abruptly triggered YD climate change, which produced cooler, drier conditions at Abu Hureyra. These changes, in turn, caused the villagers to begin practicing the earliest known continuous cultivation of domestic-type grains and legumes and to start tending livestock [39], fundamental steps that eventually developed into full-scale agriculture and animal husbandry over subsequent millennia.
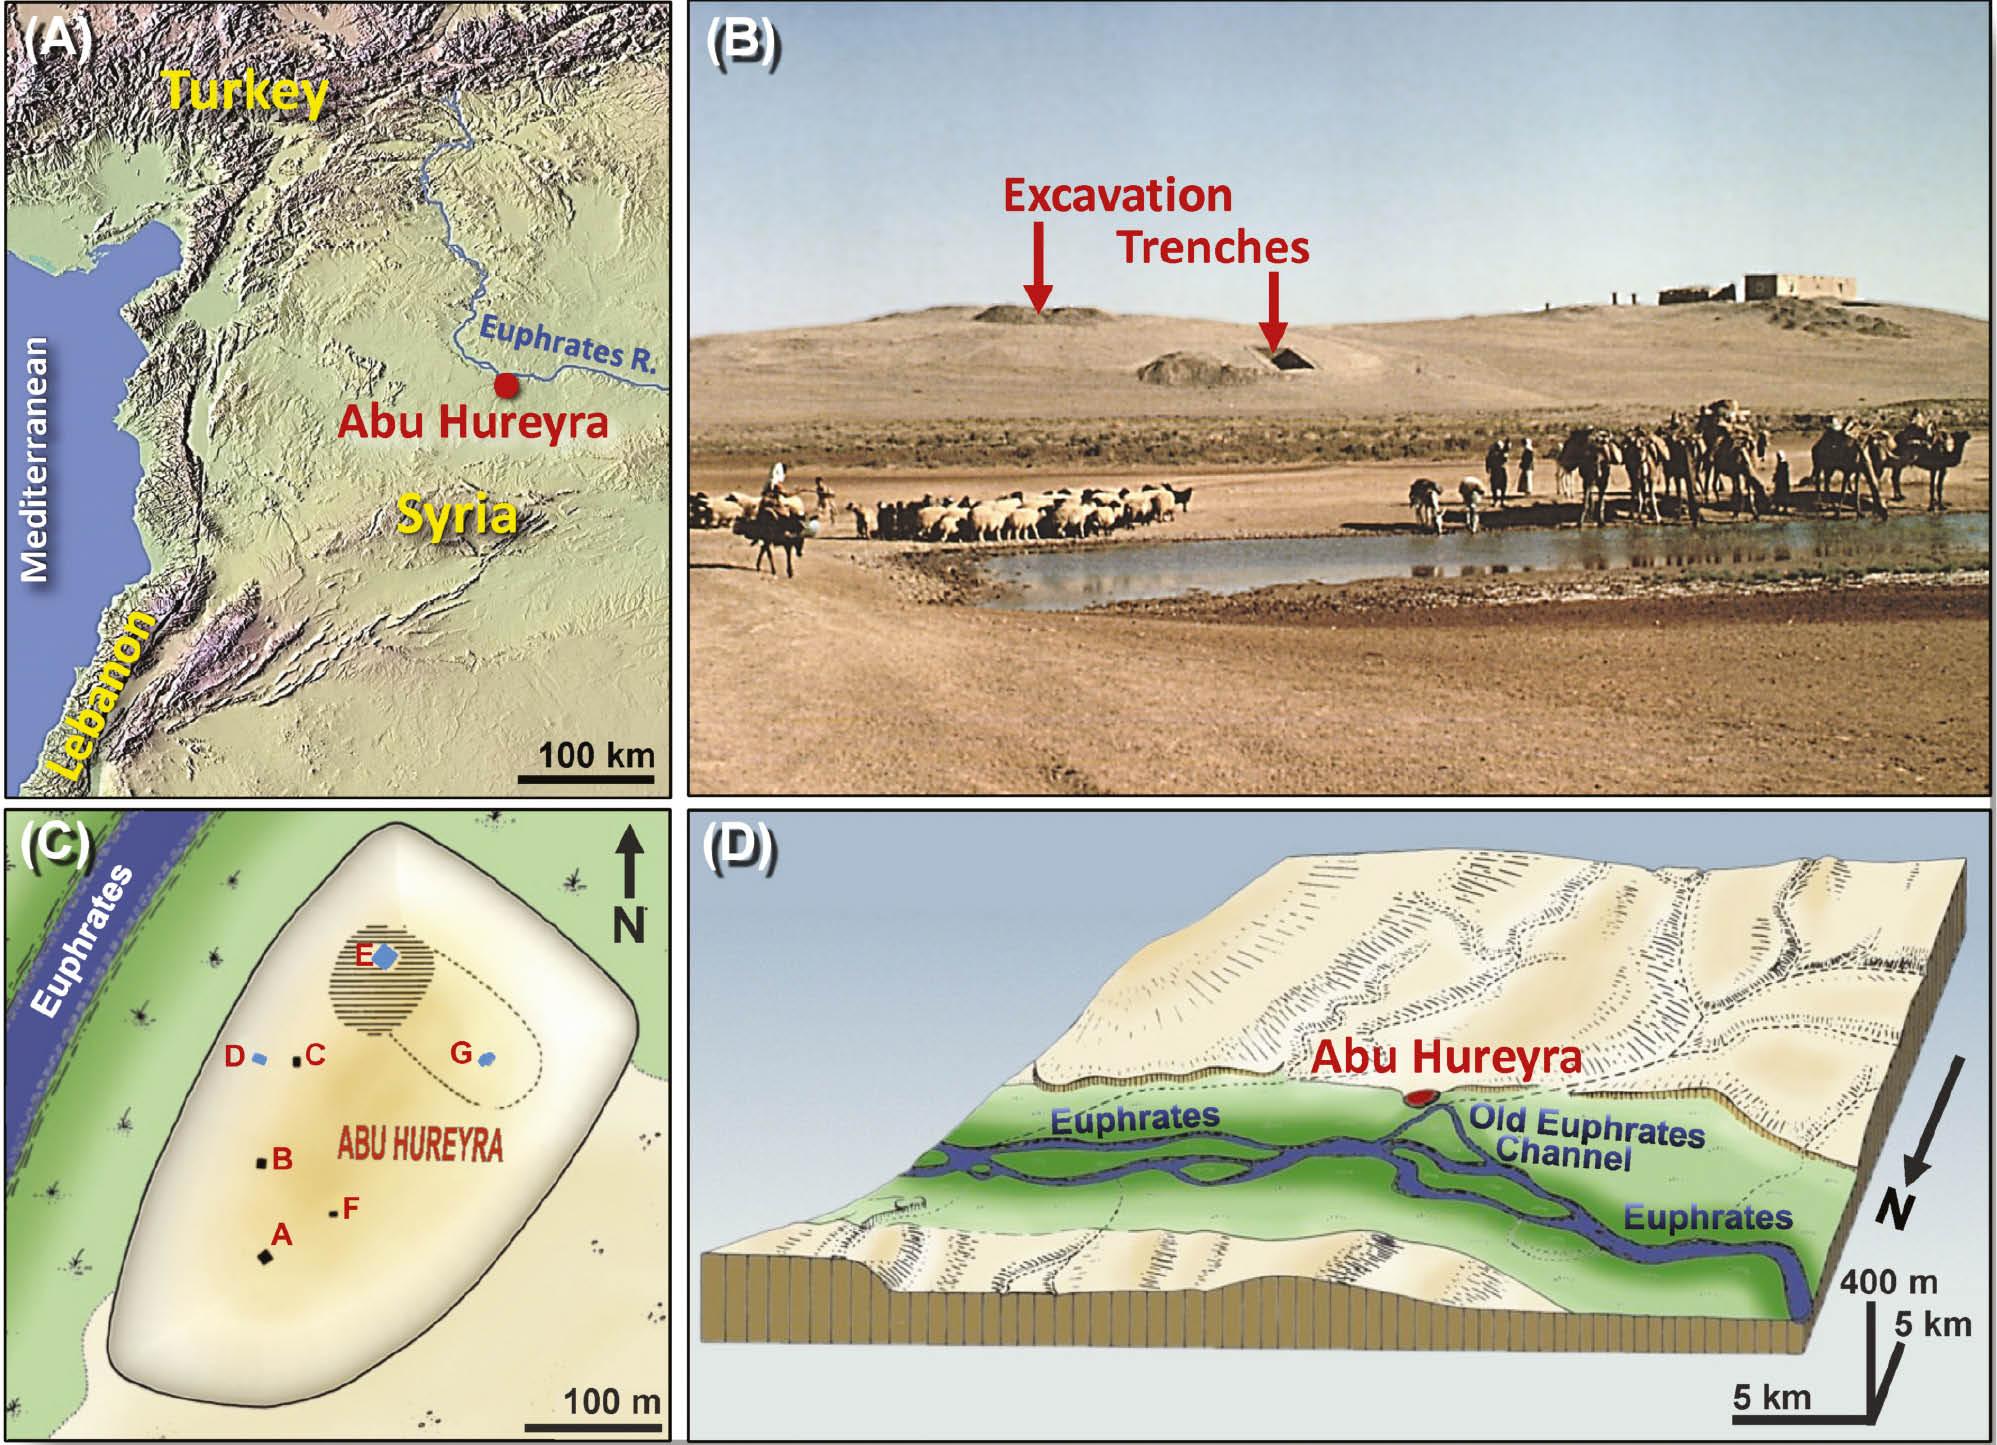
Location of Abu Hureyra. (A) Map of the Middle East, showing Abu Hureyra’s location along the Euphrates River in Syria. (B) Photograph of the large Abu Hureyra tell shows the locations of several key excavation trenches. (C) Map of the Abu Hureyra tell, showing locations of excavation trenches labeled A through G. Sediment samples from Trenches D, E, and G (small blue rectangles) contain the YDB layer, identified by peak abundances of impact-related proxies, including nanodiamonds, micro-spherules, meltglass, and platinum. (D) Artist’s depiction of the Abu Hureyra site at the YD onset (~12,800 cal BP), located along the floodplain edge close to a now-abandoned braid of the Euphrates River. Adapted from Moore et al. [1, 37, 38], usable under Creative Commons, CC by 4.0 (http://creativecommons.org/licenses/by/4.0/).
This impact event at Abu Hureyra is an integral part of the Younger Dryas Impact Hypothesis that posits multi-continental cosmic airbursts/impacts recognized at >50 locations spanning >100 million km2 across North and South America, Europe, Asia, and Africa [35, 40–64]. Here, “airburst” refers to a near-surface atmospheric detonation by a cosmic object, resulting in a high-temperature, hypervelocity jet of ionized gases and debris that reaches Earth’s surface [65–67].
The Younger Dryas was a significant climatic event between 12.8 ka and 11.6 ka that broadly triggered cooling in the North Hemisphere at high- to mid-latitudes and warming in high- to mid-latitudes of the Southern Hemisphere [54]. The impact layer has been named the YD boundary layer or YDB, a term used here to signify the YD onset ~12,800 years ago [49] rather than its termination [40].
Study objective
It is well established that shocked quartz characteristics can be formed and represent a proxy of cosmic impact events. However, most previous shocked quartz studies focused on its formation under extremely high pressures and temperatures produced by large, crater-forming impact events [10]. In contrast, few investigations have examined quartz shock features that may form at lower pressures and temperatures produced by non-crater-forming airbursts and impacts that form small craters. Since smaller airbursts and impacts have occurred more commonly in the past than large crater-forming events [65, 67], it is crucial that shocked quartz be comprehensively studied to recognize these smaller events in the geologic record. Hence, this study of shocked quartz was stimulated by the observations of Hermes et al. [10], who investigated shock-fractured quartz grains from Arizona’s Meteor Crater, a 1.2-km-wide impact structure, and compared the grains to those from the 1945 near-surface Trinity nuclear airburst at the Alamogordo Bombing Range, New Mexico, and two airbursts at a Kazakhstan test site in 1949 and 1953. This investigation demonstrated that glass-filled shock fractures and Dauphiné twinning in quartz could form during near-surface nuclear airbursts and crater-forming impact events in which the high-temperature, high-pressure fireball is coupled with Earth’s surface. This discovery implied that these features may also form during near-surface cosmic airbursts.
Our study investigated thin-sectioned individual quartz grains from the Abu Hureyra sequence in search of similar glass-filled shock fractures and Dauphiné twinning. We tested the hypothesis that if the previously identified cosmic impact proxies indicate a high-energy near-surface airburst near Abu Hureyra, as previously posited, this impact may also have produced shock metamorphism in quartz grains preserved in the YDB cosmic impact layer but not in adjacent sediments above and below.
Previous reports of YDB shocked quartz
Although no shock metamorphism of quartz grains has previously been identified from the Abu Hureyra site, potentially shocked quartz grains have been reported in YDB-age sediments in four other sites: Demitroff et al. [68] from Newtonville, New Jersey (12,783 ± 29 cal BP); Mahaney [46] from the MUM 7B site in the Venezuelan Andes (12,787 ± 30 cal BP); Ballard and Bijkerk [69] near Ossendrecht, Netherlands (~12.870–13,200 cal BP); and Van Hoesel et al. [70] a single classically shocked quartz grain at Aalsterhut, Netherlands (12,740–12,710 cal BP). Other than Van Hoesel et al. [70], these studies were limited in scope for the analytical techniques employed for the robust characterization of shocked quartz. In the case of the study by Van Hoesel [70], only one shocked quartz grain was found and described, and the presence of this grain was attributed to reworking (secondary deposition) into sediments of YDB age. Nevertheless, these investigations, along with the results of Hermes et al. [10] for the nuclear airbursts, encouraged us to search for shocked quartz at Abu Hureyra. We chose this site because of its importance as an archeological site, the presence of the YDB cosmic impact layer, and robust radiocarbon dating.
Site setting stratigraphy and chronology
Abu Hureyra is an ancient settlement mound or “tell” in northern Syria adjacent to the Euphrates River floodplain [1, 38] (Figure 1). The site is situated on the southwest bank of a bend in the Euphrates River atop a low terrace that was above the flood level of the river valley (Figure 1D). A dam across the river was completed in 1974; today, the site is submerged beneath the surface of the reservoir, precluding further above-water access.
In 1972 and 1973, several trenches were excavated through anthropogenically-deposited sandy Quaternary alluvium to bedrock, which consists predominantly of chalky limestone intercalated with thin beds of fine-grained chert and marls of Middle and Upper Eocene age [38]. Trench E was ~122 m from Trench D and ~110 m from Trench G; Trenches D and G are ~175 m apart [38] (Figure 1C). All the trenches contain archaeological strata deposited over bedrock [38].
Immediately above bedrock in Trench E, Moore et al. [38] identified a bed of unconsolidated, brown, limey sand (thickness: ~10 to 50 cm) of Allerød age (range: ~13,380 to 12,800 cal BP). Just above the Allerød bed, they also identified an ~12,800-year-old layer, a thin bed of unconsolidated, dark-brown, charcoal-rich sand with a thickness of ~3 to 5 cm at ~405 cm below surface (cmbs) [38], which is the YDB layer. The YDB stratum was overlain by a gray limey sand layer that varied in thickness from ~15 to 60 cm and ranged in age from ~12,800 to 11,700 cal BP [37, 38], spanning the Younger Dryas climate episode. This bed, in turn, was overlain by several meters of Holocene-age limey clay derived from the erosion of successive mudbrick buildings that extend to the ground surface [38]. We adopted the Bayesian-modeled calibrated radiocarbon age of 12,800 ± 40 cal BP at 68% CI for the YDB layer as used in Moore et al. [1].
Methods
At Abu Hureyra, eight available sediment samples that discontinuously span the YDB layer were investigated for candidate grains of shocked quartz (Table 2). A single 26 × 46-mm thin-sectioned slide was prepared and analyzed for each sample (see Appendix, Methods). We employed a comprehensive suite of analytical techniques and instruments to study these thin sections. These included optical transmission microscopy (OPT), epi-illumination microscopy (EPI), scanning electron microscopy (SEM), energy dispersive spectroscopy (EDS), focused ion beam milling (FIB); transmission electron microscopy (TEM); scanning transmission electron microscopy (STEM); fast-Fourier transform (FFT); electron backscatter diffraction (EBSD); cathodoluminescence (CL); and micro-Raman. All procedures and instruments are discussed in detail in Appendix, Methods below. Each slide was carefully searched for candidate grains of shocked quartz using optical and transmission microscopy. Grains exhibiting closely-spaced, oriented fractures are considered candidates for shocked quartz, with each requiring focused investigations using multiple techniques. Descriptions of techniques presented below are adapted from Hermes et al. [10], which shares ten co-authors with the current study. These descriptions are publishable under Creative Commons, CC by 4.0 (http://creativecommons.org/licenses/by/4.0/).
Stratigraphic distribution by depth of potential cosmic impact-related indicators and other proxies for the Abu Hureyra sequence.
| Level # | Sample # | Depth (cm) | Shocked Quartz | Nanodiamonds (ppb) | Magnetic spherules (#/kg) | Meltglass (g/kg) | Plant-imprinted glass | Organic material (mL/L) | Carbon spherules (#/kg) | Soot (%) |
|---|---|---|---|---|---|---|---|---|---|---|
| 19 | ES4 | 82 | No | 0 | 0 | 0.00 | Yes | – | 15 | – |
| 337 | ES7 | 192 | No | 0 | 0 | 0.00 | Yes | – | 0 | – |
| 361 | ES10 | 202 | No | 0 | 0 | 0.02 | Yes | – | 0 | – |
| 362 | ES11 | 222 | No | 0 | 0 | 0.04 | Yes | – | 0 | – |
| 402–406 | ES14 | 350 | No | 0 | 0 | 0.23 | Yes | – | 0 | 0.28 |
| 445 | E301 | 405 | Yes | 443 | 595 | 15.76 | Yes | 245.0 | 152 | 6.40 |
| 435 | ES15 | 432 | No | 0 | 20 | 0.66 | Yes | – | 0 | 0.24 |
| 470 | E326 | 446 | No | – | 0 | tr | Yes | 0.25 | – | – |
Results and interpretations using multiple techniques
We observed no candidates for shock-fractured quartz in all samples above and below the YDB layer (E301) at 405 cm (Table 2), which was previously identified through the presence of multiple cosmic impact-related proxies. For this sample (E301), ~700 quartz grains were analyzed at a concentration of ~837 grains/cm2. We found no classic high-pressure shock lamellae (PDFs and PFs), but of the quartz grains examined, 24 displayed potential low-shock fractures, all of which contained amorphous silica. Some features may have been shock lamellae, but we could not distinguish the difference. Four were confirmed using multiple techniques as shock-fractured quartz grains for a ratio of ~1 per 175 grains. The other 20 grains are excellent candidates for shock-fractured quartz but were not exhaustively investigated and identified using all available techniques.
The identification of glass-filled, shock-fractured quartz requires multiple observations collectively using numerous analytical approaches. By necessity, therefore, the results of this investigation are graphic-intensive and presented in this contribution as multiple images and descriptive captions for each of the analytical techniques.
Epi-illumination microscopy (EPI) [10]
This analytical technique of reflected-light optical microscopy is valuable in viewing HF-etched quartz grains (Figure 2) displaying glass-filled fractures. Multiple studies have demonstrated the importance of performing such analyses after etching quartz grains with HF [7, 13, 14, 16, 71, 72]. According to Gratz et al. [14], the HF-etching removes some amorphous silica that filled the shock features, allowing for the “unambiguous visual distinction between glass-filled PDFs and glass-free tectonic deformation arrays in quartz.” Nevertheless, other techniques are still necessary to identify and characterize the filled material as amorphous silica, a key indicator of shock metamorphism [13, 14].

Epi-illuminated microscopy (EPI) and optical transmission microscopy (OPT), images of shock-fractured quartz grains. (A-B) ~460-μm-wide polycrystalline quartz grain 35x-09. (C-D) ~465-μm-wide polycrystalline quartz grain 36x-04. Gold arrows in epi-illumination (EPI) images (left column) indicate randomly selected shock fractures. The fractures were not easily visible with optical microscopy or epi-illumination before HF-etching. Optical images (right column) were acquired under crossed polarizers with dark-to-light contrasting areas, indicating the polycrystalline nature of the grains. Images were acquired with polarizers rotated ~10° off maximum for better visibility.
In contrast, tectonic stress lamellae are not visible in EPI as open fractures in geologically-deformed grains but may appear as shallow, closed depressions that lack filling amorphous silica. We tested this by examining six tectonically-deformed quartz grains and six unshocked natural quartz grains, revealing that none contain amorphous silica. All grains are from Abu Hureyra sample E301.
Optical transmission microscopy (OPT) [10]
Representative optical images of quartz grains are shown in Figure 2. Most display a single set of shock fractures, meaning all are oriented in approximately the same direction. However, a few grains display multiple sets or multiple non-oriented individual fractures.
Scanning electron microscopy (SEM) [10]
SEM backscatter secondary electron (BSE) analyses revealed filled fractures in quartz grains that appear mostly as sub-linear features, although some are curvilinear (Figures 3 and 4). Additional analyses were also necessary to identify and characterize the material filling the fractures.
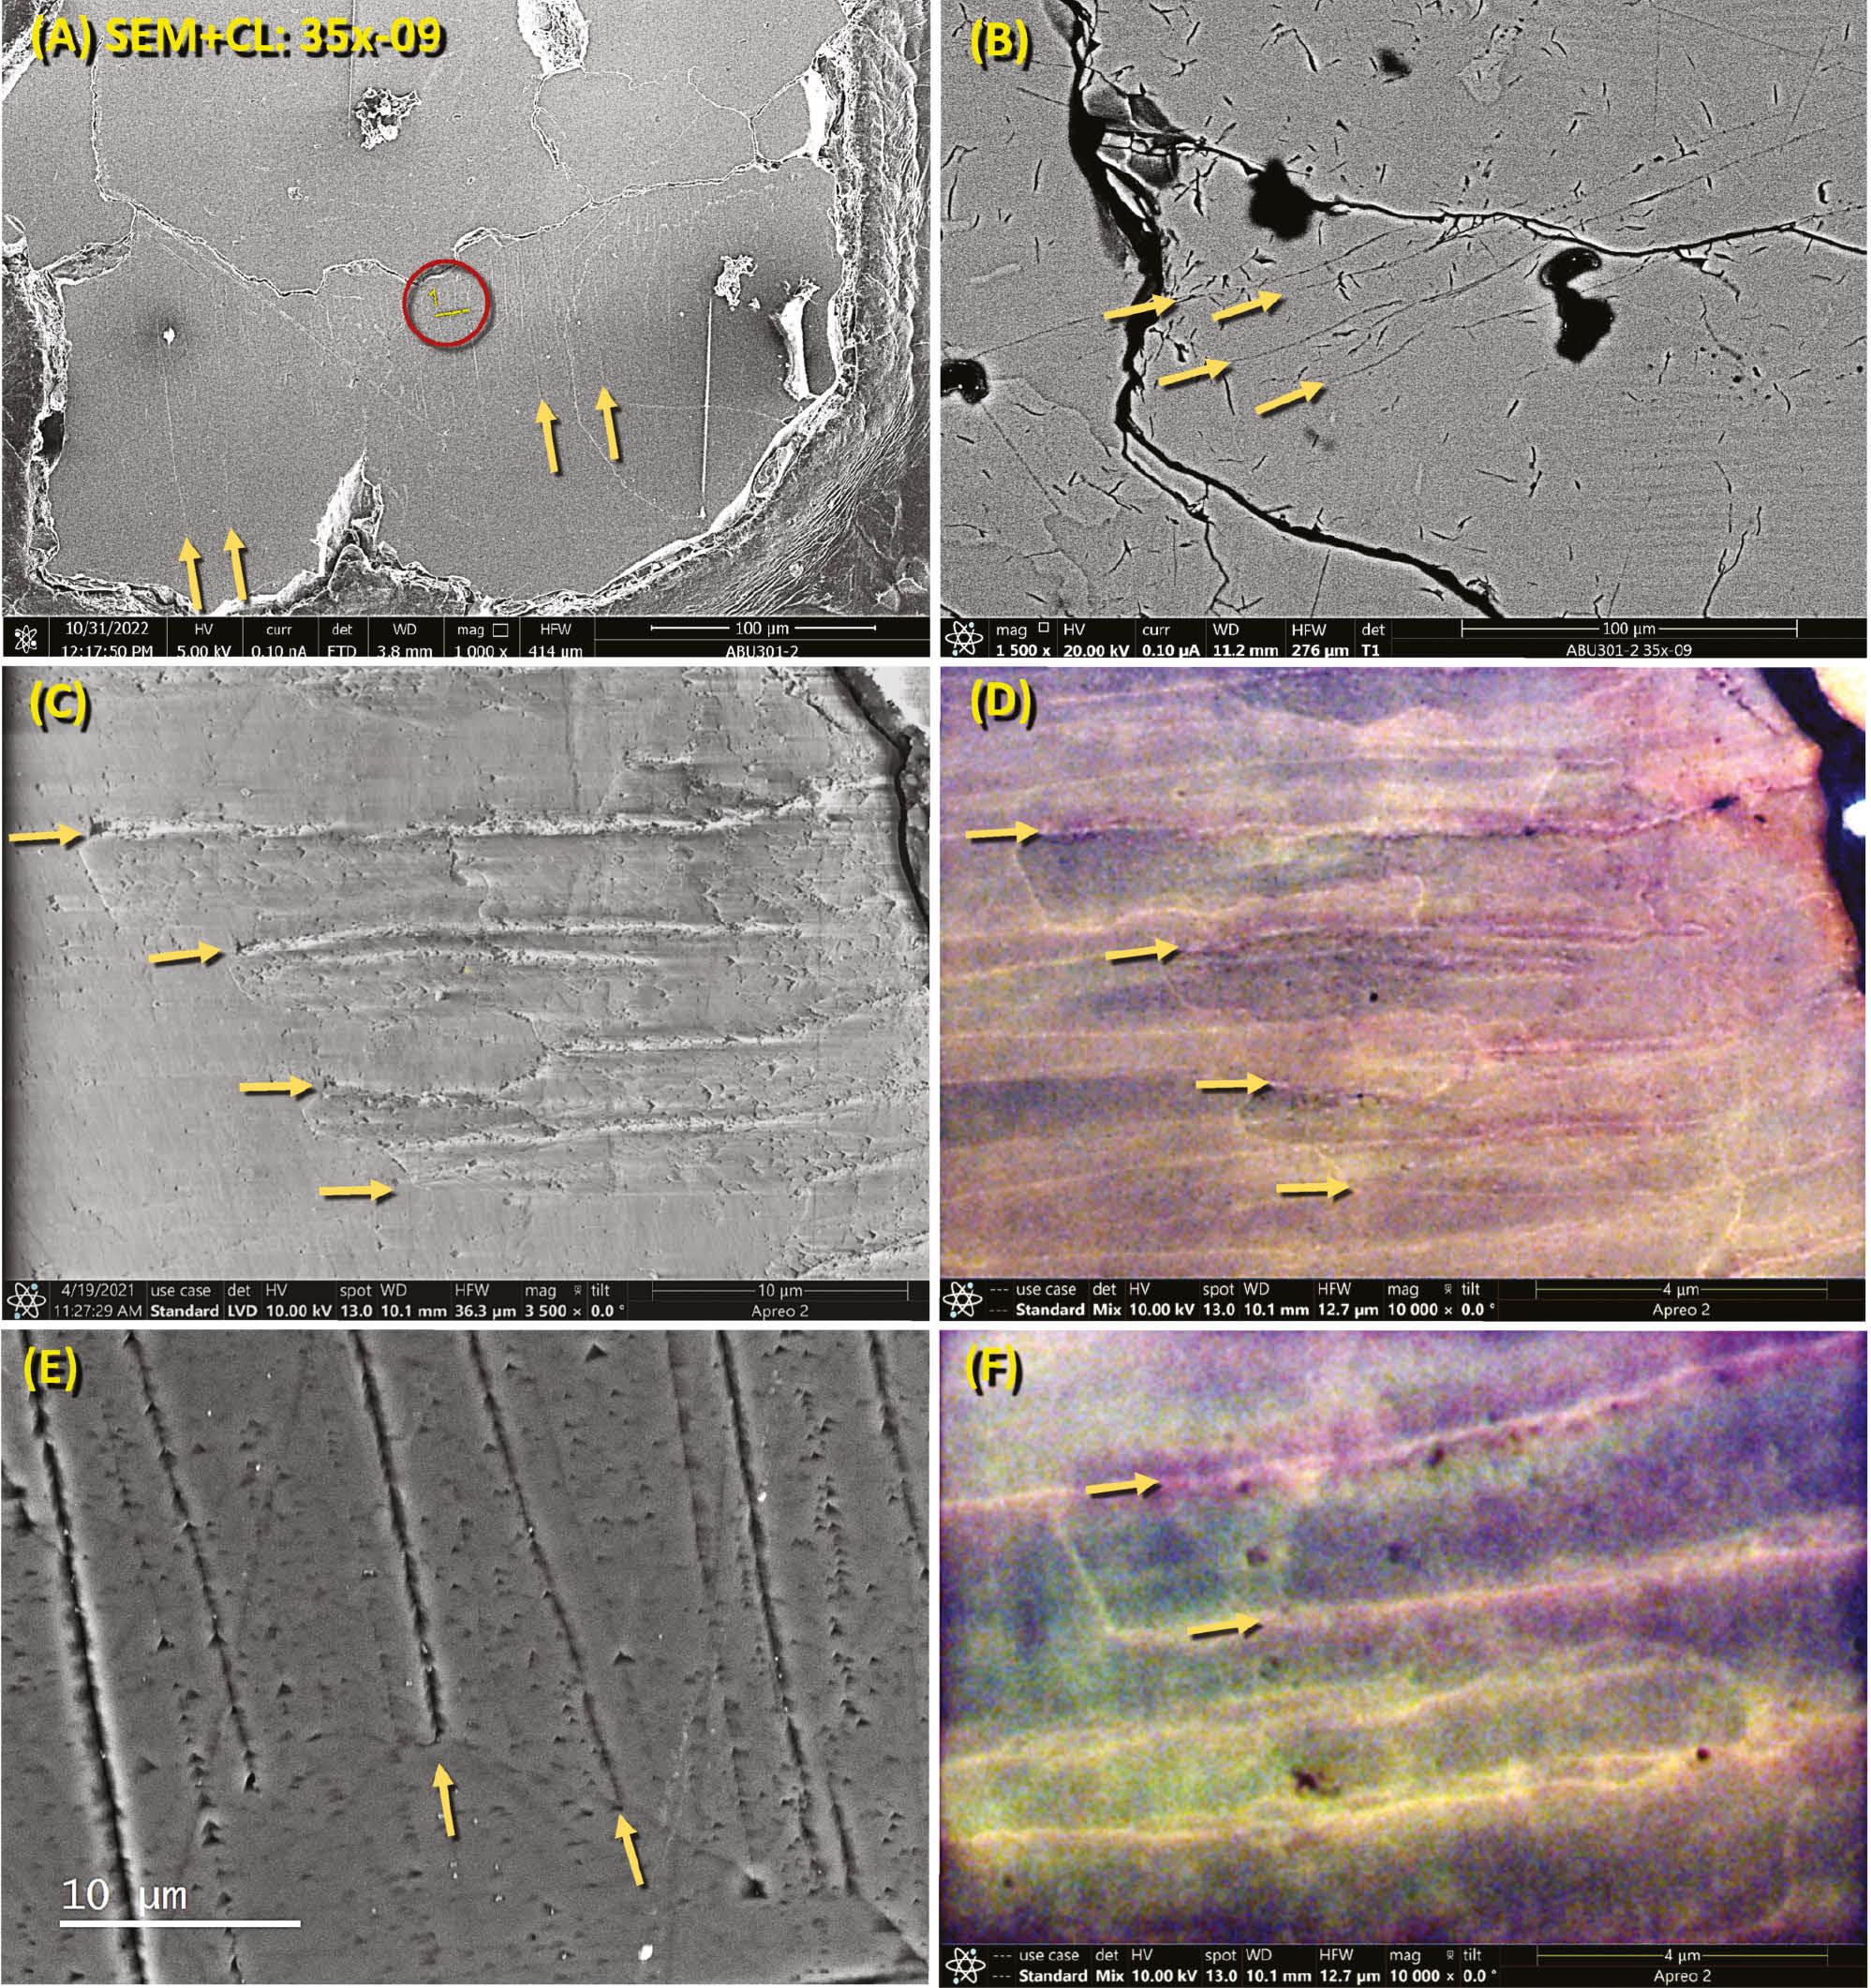
SEM and cathodoluminescence [CL] images of shock fractures in Abu Hureyra quartz grain 35x-09. (A) SEM-BSE image of shock-fractured grain. Gold arrows point in the direction of selected fractures. The red circle marks the lift-out location for focused ion beam milling. (B) Close-up SEM-BSE image of the same grain. Gold arrows point in the direction of selected fractures. (C) Close-up SEM-BSE image with gold arrows marking selected open fractures. (D) CL image of approximately the same area as in panel C. The dark-red-and-black colors signify the presence of open fractures containing amorphous silica, as reported in studies by Hamers et al. [16, 73–75]. The generally reddish color of the quartz matrix cysts signifies that it was likely partially to fully melted and then recrystallized. (E) SEM-BSE image showing open fractures exposed by HF etching. (F) Close-up CL image. This grain is from YDB sample E301, 405 cm depth.
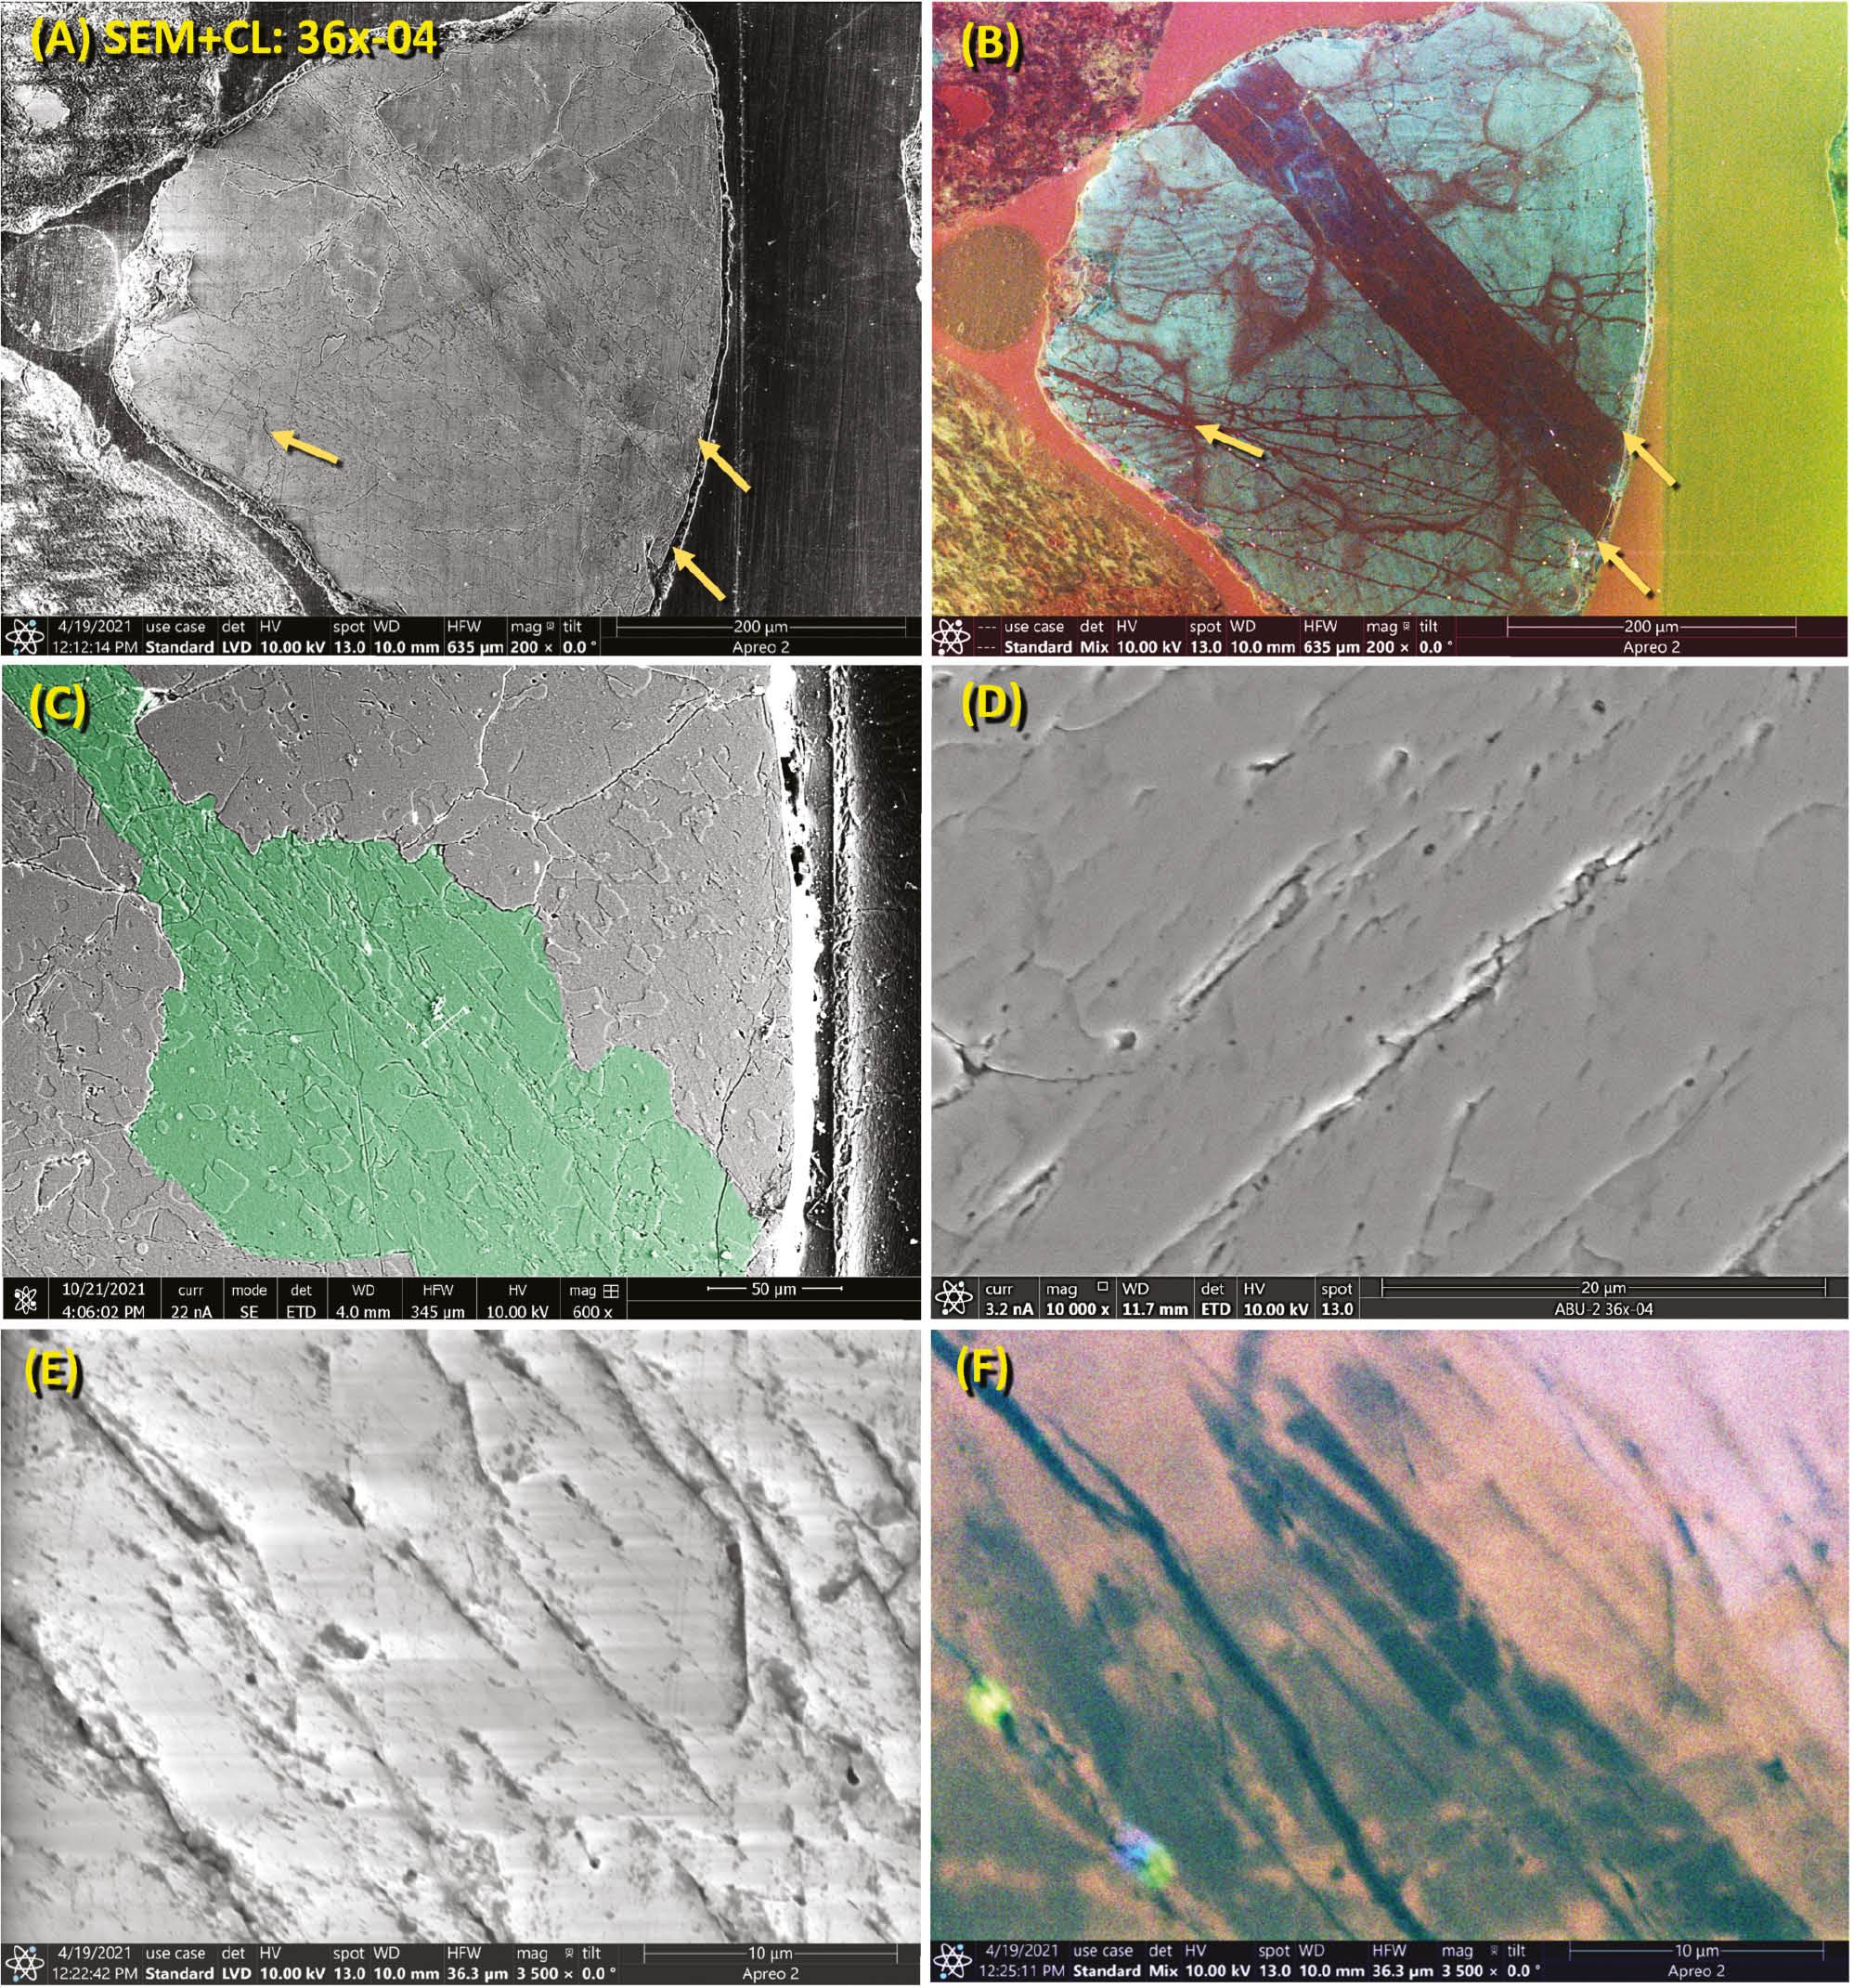
SEM and cathodoluminescence (CL) images of shock fractures in Abu Hureyra quartz grain 36x-04. (A) SEM-BSE image of polycrystalline quartz grain. Shock fractures at arrows. (B) CL image of the same area of the grain in panel A. The righthand two arrows mark a wide, dark-red-and-black area indicative of amorphous silica, confirmed by TEM. (C) SEM-BSE image of quartz with fractured subgrain highlighted in green. (D) Close-up SEM-BSE image showing open shock fractures, as exposed by HF etching. (E) Another SEM-BSE image shows open shock fractures. (F) CL image of the same area shown in panel E. Note that shock fractures are filled with non-luminescent black material, indicative of amorphous silica. This grain is from YDB sample E301, 405 cm depth.
Scanning transmission electron microscopy (STEM) [10]
FIB locations on the grains analyzed are shown in Figures 3 and 4. Using bright-field STEM, the 8- to 15-μm-wide foils display inter-fracture spacings ranging from ~250 nm to 3 μm. Nearly all shock fractures were observed to contain material that other analyses show to be amorphous silica. In contrast, HF-etched grains with visible tectonic deformation lamellae have not been observed to display any associated amorphous silica [10]. Similarly, unshocked, HF-etched, natural quartz grains display no visible lamellae [10].
Cathodoluminescence (CL) [10]
Representative CL images are shown in Figures 3 and 4. Under CL, fractures filled with amorphous silica have been reported to be commonly non-luminescent, i.e., black [16, 73, 75]. However, some amorphous silica has been reported to luminesce as red [76]. Alternately, natural, open fractures also appear black, and therefore, the possible presence of amorphous silica must be confirmed using TEM. Some sub-planar structures luminesce black and are not associated with fractures, thus indicating amorphous silica. According to previous studies [16, 73–75], if quartz luminesces red, it usually has been heated or melted and then recrystallized but no longer contains amorphous silica. Tectonic deformation lamellae may luminesce red but not black [16, 73–75]. In contrast, non-shocked quartz lattice under CL often luminesces blue but not black [16, 73–75].
Transmission electron microscopy (TEM) [10]
Images acquired using high-resolution TEM show sub-planar shock fractures containing thin bands of amorphous silica (Figures 5–9). Numerous filled inclusions or vesicles often contain glass or gases and are closely associated with shock fractures (Figures 5–7). Madden et al. [77] reported that multi-phase inclusions of glass, gases, and fluids are typical at Meteor Crater in sandstone lightly shocked at ≥5.5 to 13 GPa. In contrast, that study observed no multi-phase inclusions in samples formed at >13 GPa, suggesting that at Abu Hureyra, the fractures and inclusions formed at <13 GPa [77]. In contrast, unshocked tectonically-deformed quartz grains may display lines of bubbles, known as decorations, that form by the dissolution of quartz by water rather than by shock-related processes.
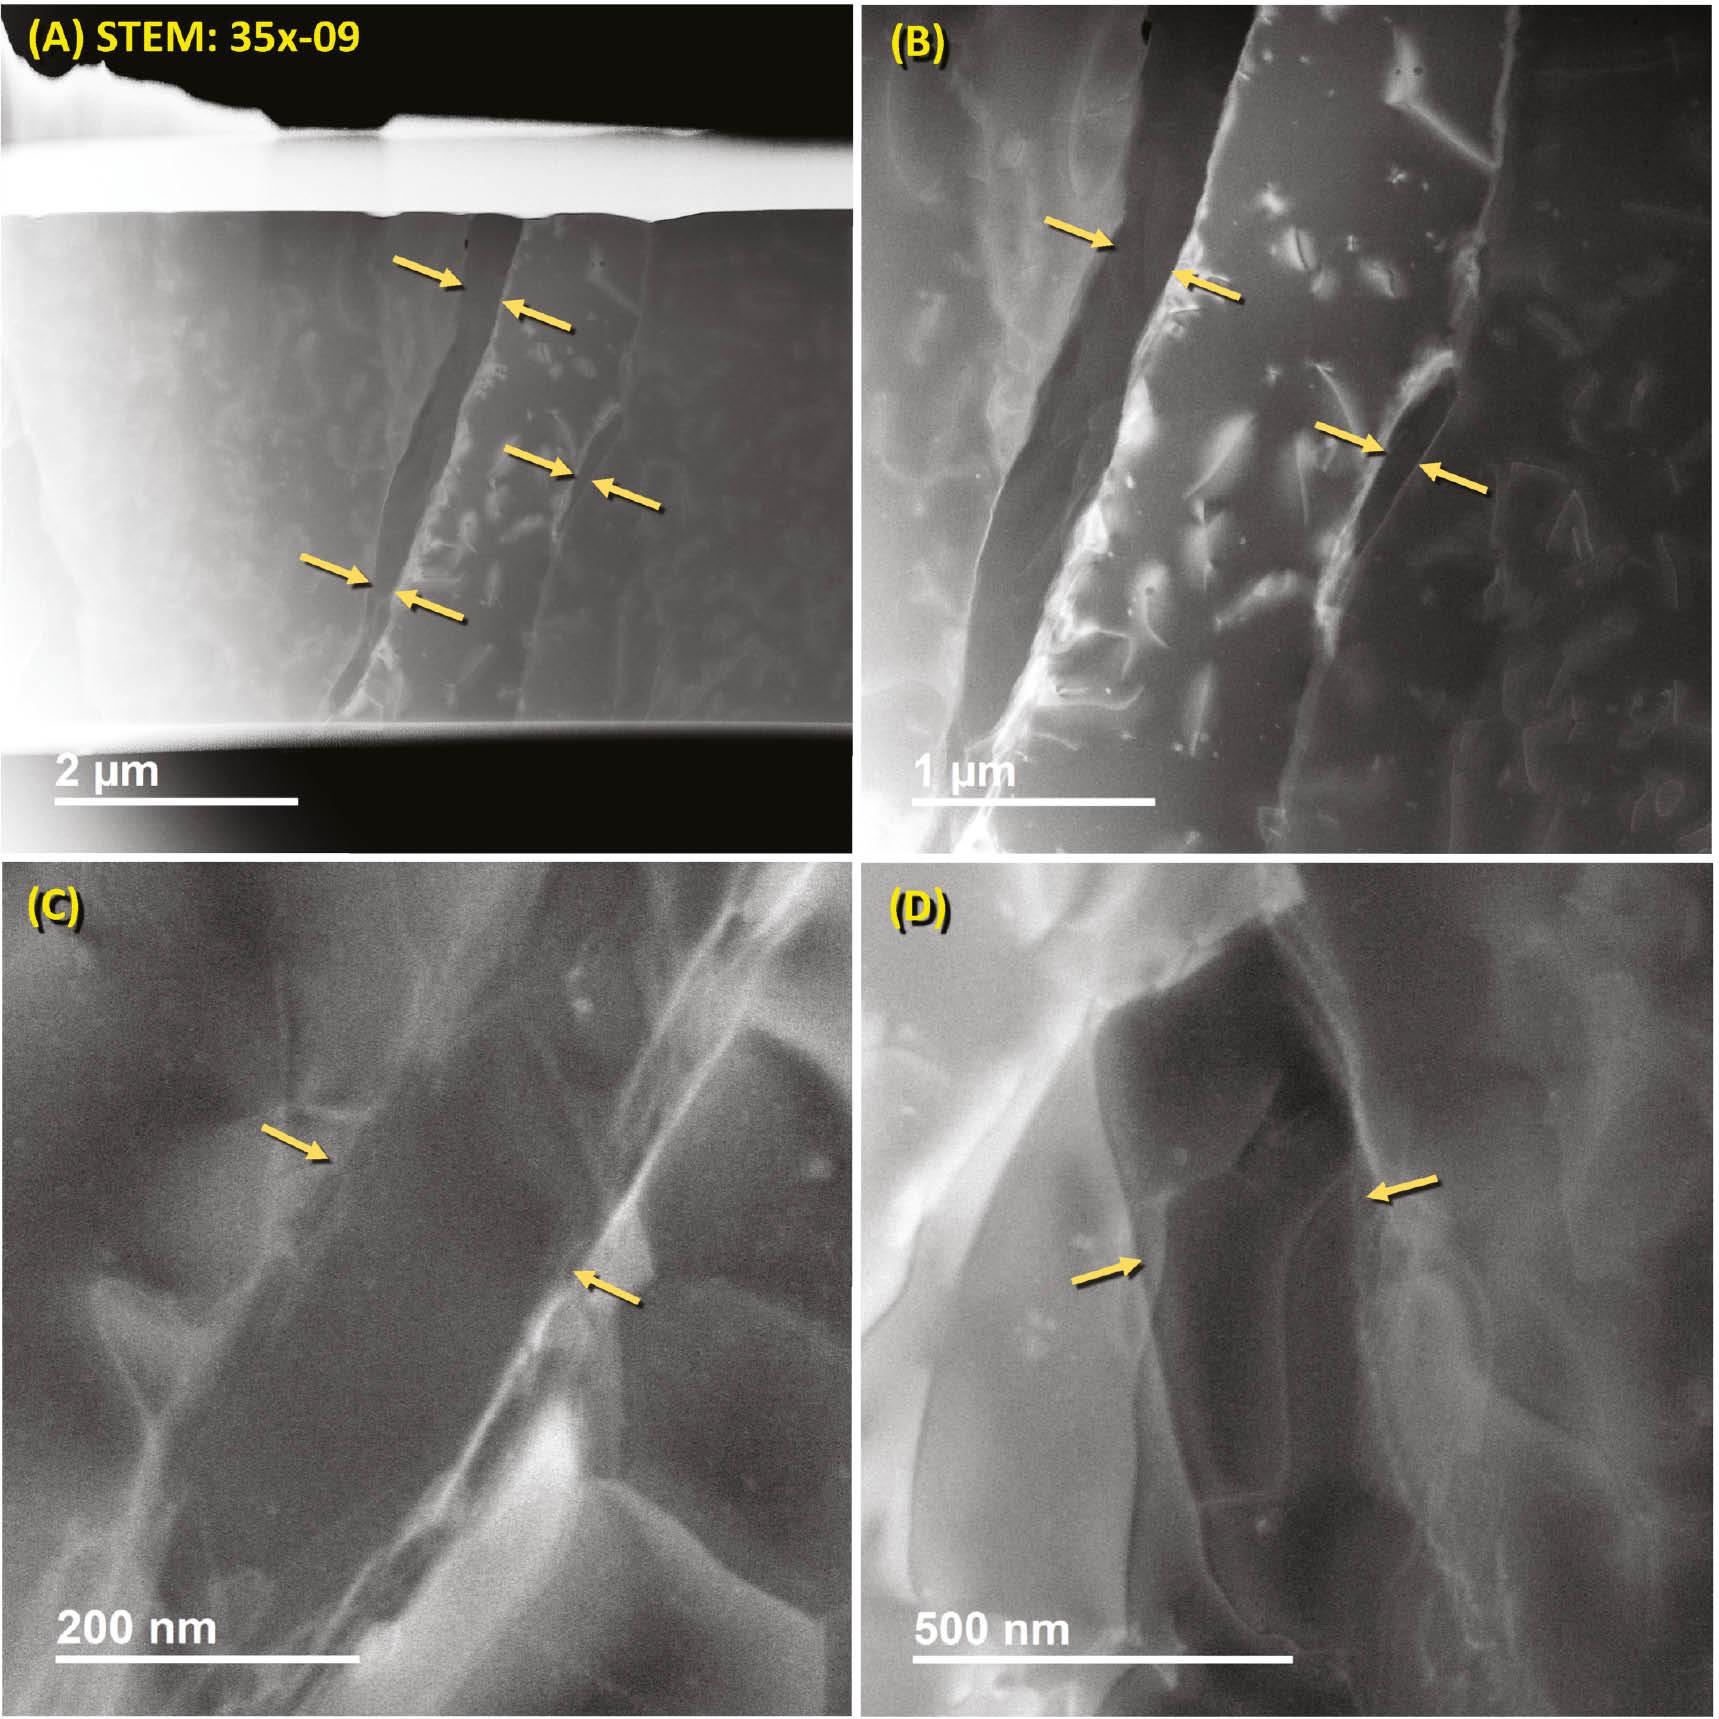
Scanning-transmission electron microscopy (STEM) images of Abu Hureyra shock-fractured quartz grain 35x-09. (A) Bright-field STEM image shows a glass-filled fracture between the gold arrows at the left. Right arrows mark a smaller glass-filled area. Glass filling was confirmed using other procedures documented below. (B) Close-up of the middle part of the grains shown in panel A. (C, D) Close-up images showing glass filling the areas between the gold arrows. This grain is from YDB sample E301, 405 cm depth.
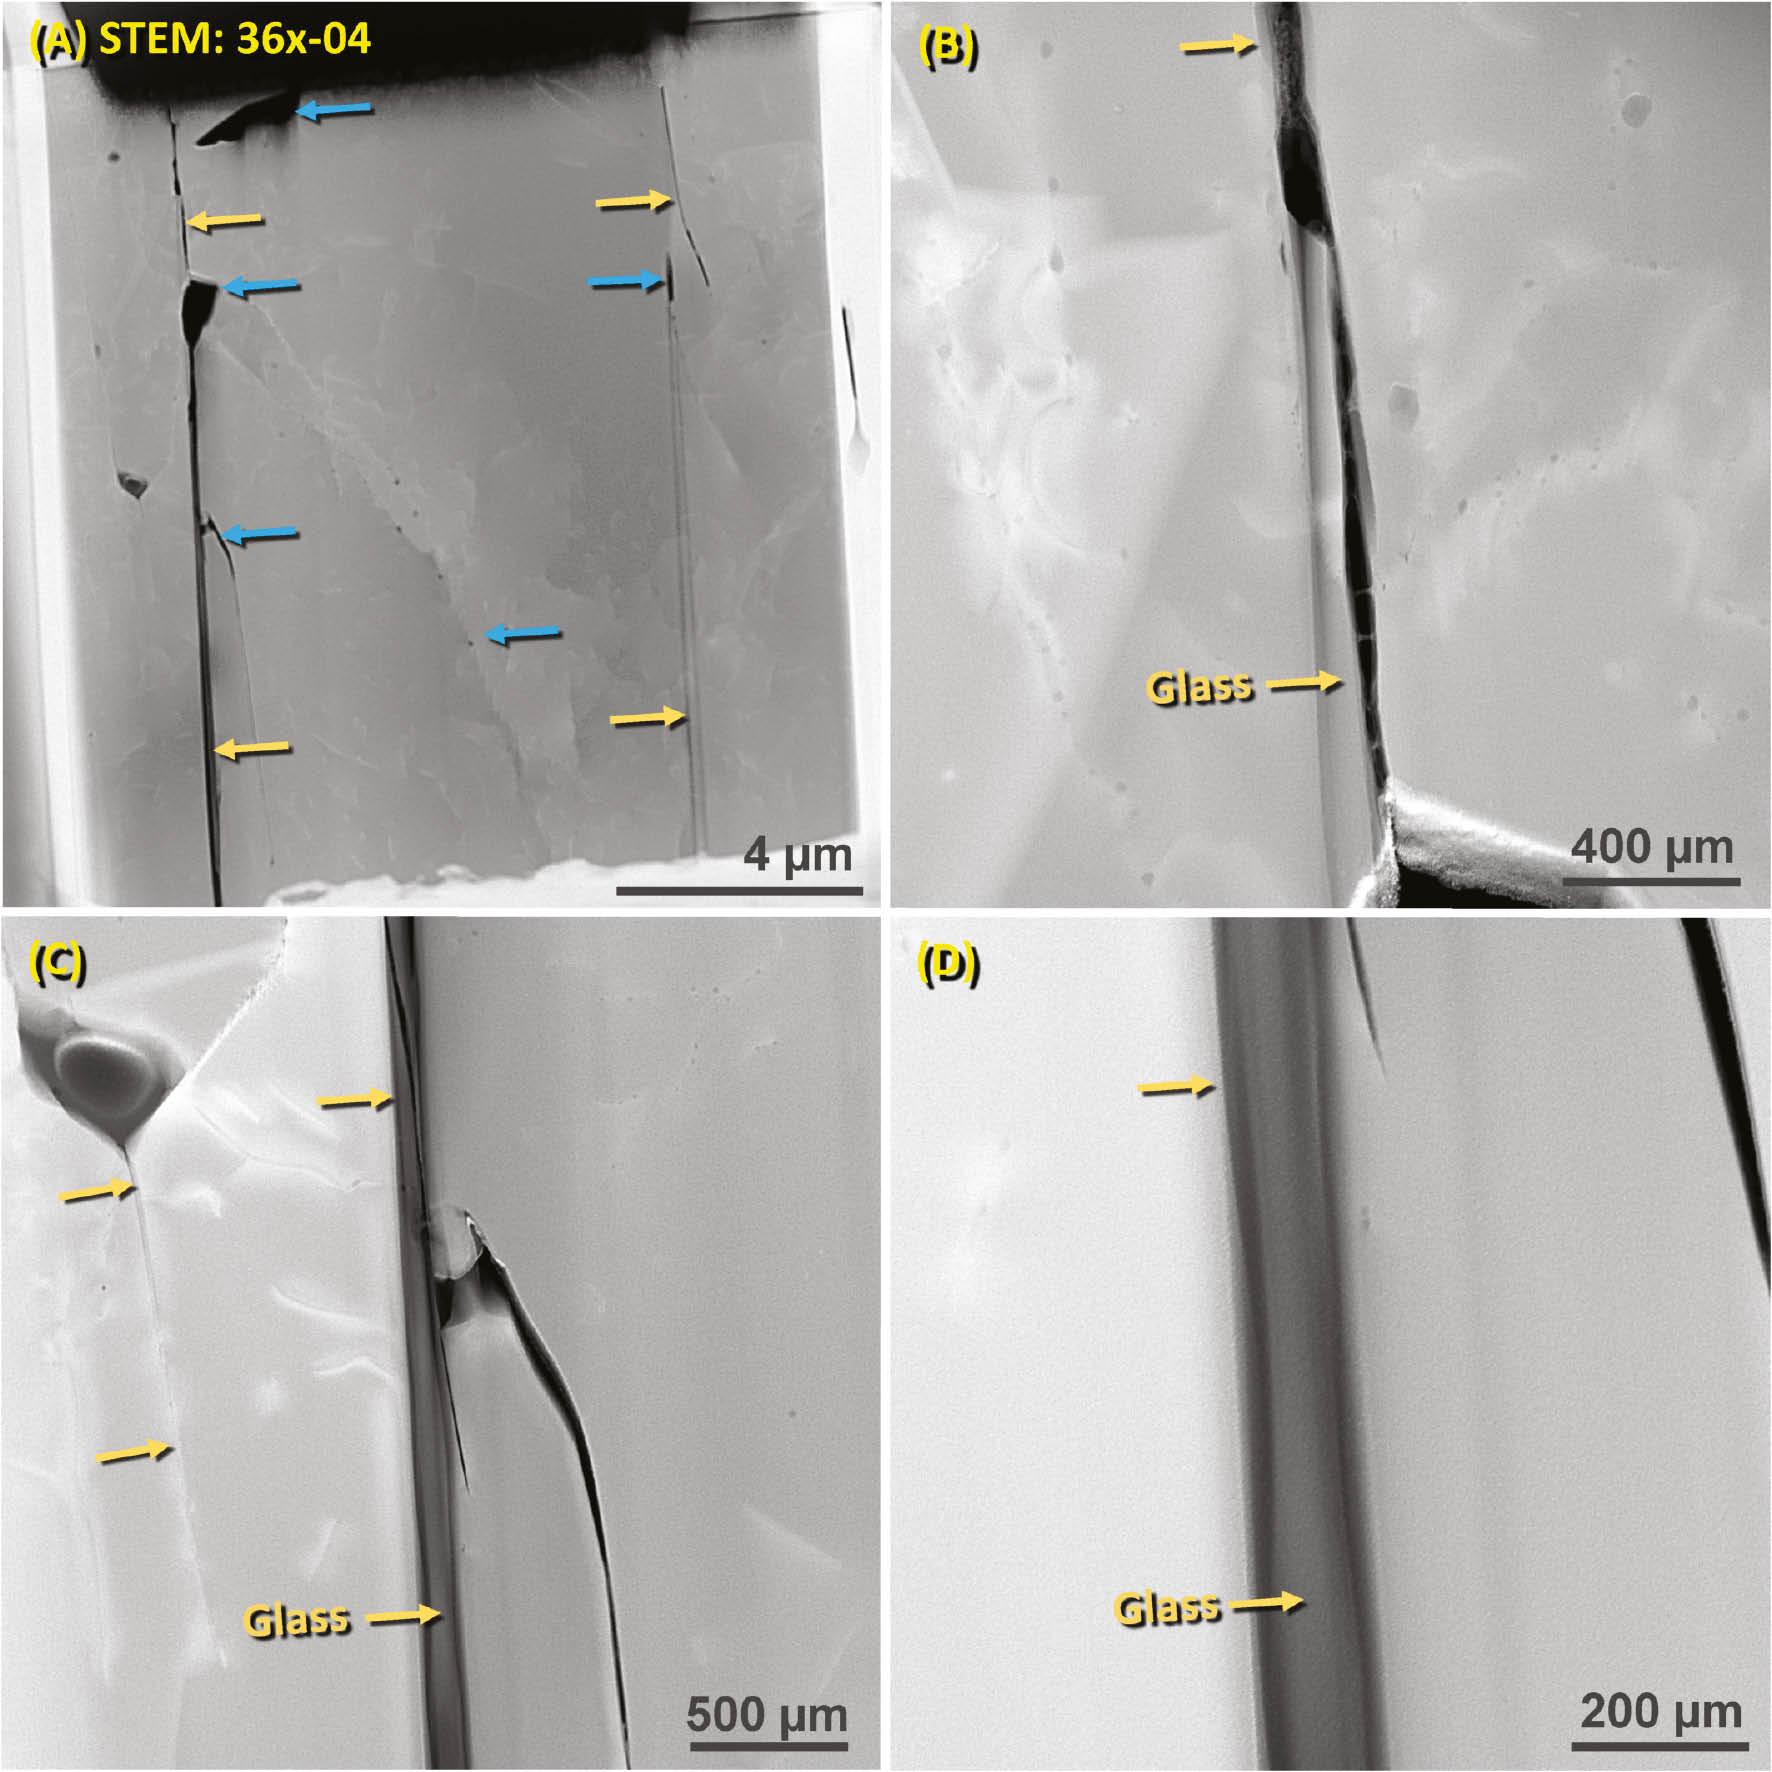
Scanning-transmission electron microscopy (STEM) images of Abu Hureyra quartz grain 35x-09. (A) Bright-field STEM image shows gold arrows indicating two sub-planar, sub-parallel glass-filled fractures. Blue arrows mark voids and vesicles in the quartz. Glass filling was confirmed by using other procedures, as documented below. (B) Close-up of right-hand shock fracture shown in panel A. (C, D) Close-up images with arrows indicating amorphous glass. This grain is from YDB sample E301, 405 cm depth.
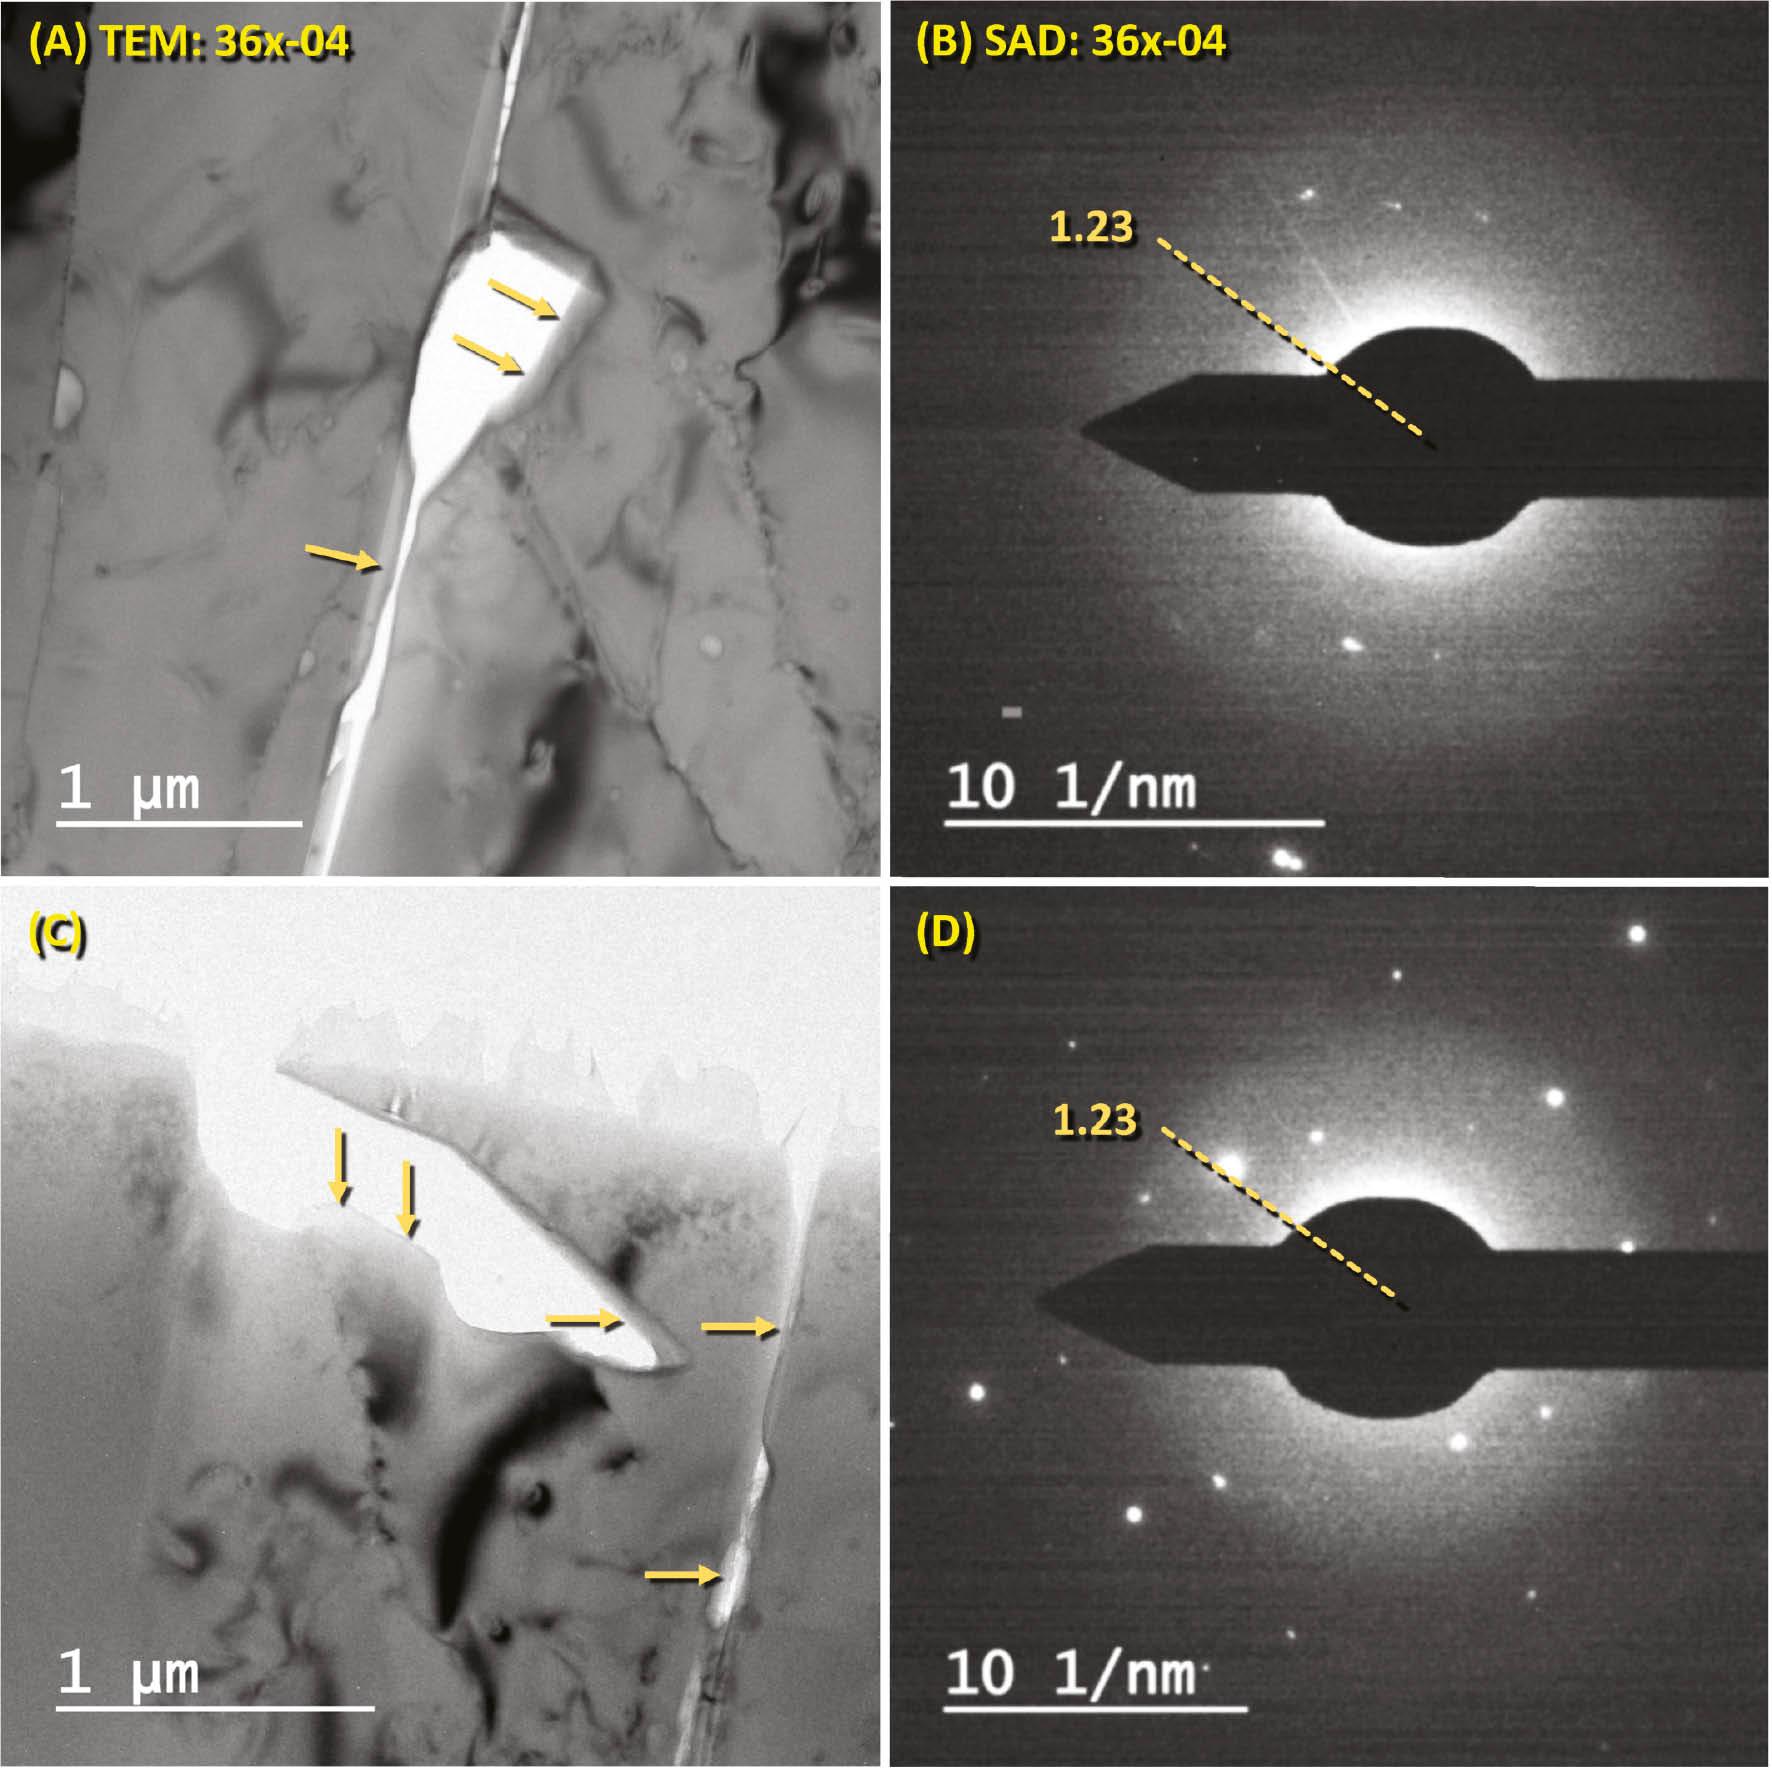
TEM and SAD images of quartz shock fractures filled with amorphous silica Abu Hureyra quartz from grain 36x-04. (A, C) TEM bright-field images of shock fractures. Arrows point to thin gray bands of amorphous silica. White areas represent voids and vesicles along the fractures. (B, D) SAD images showing diffuse rings indicative of amorphous silica. D-spacings of 1.23 Å are typical for the outer edge of the diffuse rings at the end of the dashed line. The grain is from sample E301.
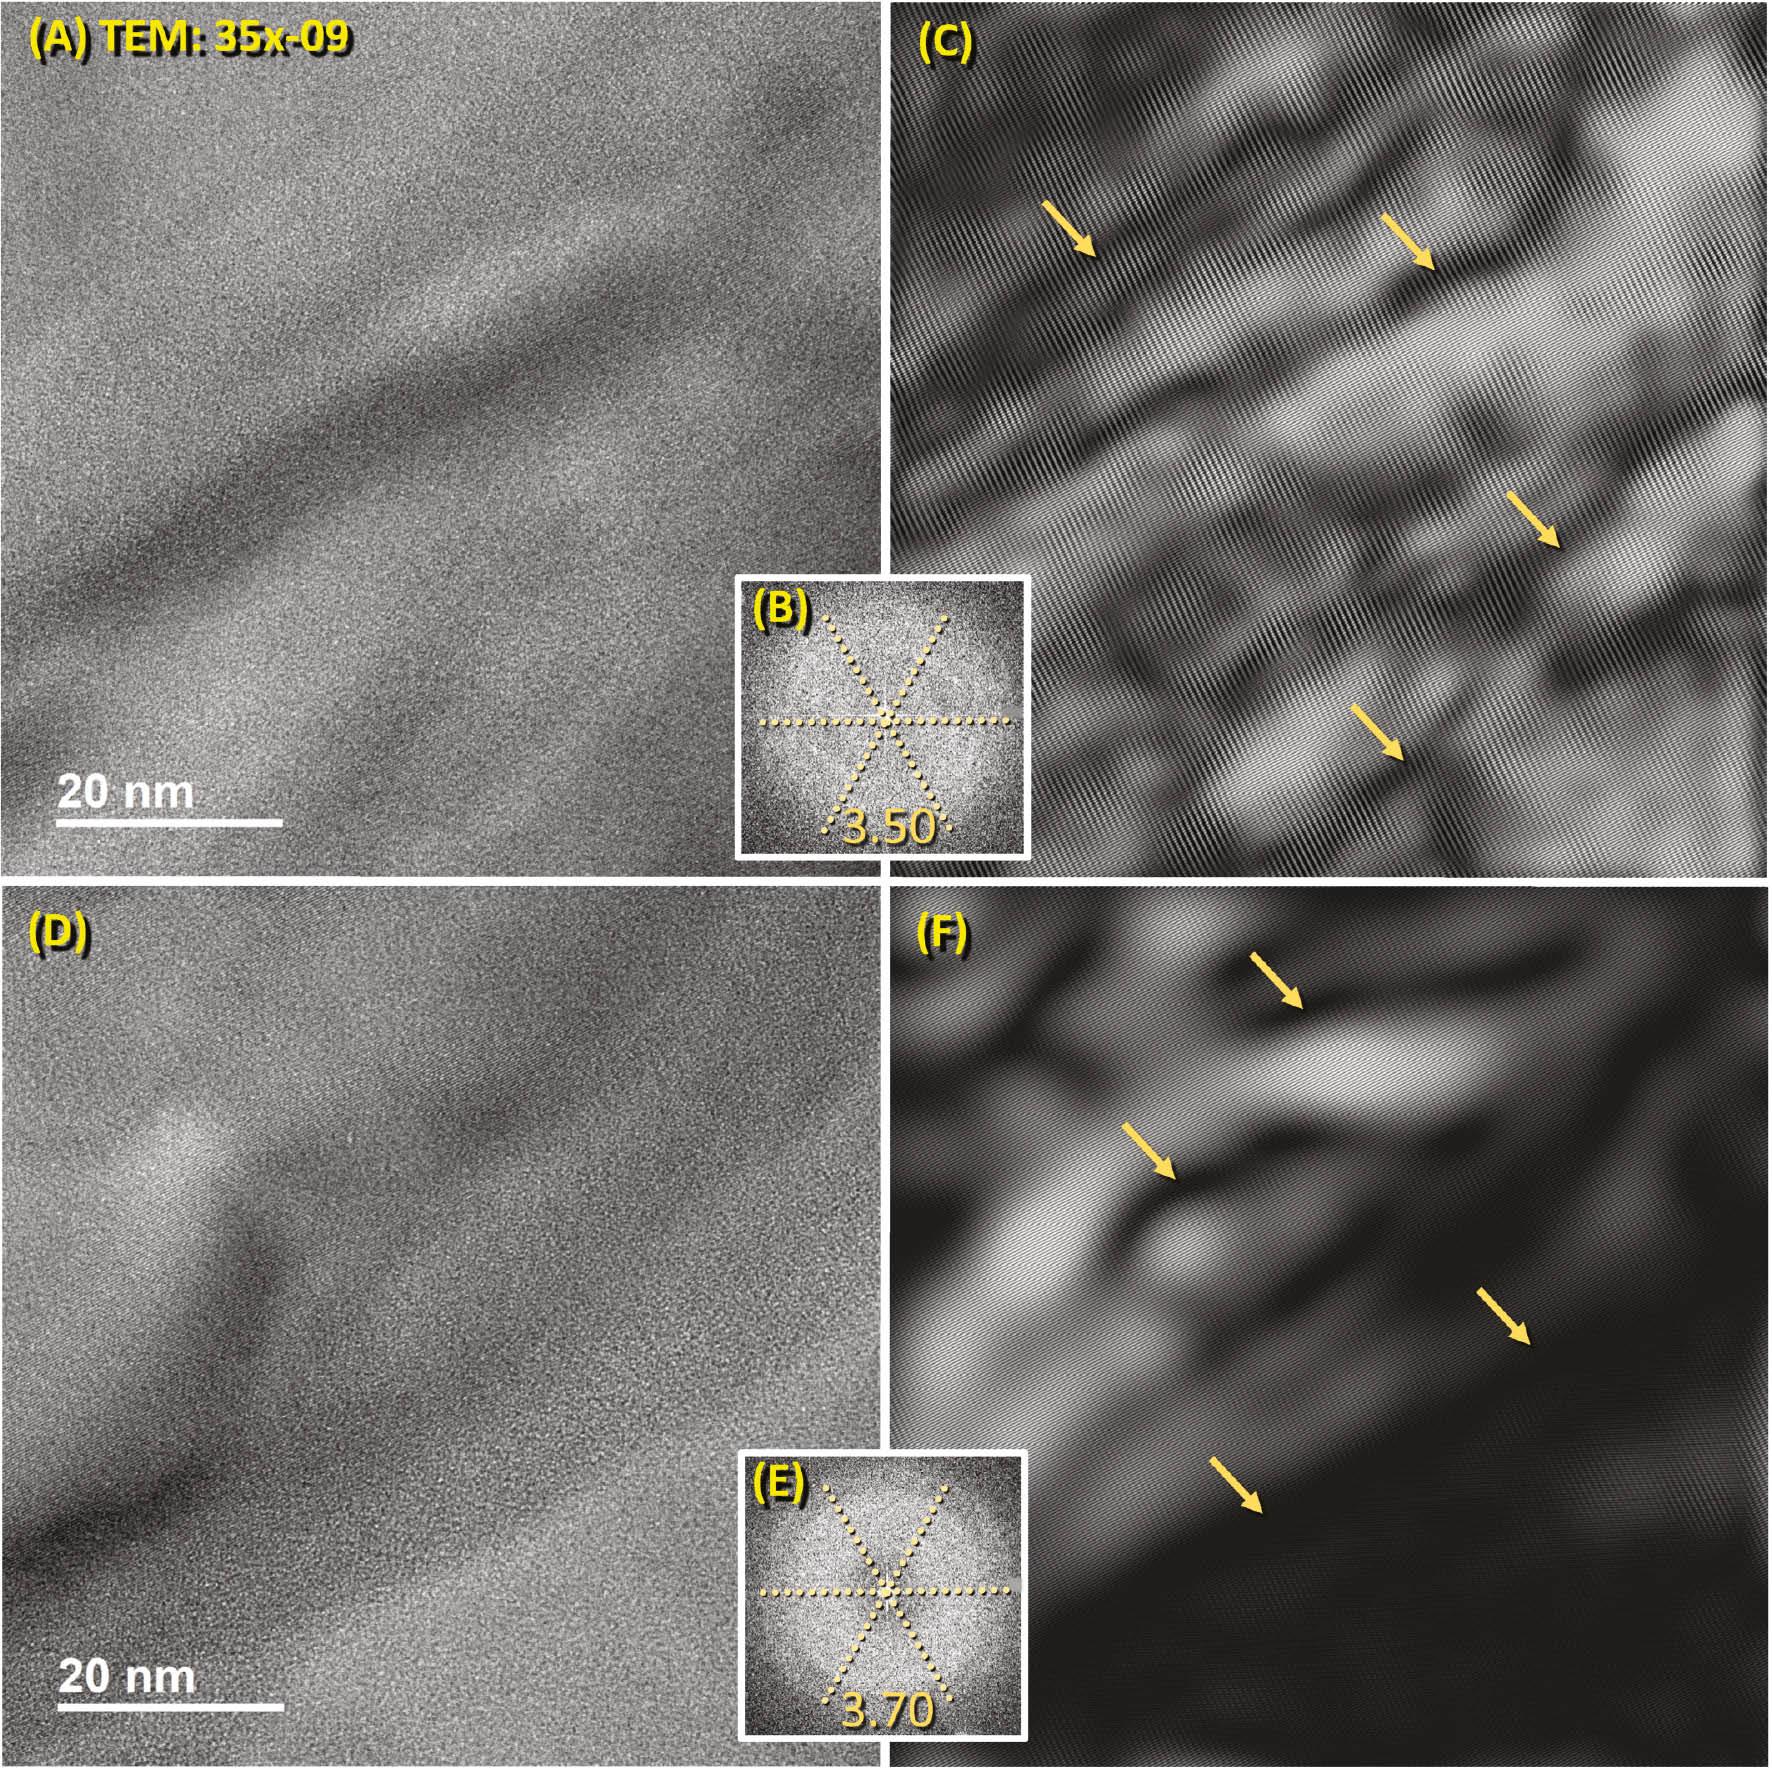
High-resolution Transmission electron microscopy (TEM) images of shock-fractured quartz grain 35x-09 filled with amorphous silica. (A, D) The high-magnification image shows the oriented texture of quartz grain. Crystalline lattice is visible in some areas but not in others. (B, E) Fast-Fourier Transform (FFT) image of the region represented by panel A. These FFT images exhibit a diffuse halo with respective d-spacings of 3.50 and 3.70 Å, indicative of the presence of amorphous silica. (C, F) Inverse Fast-Fourier Transform (IFFT) derived from spot diffraction patterns in full FFT image (not shown). The fields of view shown in the lefthand panels are the same as in the righthand panels. Lighter areas represent fully crystalline quartz, and dark areas represent damaged crystalline lattices containing some amorphous silica, as confirmed by FFT and selected area diffraction (SAD). This grain is from YDB sample E301, 405 cm depth.
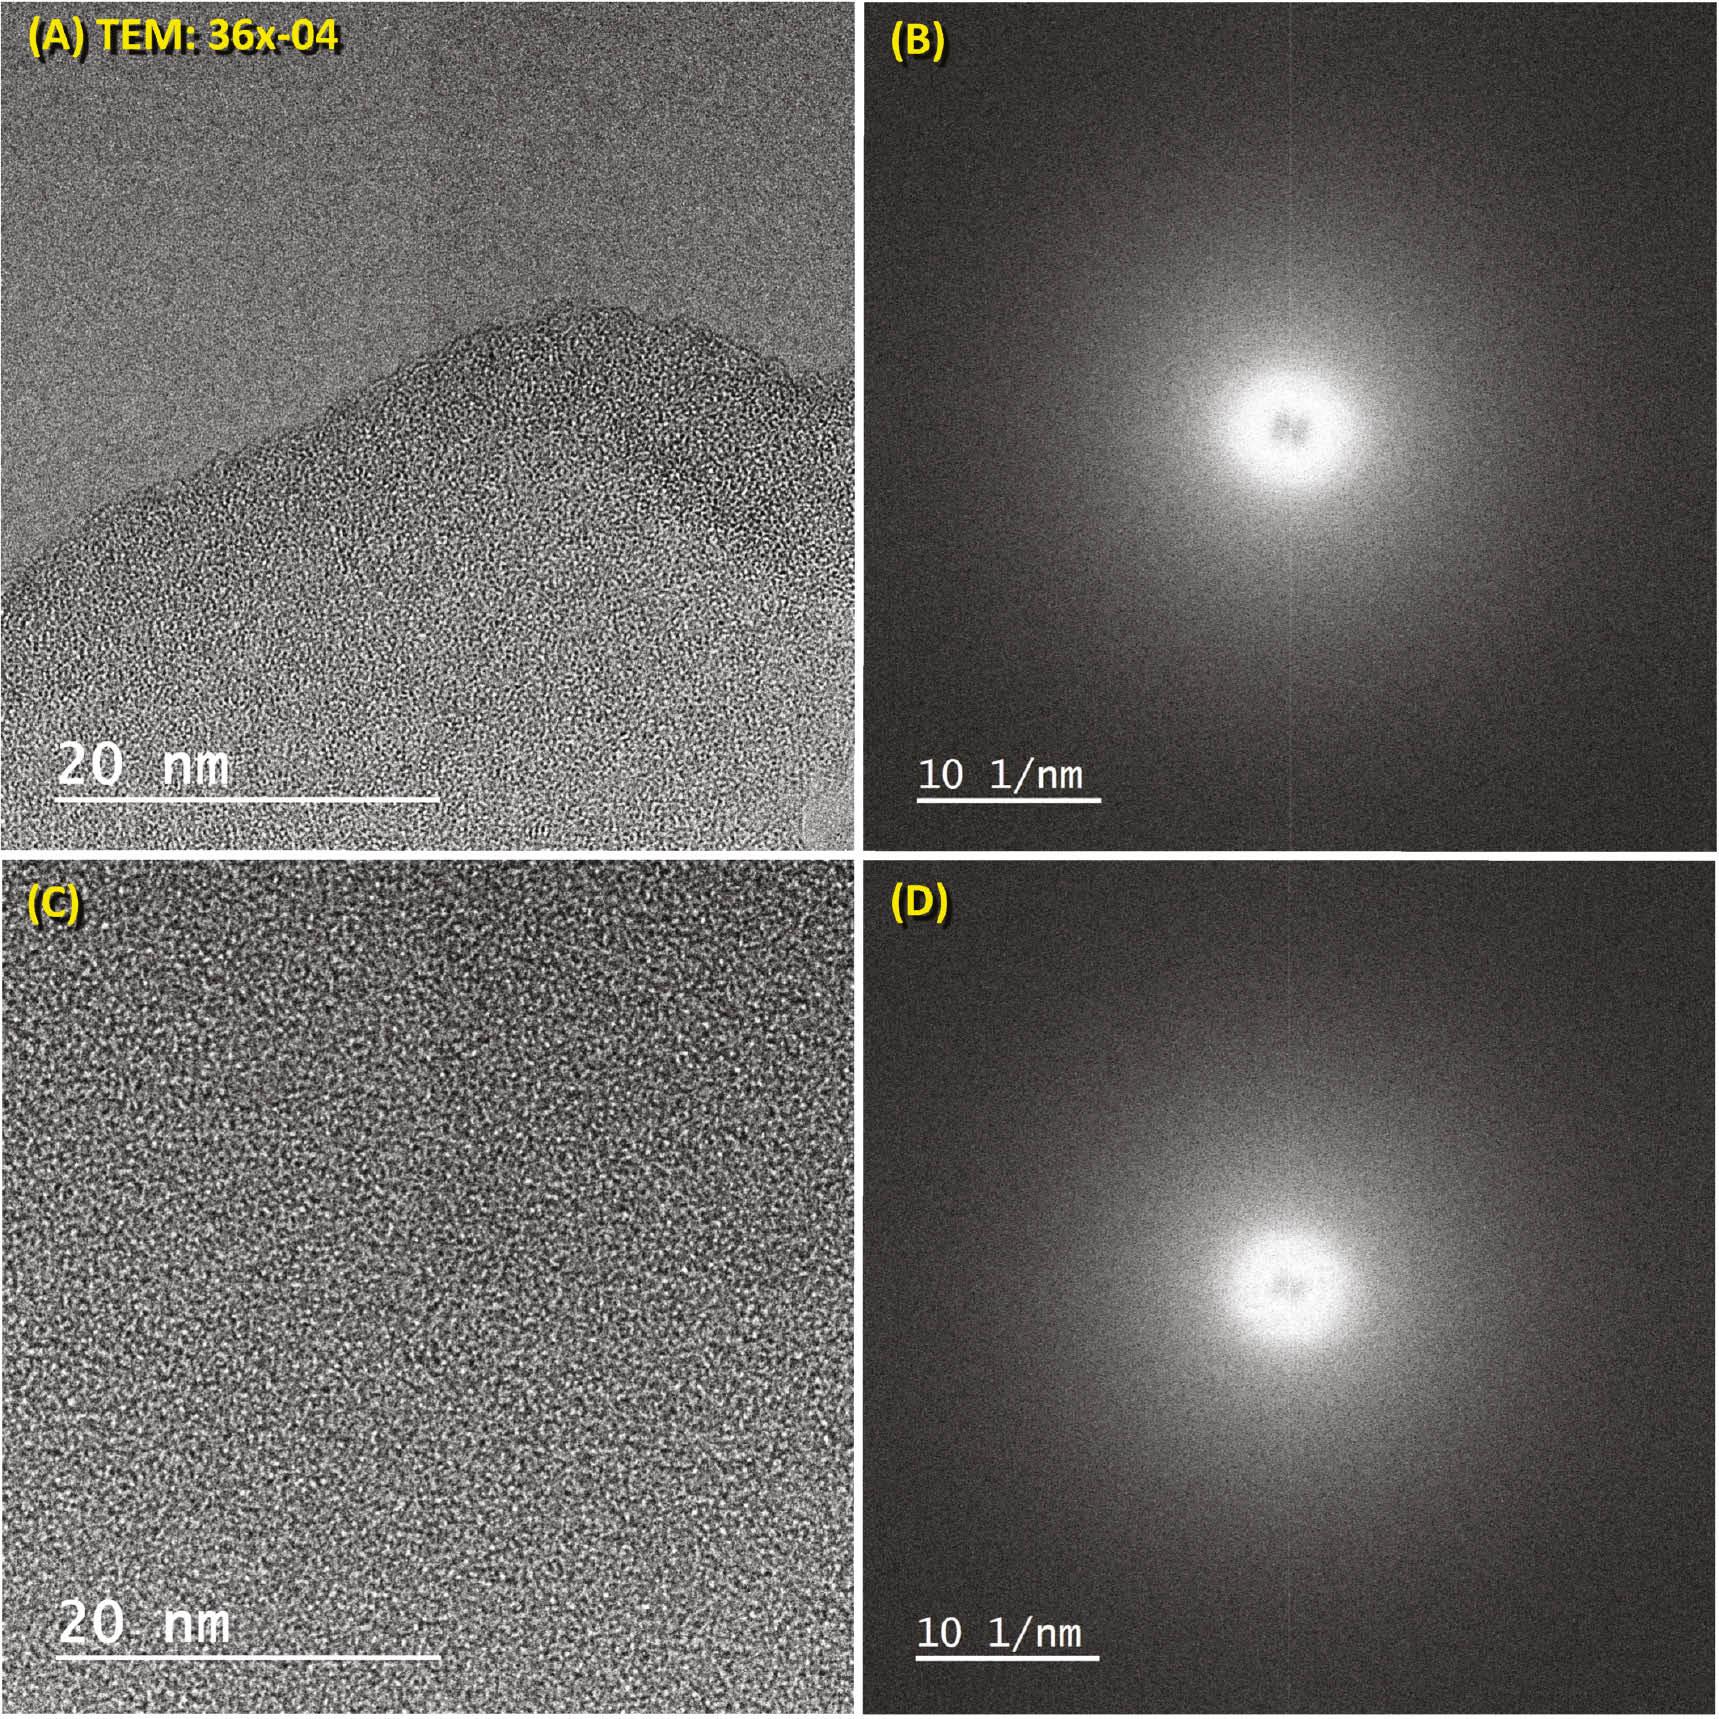
High-resolution TEM images of shock-fractured quartz grain 36x-04. (A) High-magnification image of the region of interest in quartz grain. The upper portion of the image is an open void. The lower part shows a short-range ordering of atoms without evidence of crystalline structure. (B) The FFT image of the left panel displays no diffraction spots indicative of crystalline structure. Instead, the bright center indicates the diffuse glow produced by amorphous silica. (C) High-magnification image of a region of interest in quartz grain. The image shows a short-range ordering of atoms without evidence of crystalline structure. (D) The FFT image of the left panel displays no diffraction spots indicative of crystalline structure. This grain is from YDB sample E301, 405 cm depth.
Selected area diffraction (SAD) [10]
This crystallographic technique is performed using TEM. When the TEM’s electron beam passes through a quartz grain, it sometimes produces a diffuse halo with a d-spacing of ~1.23 Å (Figure 7), characteristic of amorphous quartz.
High-resolution TEM [10]
This TEM process allows the high-magnification observation of the structure in a crystal’s lattice. Thus, the technique can detect the presence or absence of amorphous silica, as seen in Figures 8 and 9.
Fast-Fourier transform (FFT) [10]
This study’s FFT analyses commonly displayed crystalline structures up to hundreds of nanometers away from the shock fractures. However, FFT images revealed that most shock fractures contain a diffuse halo or ring indicative of amorphous material [29, 75, 78], especially in the thin bands of glass along the shock fractures. FFTs of the material filling these thin fractures display the diffuse halo-like patterns characteristic of amorphous material [29, 75, 78] with d-spacings of ~3.50 and ~3.70 Å (Figures 8 and 9). This amorphous silica is commonly heterogeneously mixed with crystalline quartz for several hundred nanometers on each side of the fractures.
Gleason et al. [79] conducted experiments on amorphous silica and noted that unshocked amorphous silica had a d-spacing of about 4.20 Å. In contrast, quartz exposed to shock pressures ranging from 4.7 to 33.6 GPa transformed into amorphous silica that permanently densified, causing the standard glass d-spacing to decrease within a range of 3.36 to 4.00 Å. Thus, our study’s mean d-spacing values of 3.60 Å are consistent with Gleason’s range, supporting the interpretation that amorphous silica from Abu Hureyra was shocked and possibly densified at high pressures ≥4.7 GPa.
Energy dispersive spectroscopy using SEM (SEM-EDS) and TEM (TEM-EDS) [10]
For these analyses, we selected multiple areas that displayed fractures filled with material (Figures 10–14). TEM-EDS and SEM-EDS analyses revealed that the material filling the fractures is predominantly composed of silicon and oxygen (range: 98–99 total wt%). The wt% values of oxygen (14 to 48 wt%) were typically below the stoichiometric values of quartz (53 wt%). Together with the diffuse rings exhibited in the FFT results (Figures 7–9), this finding confirms that the material filling the fractures is amorphous silica.
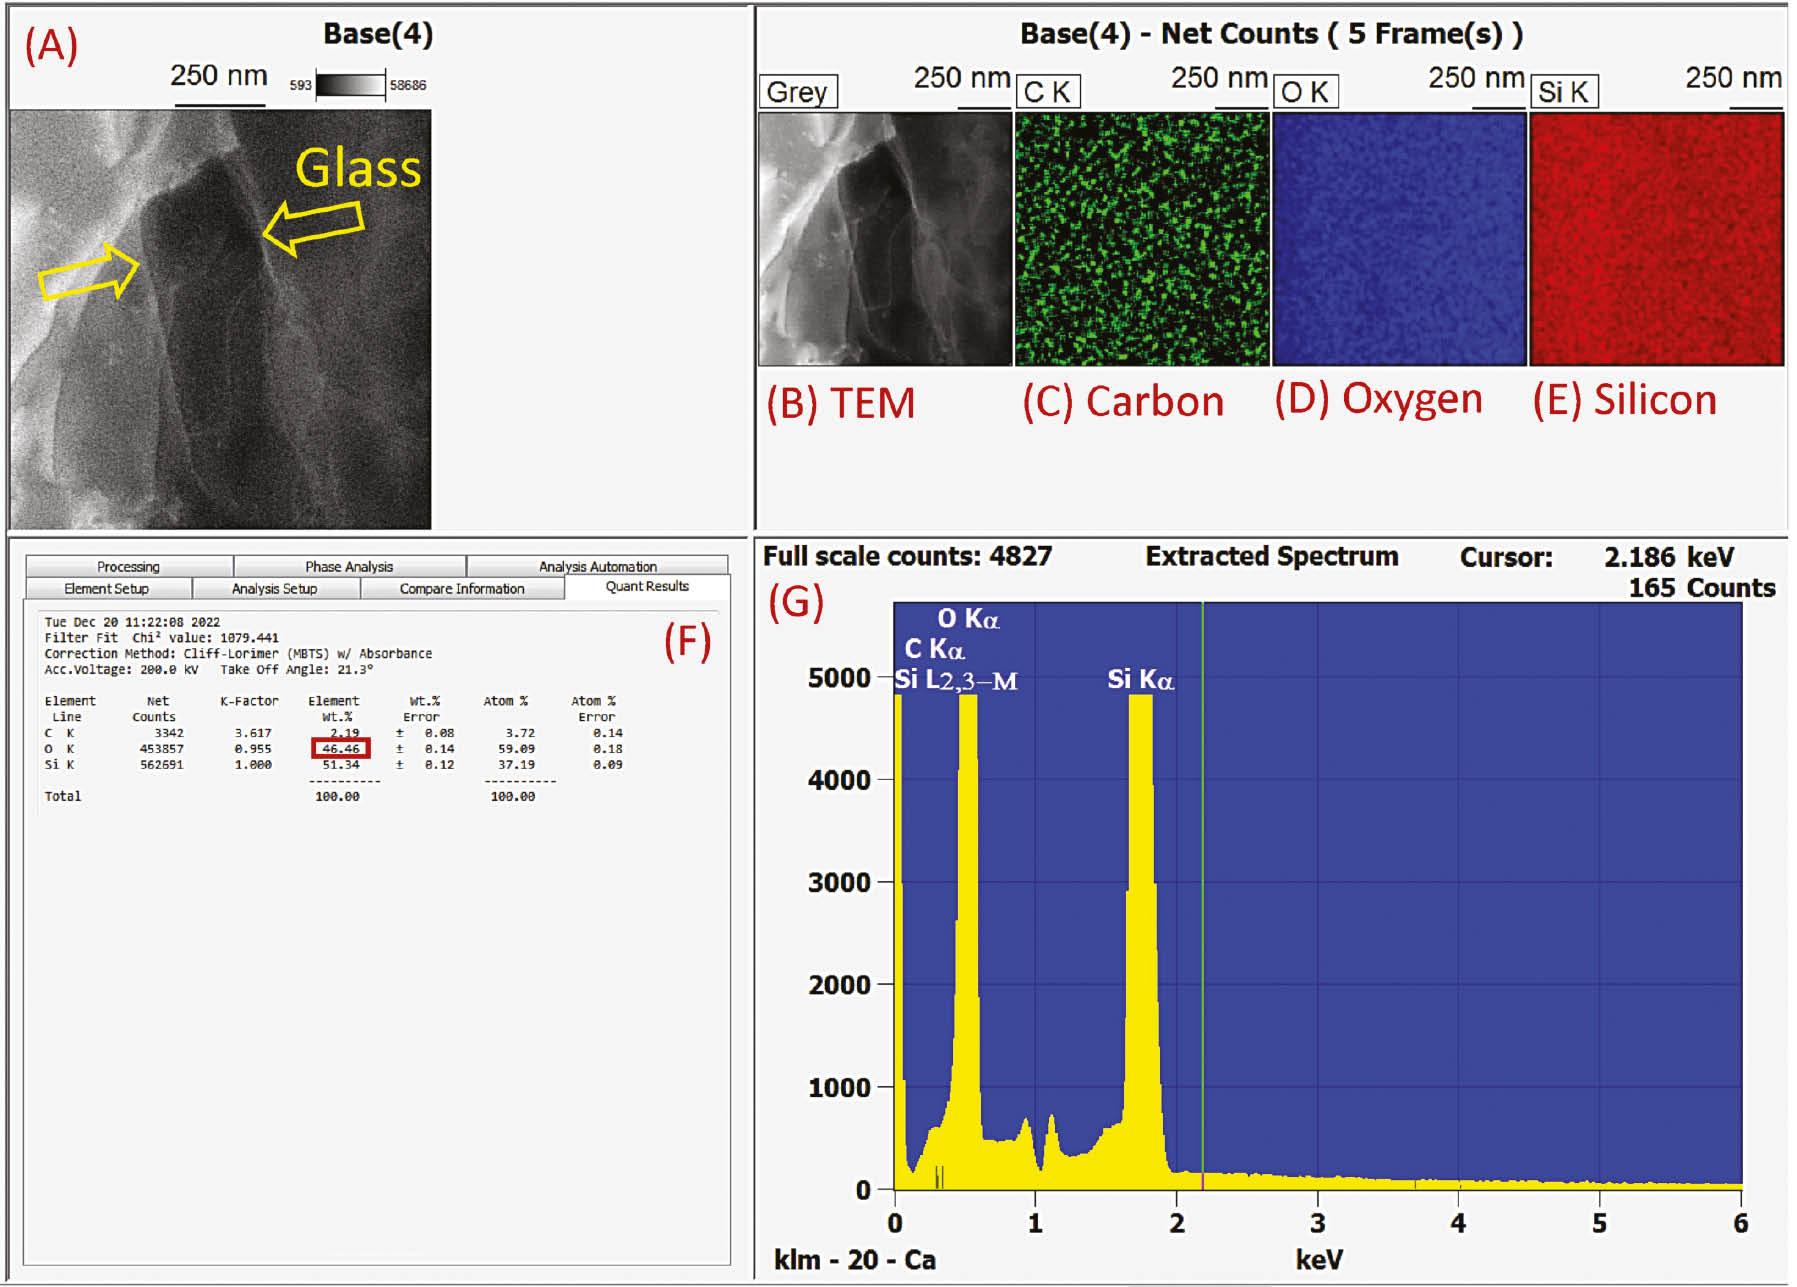
TEM-EDS of shock-fractured quartz grain 35x-09. 98 wt% SiO2 with a trace of carbon contamination on the surface. Oxygen is at 46 wt%, slightly below EDS uncertainty of ±10 wt%.
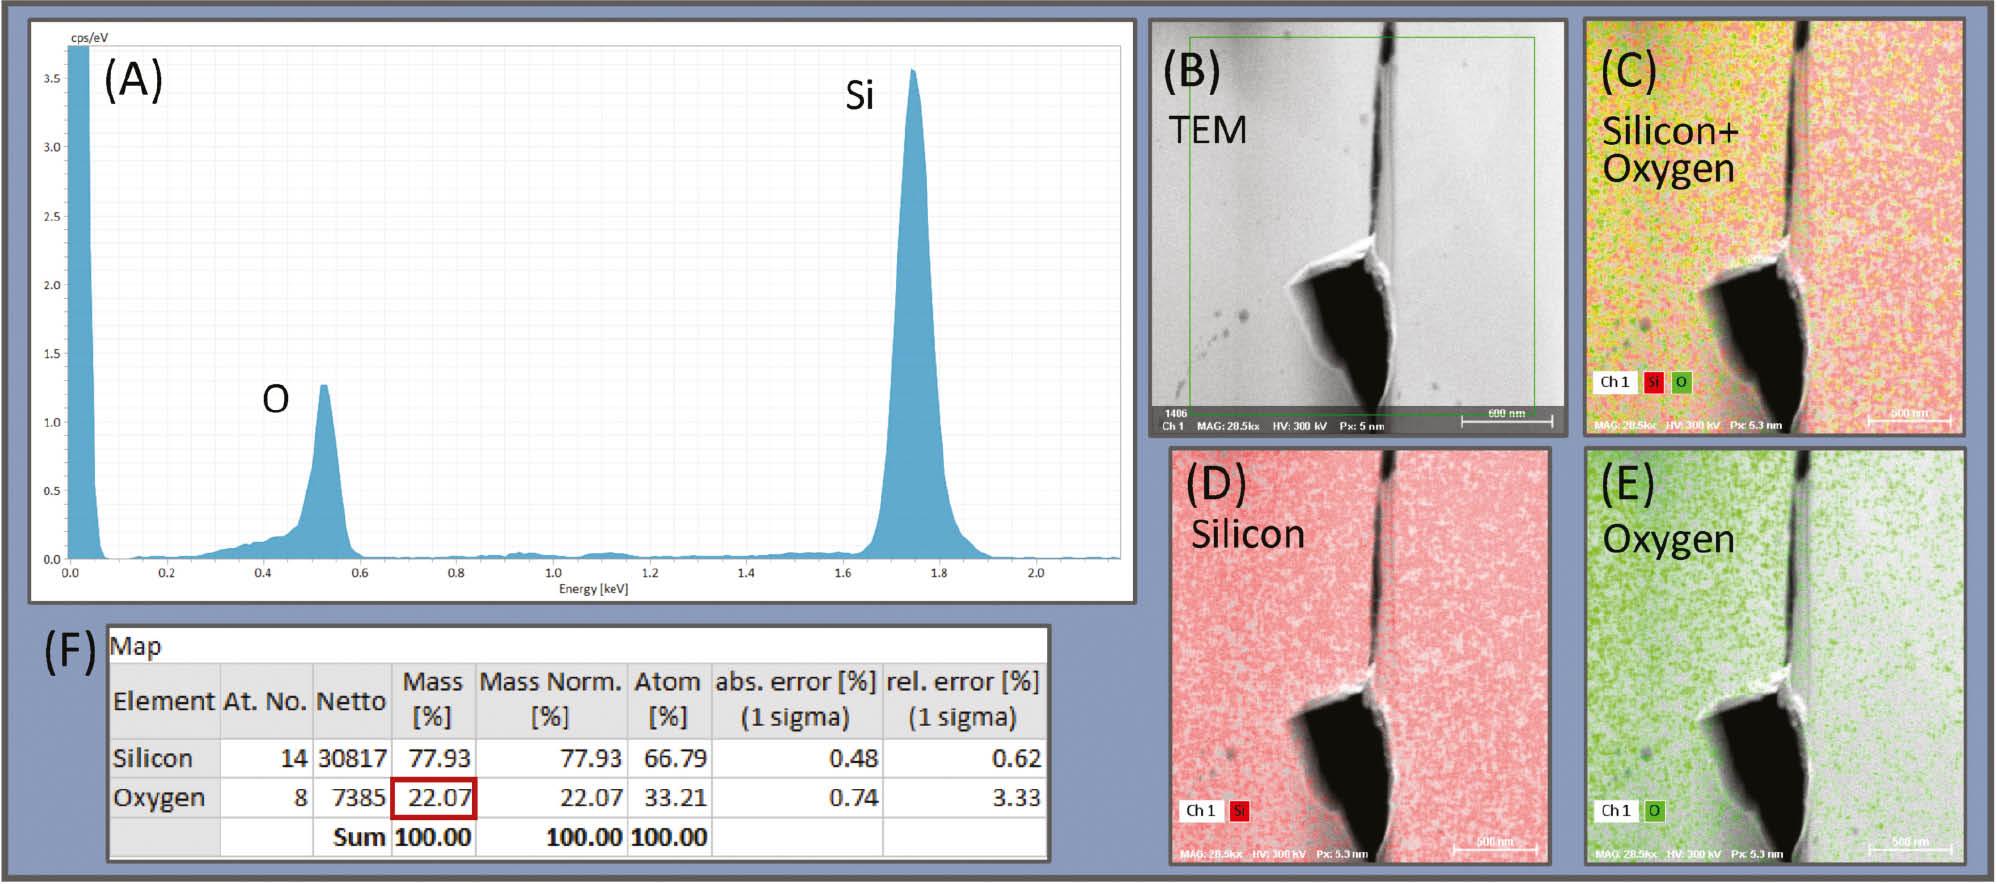
TEM-EDS of shock-fractured quartz grain 36x-04. 100 wt% SiO2. The area of the grain is highly depleted in oxygen at 22 wt%. Based on the stoichiometric ratio of quartz, this suggests a mixture of ~41 wt% SiO2 with ~ 59% native Si in the area analyzed.
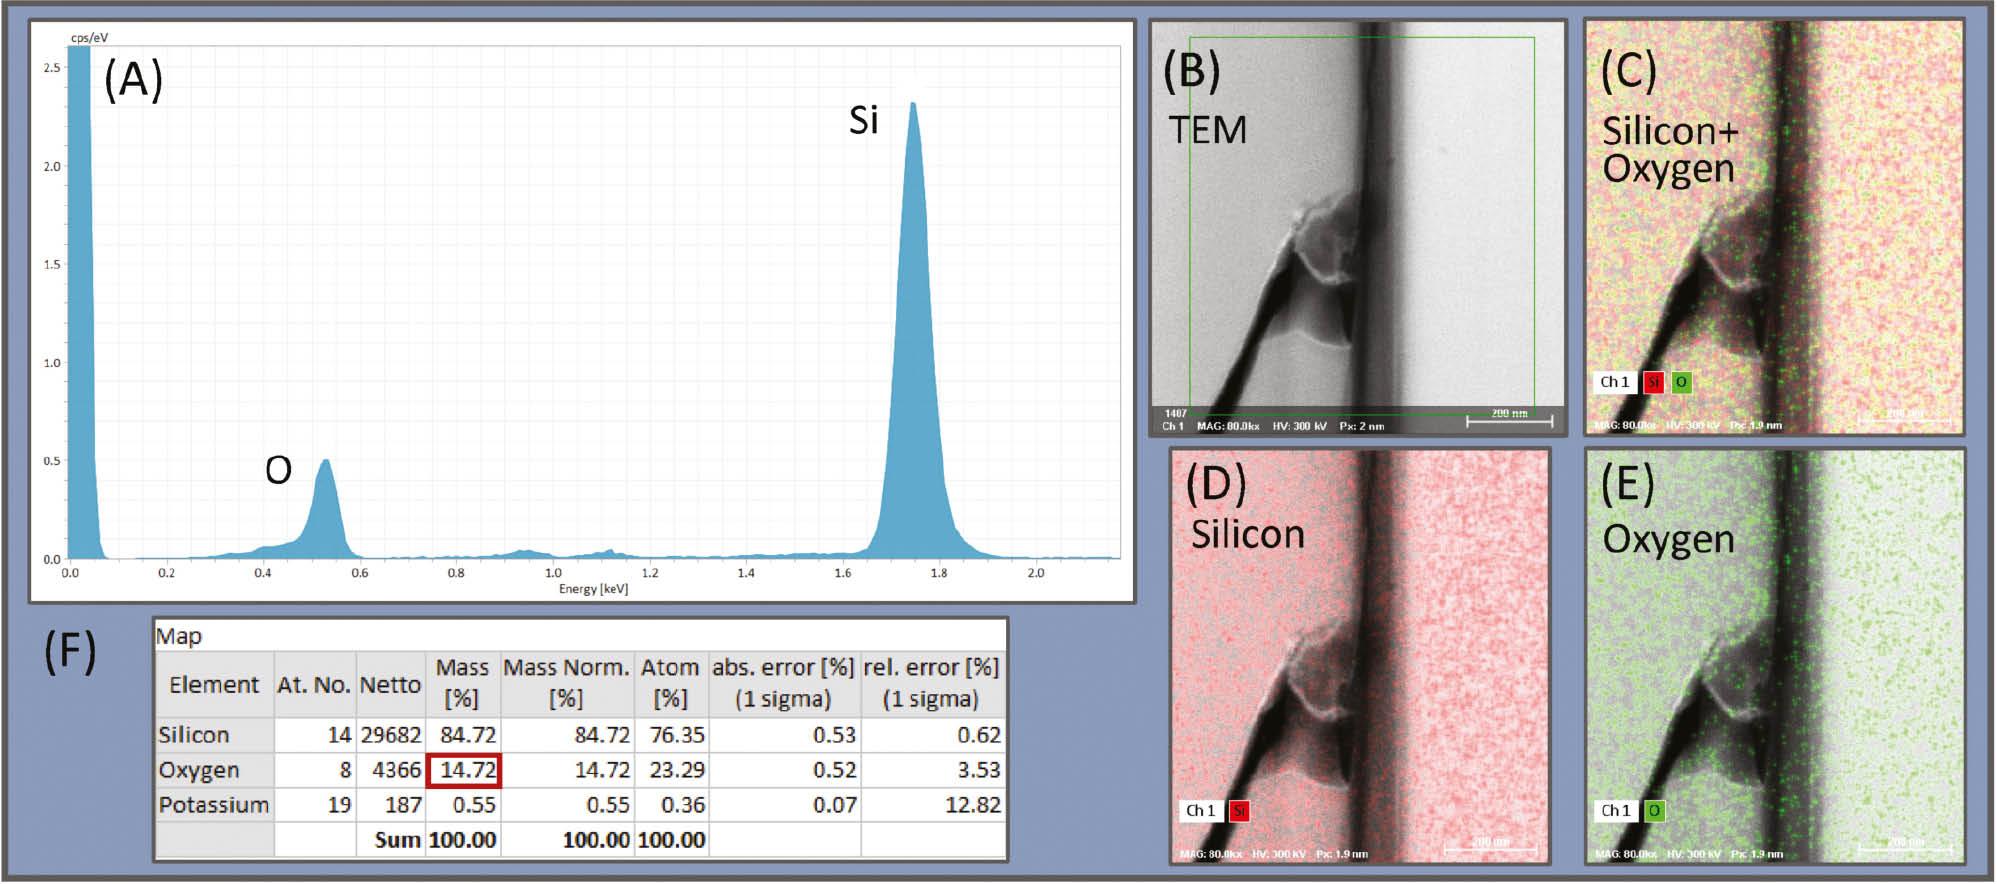
TEM-EDS of shock-fractured quartz grain 36x-04. 99.4 wt% SiO2. The area of the grain is highly depleted in oxygen at 14.7 wt%. Based on the stoichiometric ratio of quartz, this suggests a mixture of ~27.6 wt% SiO2 with ~71.8 wt% native Si in the area analyzed.


Micro-Raman
Acquiring multiple points with a micro-Raman laser is an excellent method to identify potential crystallinity variations along selected quartz grain fractures. However, even after much polishing of the quartz grains, their extensive fracturing made it challenging to acquire Raman spectra. Nevertheless, the observation of low intensity (<3000 arbitrary units (a.u.)) of the Raman band at 466 cm−1 within the fractures, plus the appearance of an extra Raman band at 1330 cm−1, suggests the presence of amorphous silica in the fractures with crystalline quartz on either side (Figure 15).
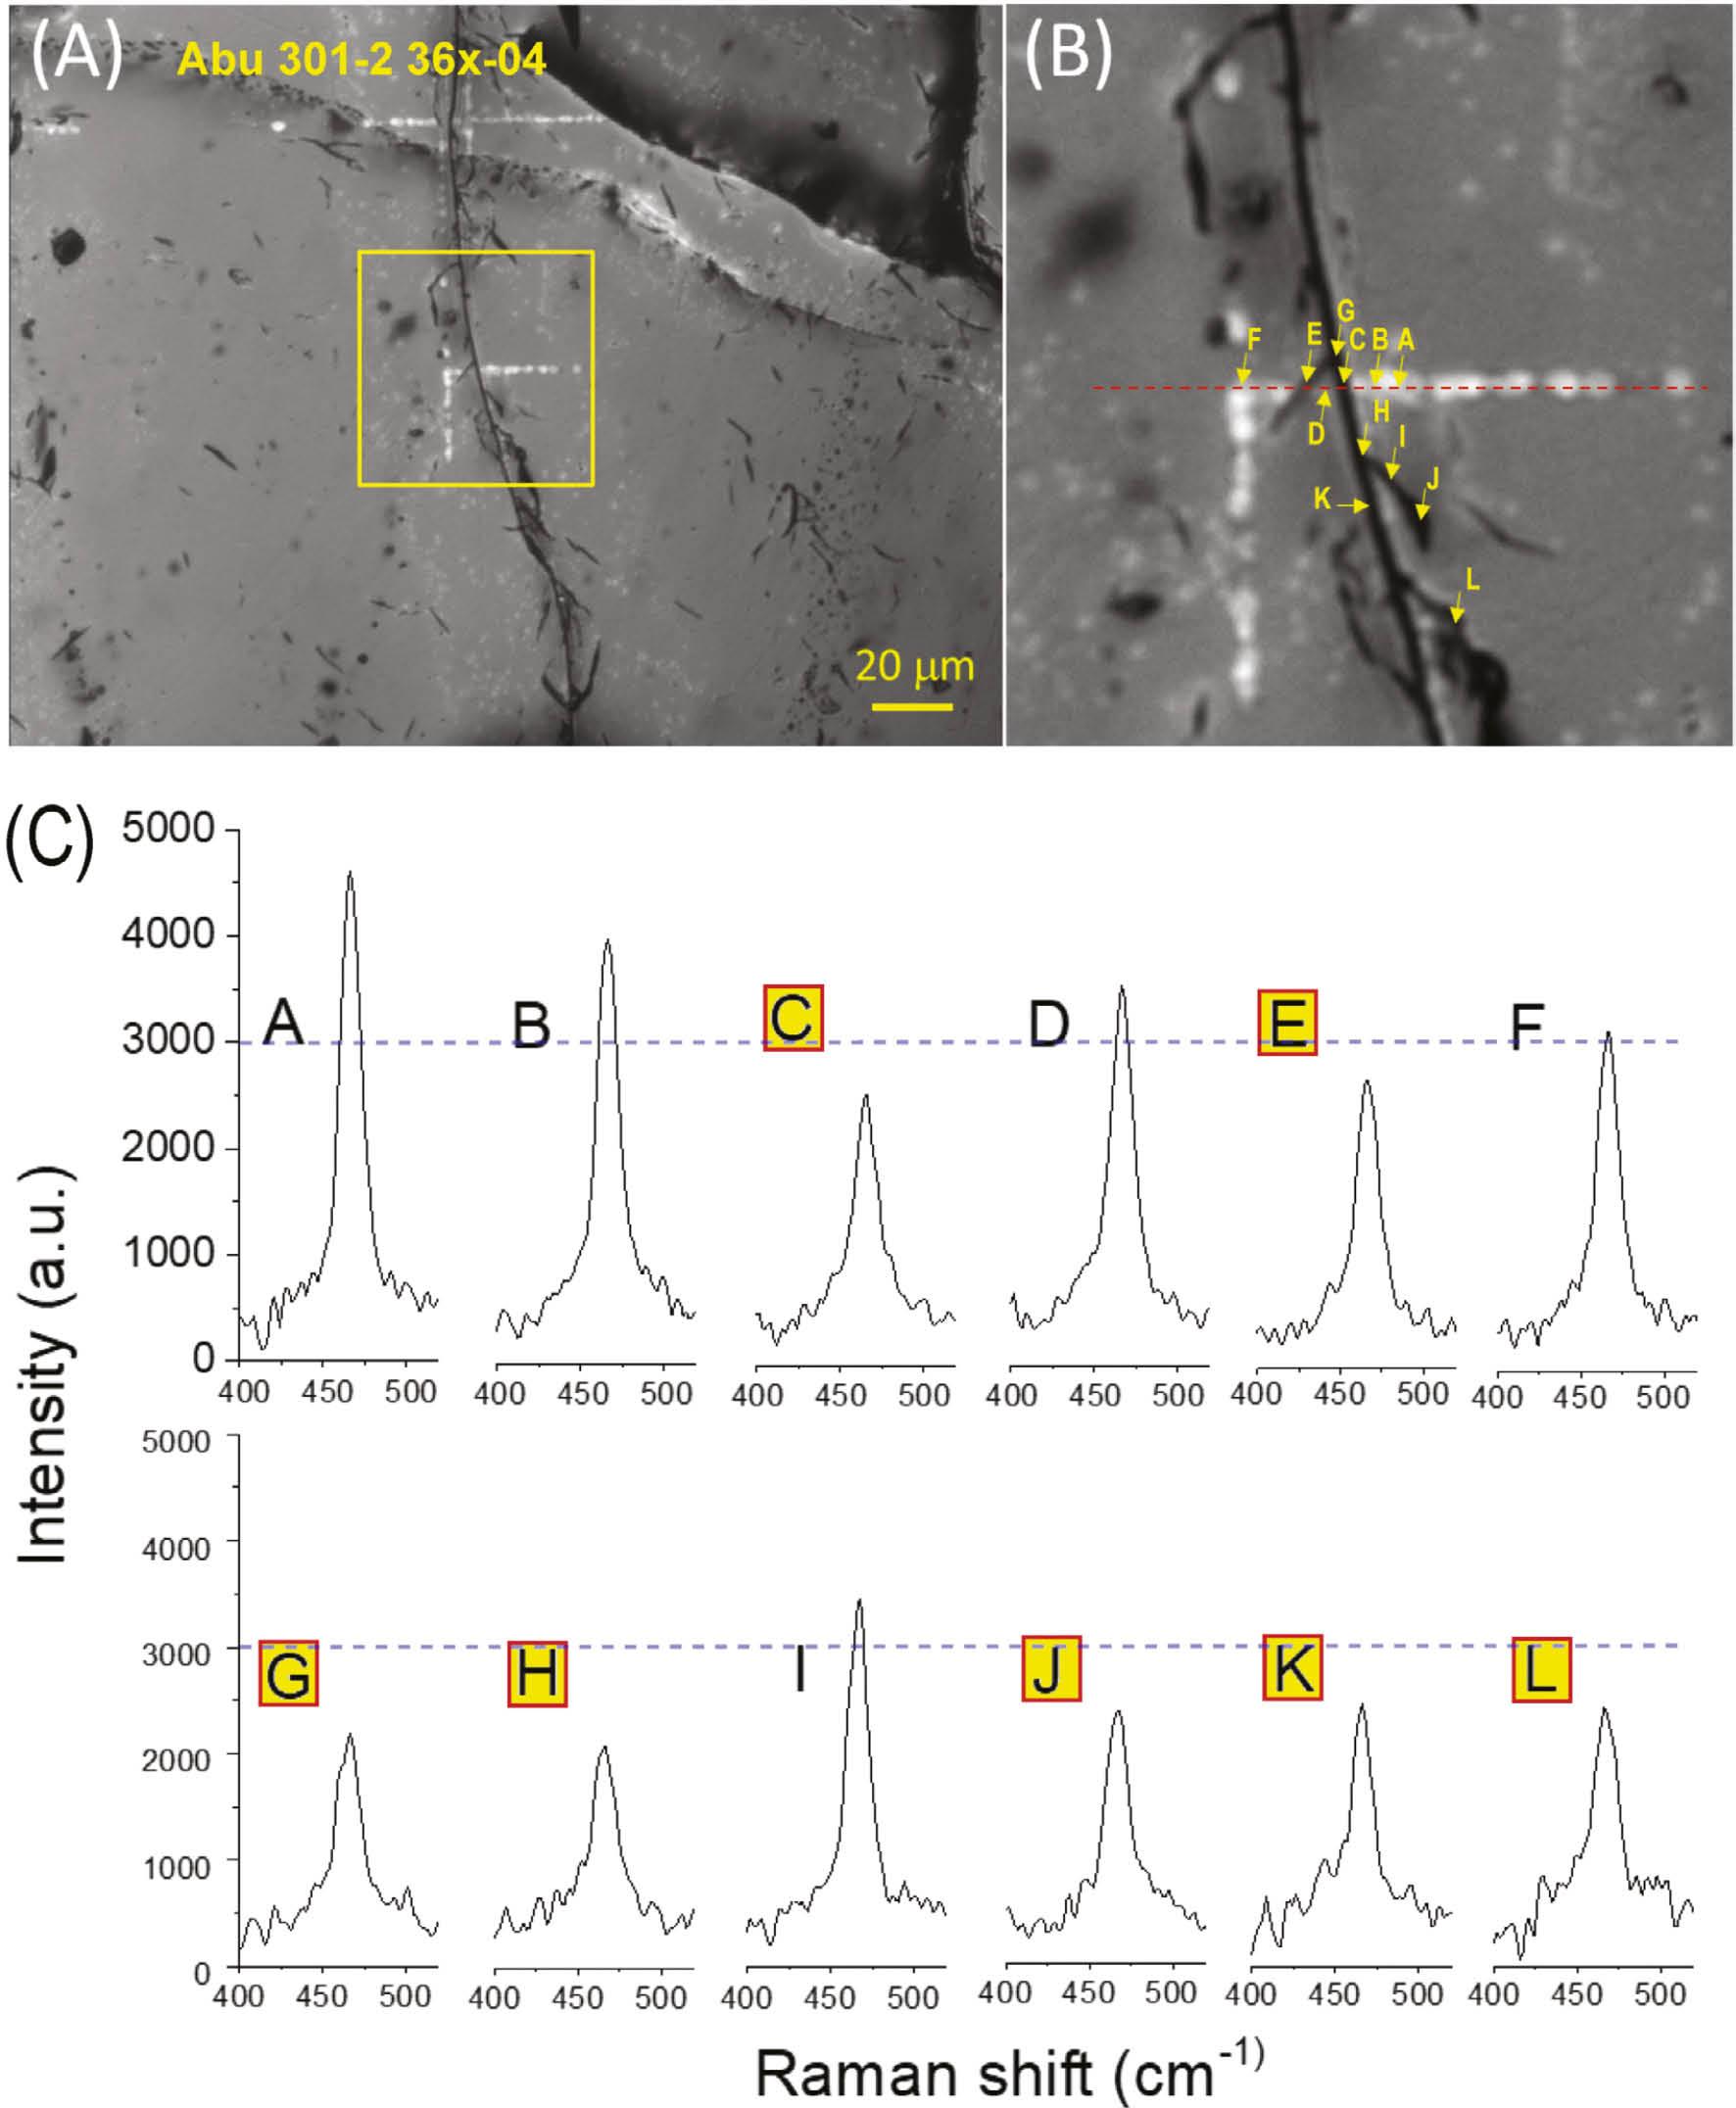
Micro-Raman for shock-fractured quartz Abu Hureyra grain 36x-04. (A) Bright-field SEM image. The yellow square marks the area investigated. (B) Close-up of the yellow square in panel A. (C) Micro-Raman spectra of grain at positions A through L. Crystal quartz Raman band at 466 cm−1 was observed at all positions. The intensities marked with yellow letters are all less than 3000 a.u., interpreted as indicating the presence of amorphous silica.
Electron backscatter diffraction (EBSD) [10]
Analyses performed using EBSD rely on varying comparisons of Kikuchi patterns. These are produced by the passage of the electron beam through the crystal, revealing the microstructural properties in a given grain. We used several EBSD routines, including a technique called “PRIAS,” an acronym for “Pattern Region of Interest Analysis System.” With this technique, each pixel in an EBSD pattern can collect light at small angles relative to the incident beam, thus allowing one to infer differing angles of the crystalline structure. The images produced by EBSD reveal an extensive network of oriented shock fractures for some quartz grains in sample E301 from Abu Hureyra (Figures 16 and 17).
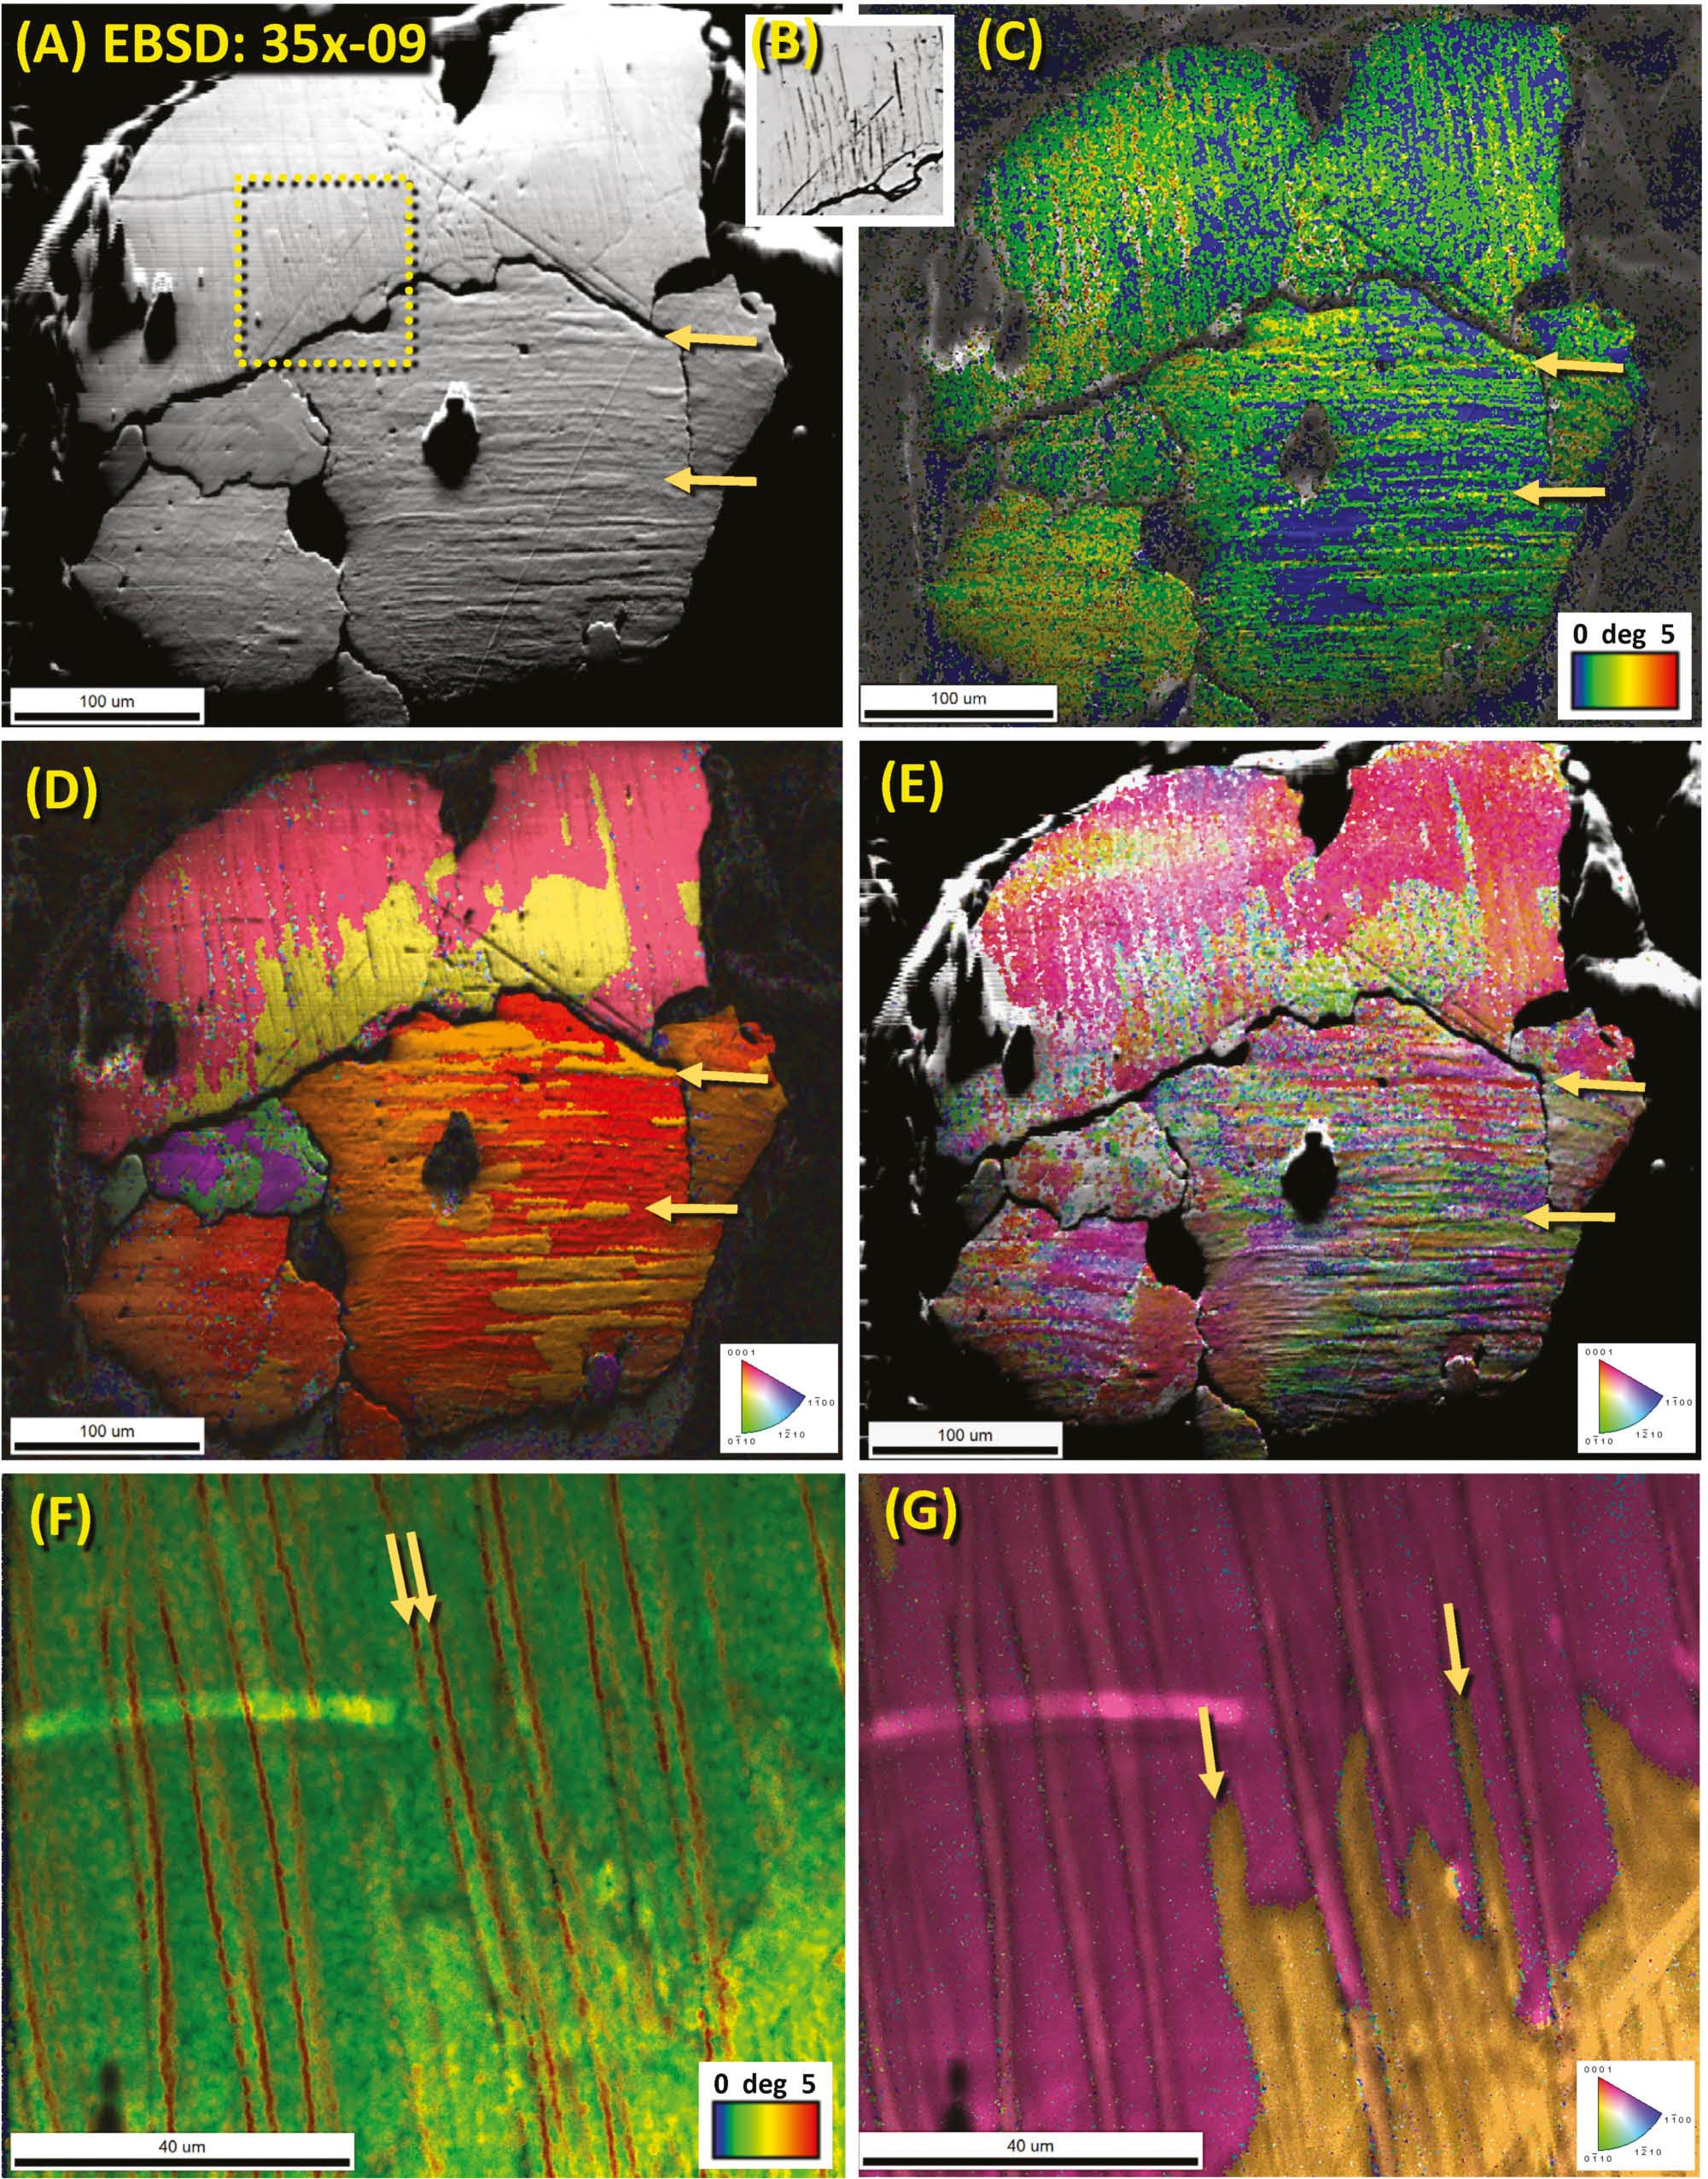
Images of Abu Hureyra shock-fractured quartz grain 35x-09 using Electron Backscatter Diffraction (EBSD). (A) EBSD image reveals fractures at arrows. The largest fractures represent sub-grain boundaries. (B) Epi-illumination microscopy (EPI) image of the yellow box in panel A exhibits fractures. (C) EBSD Figure of “image quality” (IQ) is overlain by “local orientation spread” (LOS), illustrating the degree of damage to grain. The scale at the lower right of panel C represents degrees of misorientation from 0° (blue) to 5° (red). The greatest misorientation (i.e., damage) is concentrated along shock fractures. (D) “Inverse pole Figure” (IPF) values superimposed on IQ values, showing misorientation. The inset displays color-coded Miller-Bravais crystallographic indices. Within each sub-grain, the two primary colors represent Dauphiné twinning. (E) Image acquired using the PRIAS technique overlain by “grain reference orientation deviation” (GROD), showing many misorientations. Index key at lower right. (F) Close-up image of LOS superimposed on IQ. Fractures typically display twin sub-parallel tracks. (G) Close-up image of IPF over IQ.
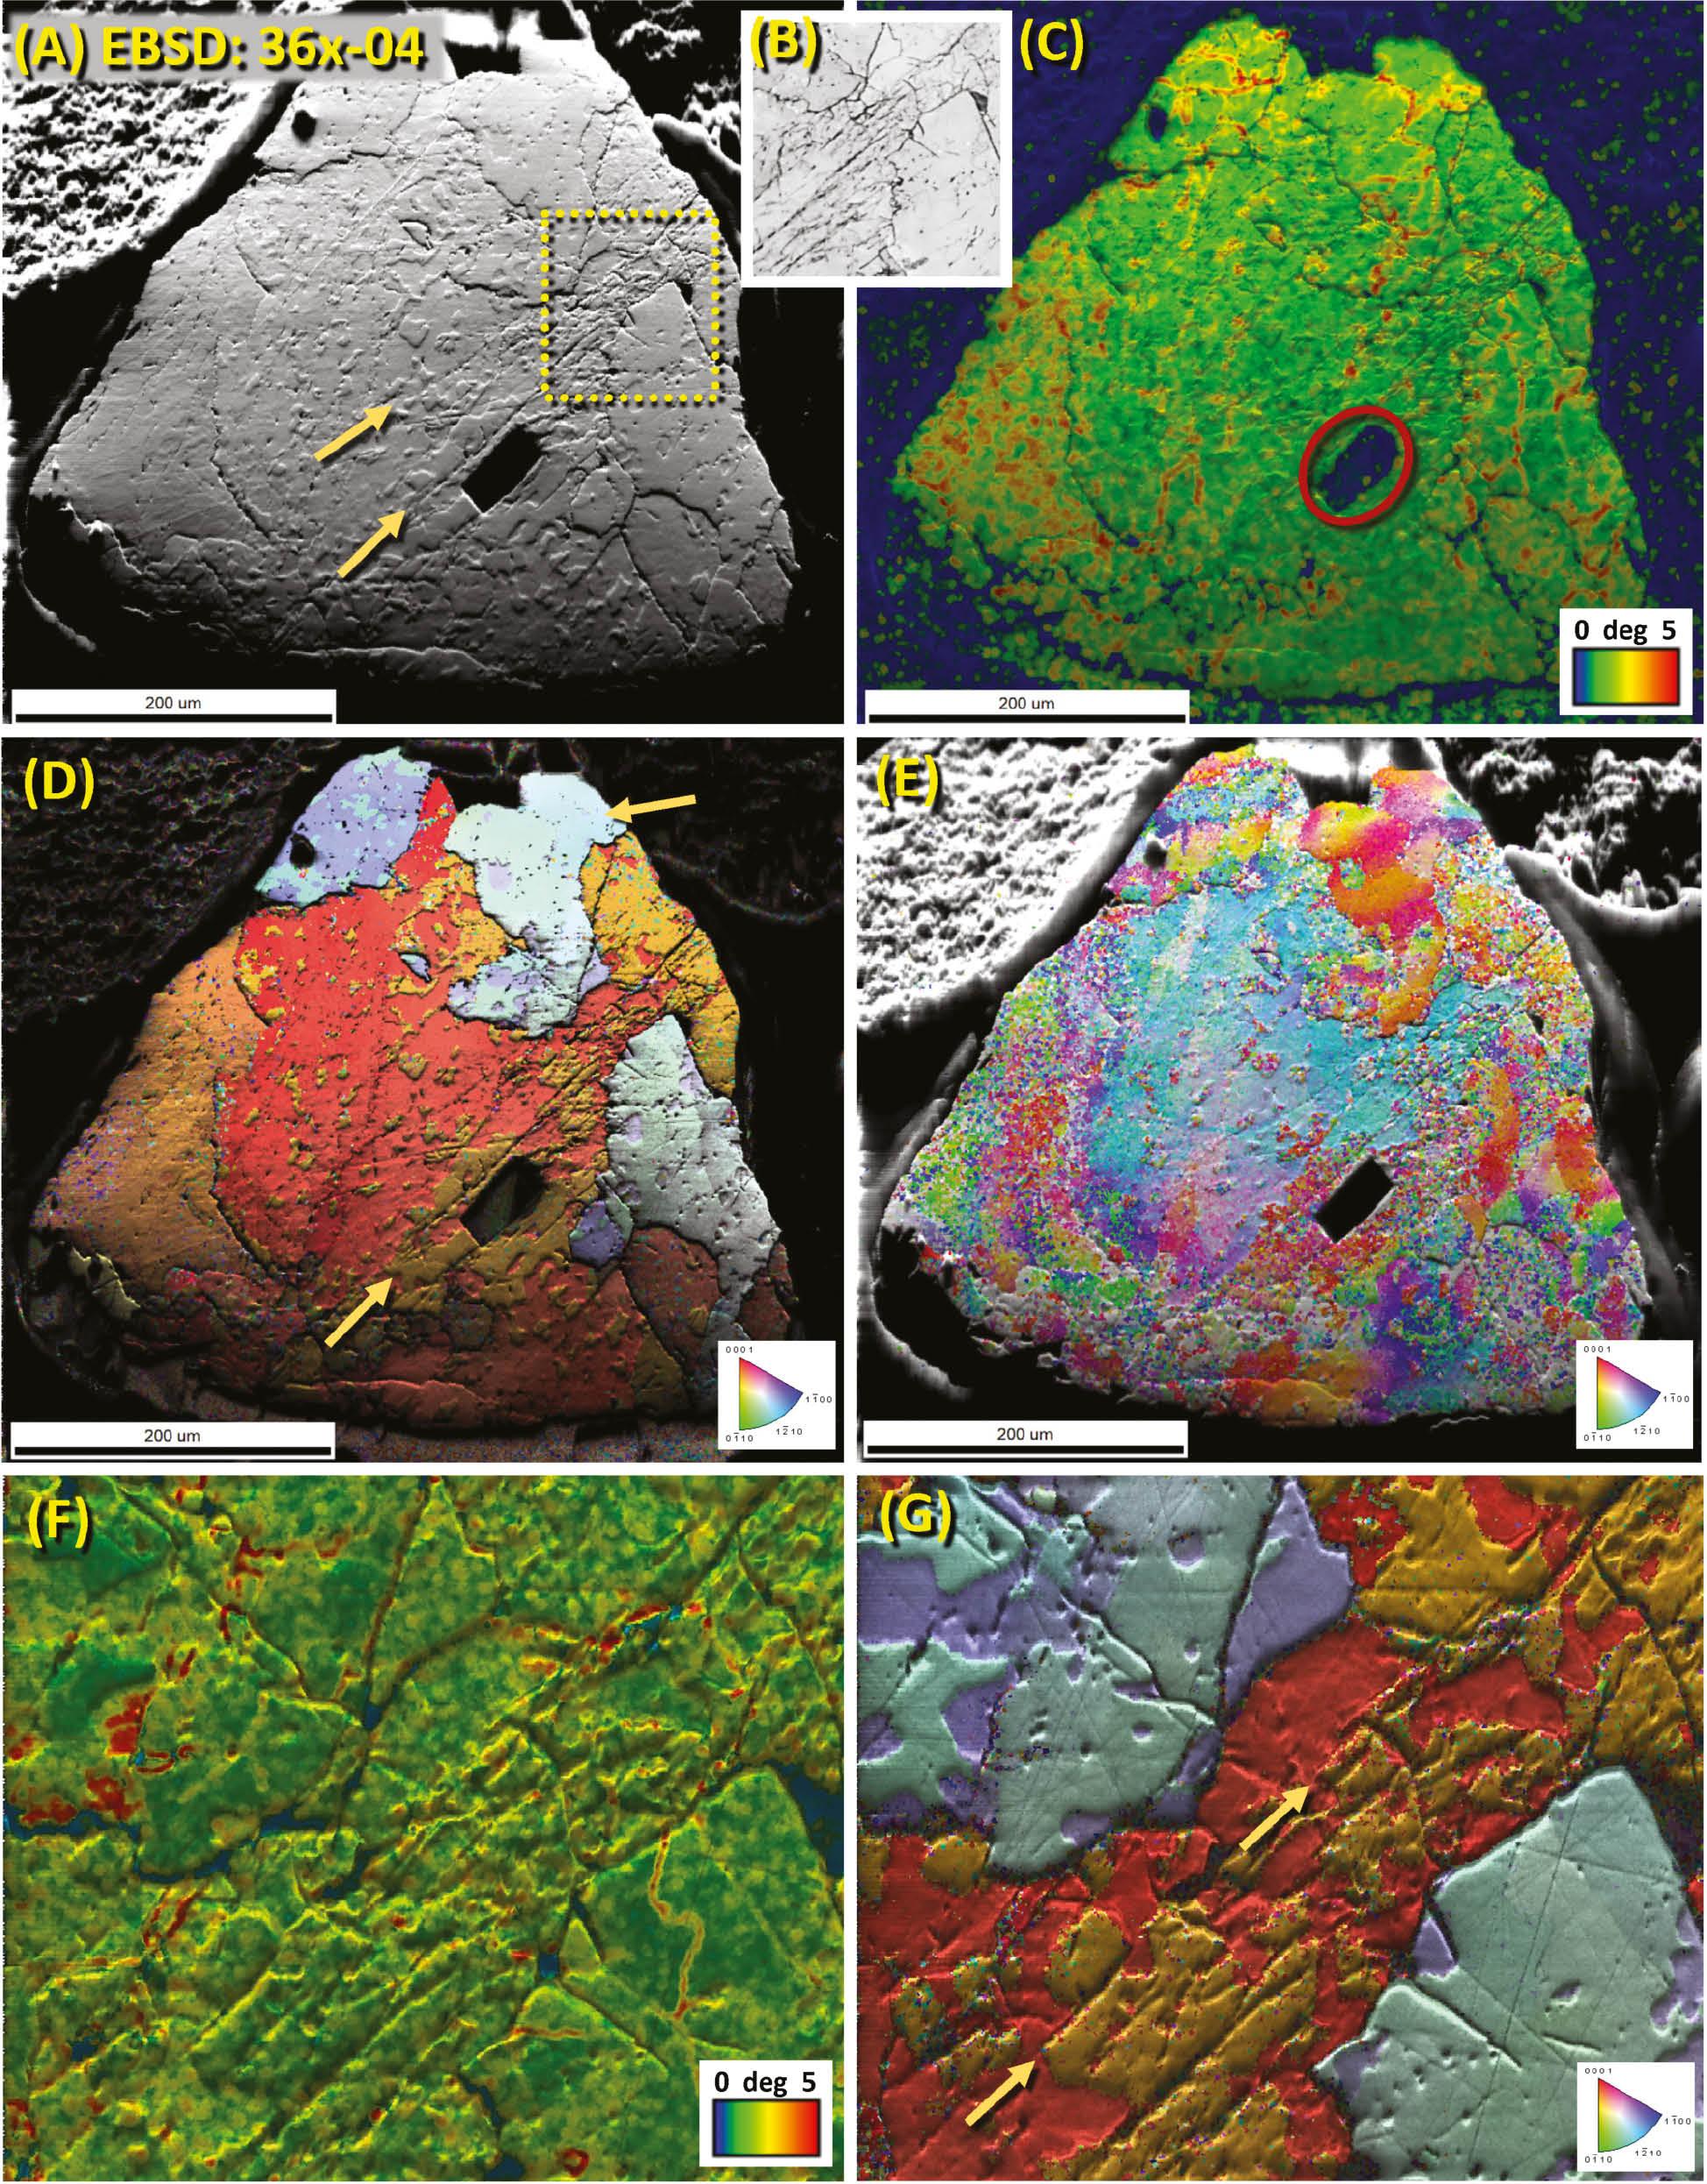
Abu Hureyra shock-fractured quartz grain 36x-04. (A) The PRIAS technique image reveals fractures. (B) EPI image of the yellow box in panel A exhibits fractures. (C) LOS over IQ (image quality) shows the degree of misorientation. Color key at the bottom right. The red circle marks the FIB foil extraction site. (D) IQ over IPF shows misorientation. Inset indicates color-coded Miller-Bravais indices. The two primary colors represent Dauphiné twinning. (E) GROD under PRIAS shows a wide range of misorientations, consistent with melting followed by partial recrystallization. (F) Close-up of LOS over IQ. (G) Close-up of IPF over IQ. See the caption for Figure 16 for abbreviations.
EBSD “image quality” superimposed by “local orientation spread”
The high pressures during shock metamorphism damage and distort the crystalline lattice of quartz grains. To identify and quantify any potential grain damage, we used an EBSD routine called “local orientation spread” that generates Kikuchi patterns of the quartz lattice. The EDAX EBSD software compares these short-range patterns to reveal possible rotations or misorientations of the crystalline lattice, after which the average misorientation of any given point is calculated relative to neighboring points. In sample E301 from Abu Hureyra, we observed values ranging from 0° to ~5° of misorientation and observed that this misoriented lattice tends to be concentrated along the shock fractures (all panels in Figures 16 and 17). We found that such misorientations are common in quartz with shock fractures but are typically not in unshocked natural quartz grains.
EBSD “grain reference orientation deviation” values superimposed on EBSD “image quality” values
Orientation deviation maps (Figures 16 and 17) assist with visualizing the distribution of local lattice angular misorientations by color-coding the variations. EDAX’s EBSD software analyzes and colorizes individual points to illustrate any rotation of the crystalline lattice around an arbitrary common point on the grain. The software uses multiple colors to represent areas with different short-range misorientations relative to a common point. In contrast, unshocked grains and tectonically-deformed grains display few misorientations.
EBSD “inverse pole Figure” values superimposed on EBSD “image quality” values
These Figures (Figures 16 and 17) reveal variations in the lattice axes of quartz relative to a frame of reference, which, in these examples, is the (0001) basal plane. In each case, measurements show that some quartz grains are composed of merged crystals known as Dauphiné twins that are rotated 60° relative to each other around a common c-axis. Dauphiné twinning is undetectable by standard optical microscopy and SEM backscatter electron imagery (SEM-BSE) but can easily be seen using EBSD. These twins are commonly found randomly distributed in many quartz grains, but in shock-fractured quartz, they are frequently closely aligned with the fractures, suggesting that the grain first fractured and melted, after which it recrystallized as a Dauphiné twin oriented approximately parallel to the fracture pattern.
Our analyses indicate that although Dauphiné twins are nearly ubiquitous in all quartz grains, they are typically distributed randomly in unshocked or tectonically deformed grains. In contrast, for the shock-fractured quartz identified in our study, Dauphiné twins typically align with the trend of the shock fractures, suggesting that they crystallized when the fractures formed under high stress or cooled from high temperatures. It has long been recognized that Dauphiné twins form when quartz is subjected to mechanical stress [80]. Subsequently, Wenk et al. [81] further concluded that Dauphiné twinning forms under high thermal and mechanical stress and later [82] reported that Dauphiné twinning provides evidence for an impact-related origin of shocked quartzite collected from the Vredefort crater in South Africa.
Discussion
Our multiple analyses have revealed the potential presence of fractured quartz grains limited to the YDB cosmic impact layer in the Abu Hureyra section. It is important to note that this dark layer had previously been identified by Moore et al. [1, 35–38] based on abundance peaks in nanodiamonds, magnetic micro-spherules, high-temperature meltglass, carbon micro-spherules, platinum, nickel, cobalt, chromium, and other potential impact-related proxies [35, 37, 58] as summarized in Figure 18. This assemblage of inferred impact-related proxies and the size characteristics of specific proxies, such as meltglass, implies the presence of a nearby cosmic impact [1, 2, 37]. Although no known crater is near Abu Hureyra, the impact hypothesis does not require one. Most of the same inferred proxy evidence observed at Abu Hureyra has been found at accepted impact events with no known confirmed craters, including the Dakhleh Oasis in Egypt [83], the Australasian tektite field in SE Asia [35], and the Atacama Desert [84].
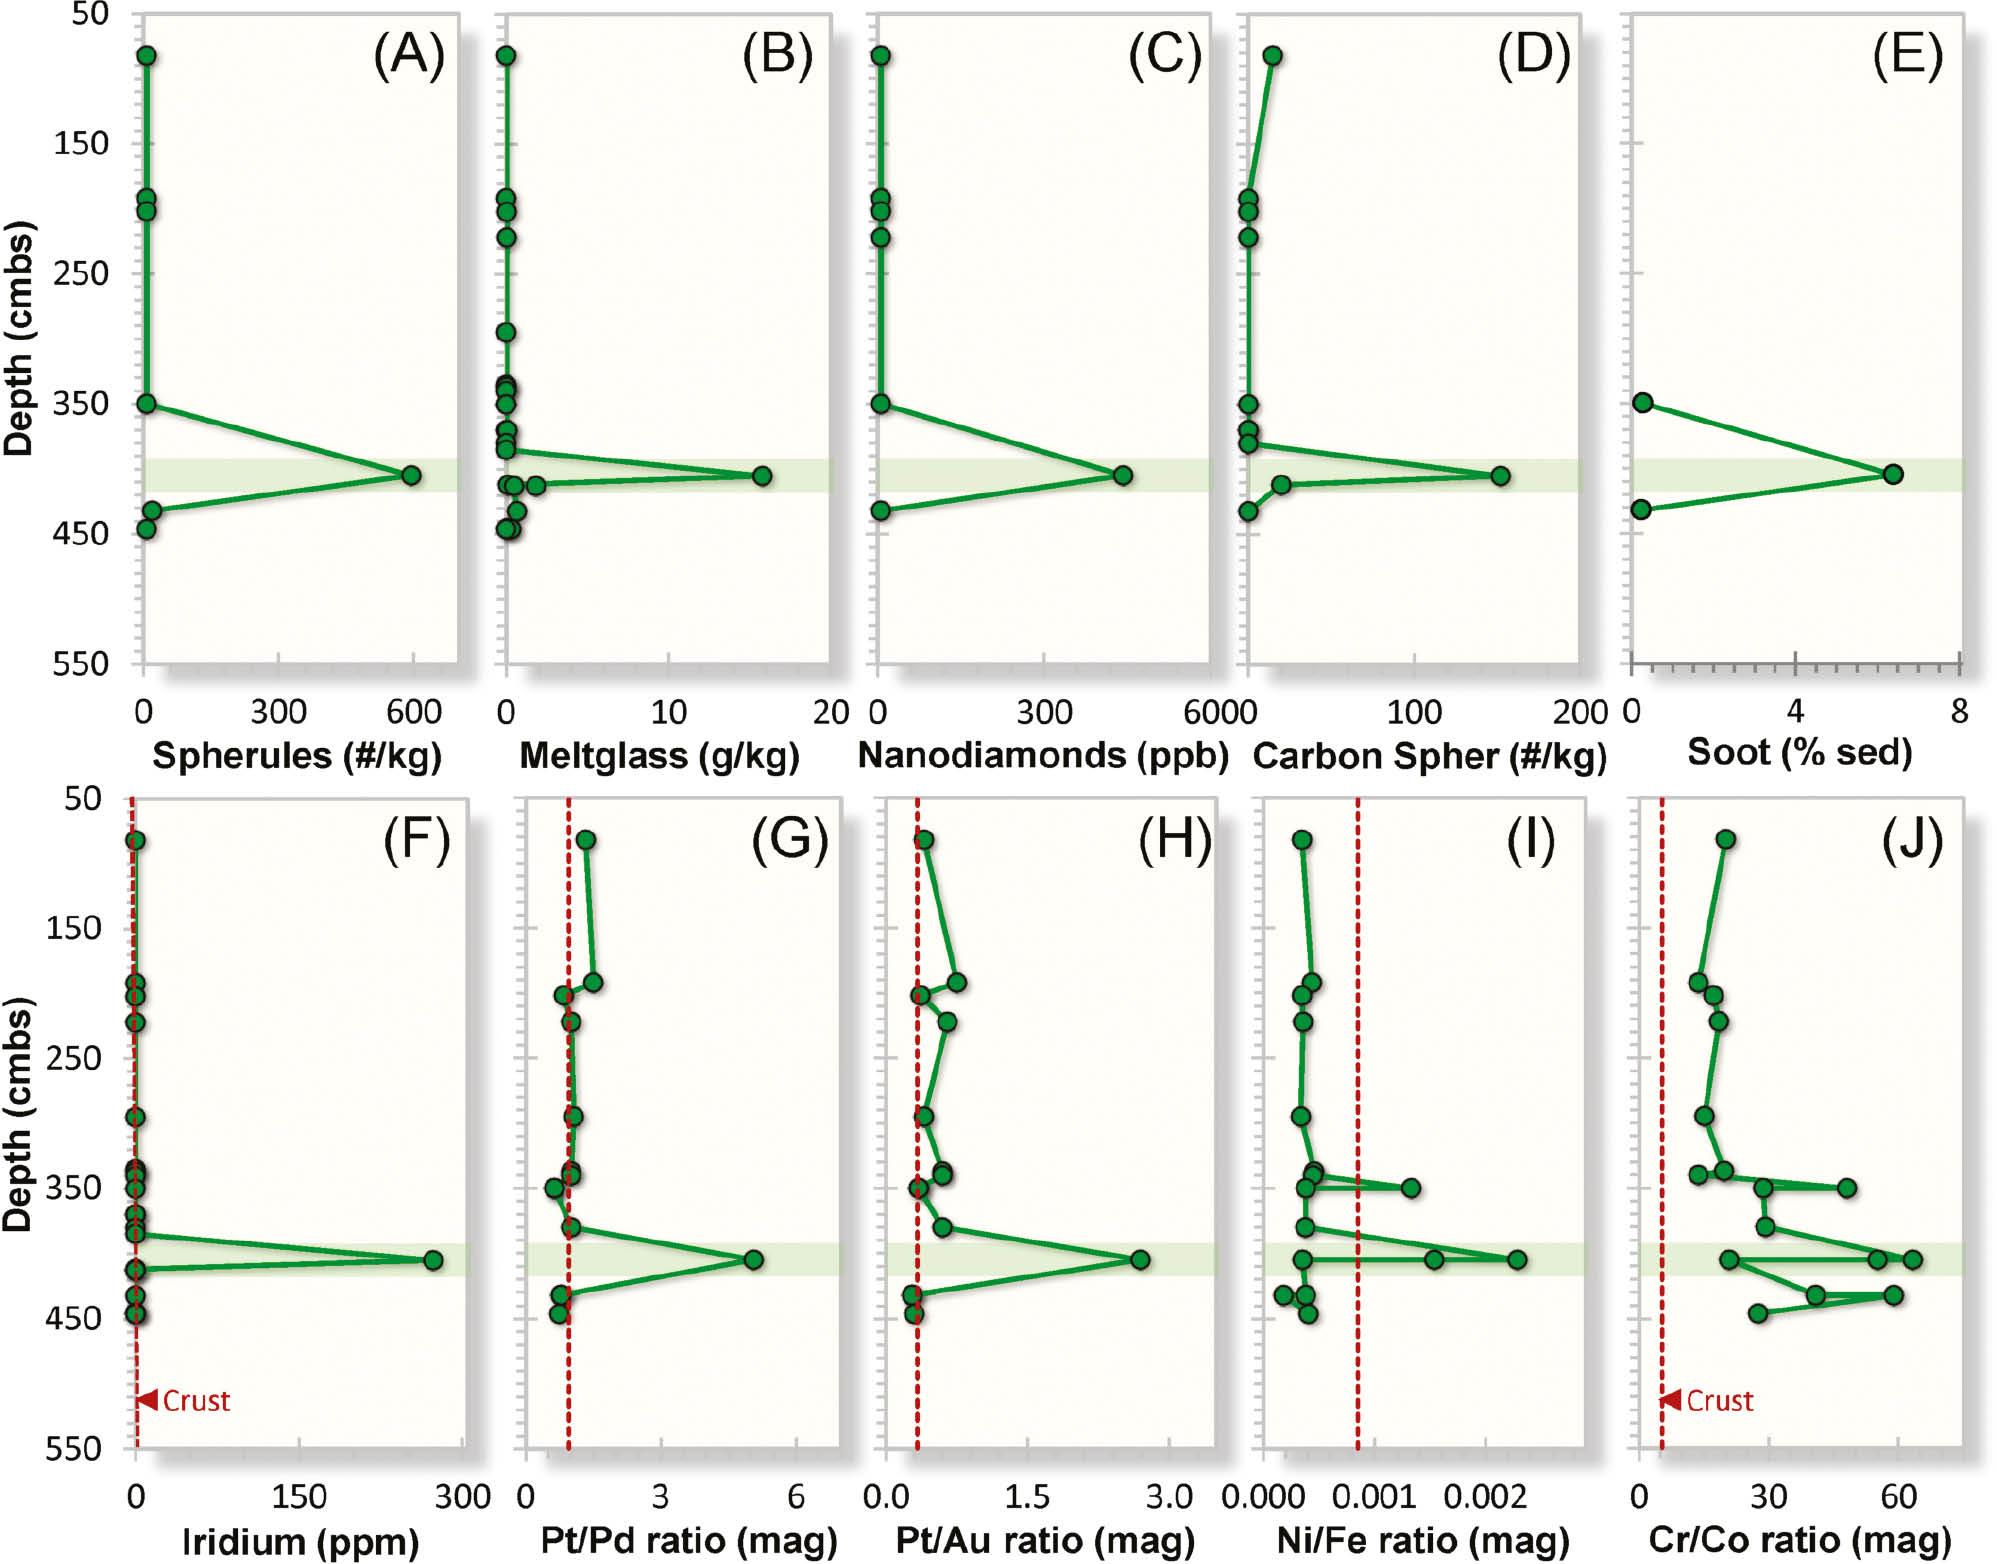
Compilation of peak concentrations of various impact-related proxies in the YDB layer at Abu Hureyra. (A) Ca-Si-rich and Fe-rich micro-spherules; (B) high-temperature meltglass; (C) nanodiamonds; (D) carbon micro-spherules produced by biomass burning; (E) black carbon or soot in sediment produced by biomass burning; (F) iridium; (G) platinum/palladium (Pt/Pd) ratio; (H) platinum/gold (Pt/Au) ratio; (I) nickel/iron (Ni/Fe) ratio; and (J) chromium/cobalt (Cr/Co) ratio. The elemental peaks suggest the influx of additional amounts of non-local Ir, Pt, Ni, and Cr. The main peaks in the green horizontal bar represent the YDB layer (sample E301) with a Bayesian-model radiocarbon age of 12,800 ± 40 cal BP. All YDB elemental abundance peaks are substantially larger than background concentrations and average abundances for Earth’s upper continental crust, marked “Crust” at the red dashed line. The plots are adapted from Moore et al. [1, 37] and are usable under Creative Commons, CC by 4.0 (http://creativecommons.org/licenses/by/4.0/).
We now discuss the potential processes of formation and origin of the fractured quartz grains identified in the YDB cosmic impact layer at Abu Hureyra. This discussion is critical because the features exhibited in the YDB shock-fractured quartz grains most likely formed at relatively low pressures. Because tectonic lamellae also form at relatively low pressures, it is crucial to differentiate those from cosmic airbursts and crater-forming impacts.
Production of fractures containing amorphous silica
Several laboratory experiments have investigated the impact-related shock transformation of quartz to amorphous silica at minimum pressures of <6 GPa (as discussed in Hermes et al. [10]). However, it appears that no previous experiments have been conducted on unconsolidated quartz grains as in our investigation but rather, were only done on tightly constrained large crystals or milled cylinders of quartz. None of the following studies are analogous with the relatively unconsolidated quartz grains characteristic of the YDB sediments at Abu Hureyra.
Christie and Ardell [12] performed shock compression laboratory experiments on large quartz crystals and noted amorphous silica glass filling the fractures at a confining pressure of 1.5 GPa.
Kenkmann et al. [85] performed shock experiments on 1.5-mm-wide cylindrical samples of quartz. Using moderate shock pressures of 6–34 GPa, they could generate veins of amorphous silica that were 1–6 μm wide.
Kowitz et al. [4, 8, 34] conducted detailed laboratory experiments to determine the lower pressure limit for forming shock features called “sub-planar, intra-granular fractures.” [4] In their experiments, a steel plate was explosively driven into cylinders of quartz-rich sandstone at pressures of 5, 7.5, 10, and 12.5 GPa. Visible shock fractures and amorphous silica (~1.6 wt%) first appeared at 5 GPa [4], similar to the results of Kieffer [28]. See Table 3.
In quartz grains experimentally shocked at 5 to 17.5 GPa, Fazio et al. [88] observed glass veins composed of amorphous silica extending several microns in length and generally thicker than 50 nm.
Wilk et al. [89] found amorphous silica in experimentally shocked rocks called shatter cones that formed at low shock pressures of 0.5–5 GPa.
Laboratory shock experiments by Martinelli et al. [90] produced intragranular fractures in quartz crystals with a minimum diameter of 3400 μm, larger than any we examined. The fracturing process reportedly produced amorphous silica composed of low-temperature nanocrystalline cristobalite, which was not observed in the fractures of our study. The reported compression applied was as low as 0.2 GPa; the maximum compression is unclear.
Shock stages in sandstones.
| Shock stage | Range, low (GPa) | Range, high (GPa) | Lithology |
|---|---|---|---|
| 0 | ≤0.2 | 0.9 | Undeformed, porous sandstone |
| 1a | 0.9 | 3 | Compacted, porous, deformed sandstone |
| 1b | 3 | 5.5 | Compacted, non-porous, deformed sandstone |
| 2 | 5.5 | 13 | Dense sandstone with 3 to 10 wt% glass and <95% quartz |
| 3 | 13 | 39 | Dense sandstone with up to 20 wt% glass and 45 to 80 wt% quartz |
| 4 | >30 | – | Dense sandstone with 20 to 75 wt% glass and 15 to 45 wt% quartz |
| 5 | – | – | Vesicular rock with 80 to 100 wt% glass and up to 15% quartz |
According to shock experiments by Kieffer et al. [28, 29] (Table 3), glass begins to appear in shock-fractured quartz in sandstones only at pressures ≥5.5 GPa, although fractures form without glass filling at lower pressures. These data are from Kowitz et al. [4], based on Kieffer [28, 29] and modified by others [86, 87].
In summary, these laboratory studies report the formation of amorphous silica in fractures produced by shock pressures averaging 4.2 GPa (range 0.2 to 10 GPa), with five of the eight studies reporting >5 GPa as a minimum observed pressure. No experimental study has ever reported glass-filled fractures in natural unshocked quartz grains, nor have they been observed in nature from any non-impact process [10, 14]. In contrast, Ernstson et al. [91] have reported extensive glass-filled fracturing in cosmic impact events during the Cenozoic.
Regarding the importance of amorphous silica in studies of impact-shock metamorphism, French and Koeberl [20] stated that “amorphous or ‘glassy’ phases … constitute another set of unique and distinctive criteria for the recognition of shock-metamorphosed rocks….” Similarly, Bohor et al. [13] stated that “the formation of quartz glass within fractures … allows a definitive distinction … between these shock PDFs and the glass-free dislocation trails marking slow tectonic deformation.”
Sources for amorphous silica (glass)
We now consider alternate possibilities for forming amorphous silica, including whether the glass might be hydrated silica (opal, hyalite), which commonly precipitates onto quartz grains. However, this study’s glass is inconsistent with hydrothermal quartz, hyalite, opal, or melted silicious plant material. This inconsistency is because the filling lacks spherical micro-structures often present in opal [92] and because TEM-EDS analyses reveal insufficient oxygen levels to account for silica’s hydration [92], typically ~66 wt% oxygen. Instead, we observed oxygen concentrations of ~14 to 48 wt% for the glass in the YDB samples, too low to represent hydrated silica. For all shock-fractured grains analyzed, the wt% of oxygen was less than 53 wt%, the stoichiometric value for quartz, indicating that the grains would have experienced a sequence of events following exposure to high temperatures: i.e., they melted, the quartz dissociated, oxygen was driven off, native silica was left behind and mixed with SiO2, and then cooled under oxygen-deficient conditions. This result is consistent with the known sequence of cosmic impact events.
The material filling the fractures is not chalcedony, agate, or onyx because these are microcrystalline forms of quartz with textures easily detected using high-resolution SEM and TEM. Similarly, the filling is not chert or flint, which are forms of cryptocrystalline quartz, because TEM and SEM analyses would reveal visible texturing, and we found none.
Lamellae in tectonically deformed quartz may resemble shock fractures. However, Gratz et al. [14] reported that glass has never been observed in tectonically deformed quartz grains (J. Christie, personal communication in Gratz et al. [14]). Bohor et al. [13] also concluded that the formation of quartz glass within fractures caused by high-strain-rate shock waves associated with impacts is distinctively different from the glass-free dislocations marking slow tectonic deformation. Likewise, Hermes et al. [10] reported that one of the co-authors of that study (H.-R. Wenk) had performed multiple analyses of tectonic lamellae and never observed amorphous silica associated with tectonic lamellae in quartz grains [81, 82, 92–95].
We also considered whether it might be possible that these fractured quartz grains are intrusive from an older or younger cosmic impact event. However, they were not found above or below the 12,800-year-old YDB layer at Abu Hureyra, making it unlikely that they are from a different event. In addition, the excavation trench was atop a large mound, making it unlikely that the grains were redeposited upslope by erosion of older sediments during the early Younger Dryas.
Potential formation mechanisms
There are several possible mechanisms for glass-filled fractures that are not mutually exclusive, including grain-to-grain collisions, shockwave pressures that exceed the compressive strength of the grains, intra-grain reflected pressures that exceed the tensile strength of the grains, and rapid thermal expansion followed by rapid quenching.
In a previous study, Kieffer et al. [29] proposed the formation of glass-filled fractures through a process called “jetting,” in which molten quartz is injected under high temperature, pressure, and velocity into the fractures in quartz grains. For silica to be forced into the fractures, both pressures and temperatures must be very high. Such conditions are common in cosmic airbursts and impact structures but not during other natural processes.
Ernstson [33] conducted low-shock experiments with 6-mm plastic projectiles at 1250 m/s impact velocity fired into glass rods. He observed extreme tensile fragmentation by spallation, defined as the sum of effects related to rarefaction waves in quartz grains during a cosmic impact event. During spallation, compressive shock waves enter a quartz grain, intersect an internal grain boundary, and are then reflected as a rarefaction pulse. If the reflected tensile stress exceeds the tensile strength of the quartz grain, the shock wave produces tensile fractures roughly perpendicular to the shock direction. Because the tensile strength of quartz is much lower than its compressive strength, tensile fracturing and spallation frequently cause the most mechanical damage to a quartz grain. Distinct glass-filled shock fractures in quartz grains as the result of shock spallation were first reported for impactites from the Bronze Age/Iron Age Chiemgau impact [33, 96, 97] and later from shocked impact melt rocks in the Pleistocene/Holocene Saarlouis/Nalbach impact event [91]. In both cases, the glass penetrated from outside the shocked cobbles into the open spallation fractures.
In laboratory experiments, Martinelli et al. [90] concluded that fractures in quartz form rapidly in <50 ns not by compression but by tensional expansion produced by the reflected shockwave. They found that the fracturing process generates temperatures >1713°C, the melting point of quartz, thus producing amorphous silica along the fractures, as first proposed by Ernstson [33].
Few investigations have been conducted to characterize low- to moderate-pressure glass-filled shock fractures and lamellae. Currently, based on the available evidence and the above-cited studies (e.g., Kieffer et al. [29] and Ernstson [33]), molten silica or silica vapor may be injected into a quartz grain along several potential zones of weakness, including new fractures produced (i) by the impact shockwave; (ii) by the high temperatures of the airburst or impact; (iii) along pre-existing PDFs and PFs; (iv) along pre-existing tectonic lamellae; (v) along pre-existing subgrain boundaries; and (vi) along pre-existing quartz fractures. This shock fracturing process would overprint and modify any pre-existing features. Even though these different types of fractures may form under substantially different shock conditions, all have one common characteristic: amorphous silica is injected into them. Alternatively, high airburst/impact pressures may cause friction that produces amorphous silica, as is accepted for classical PDFs and PFs. In any event, further research is needed to understand the glass’s formation process fully.
Conclusion
This investigation is the first to have identified and described shock-fractured quartz specific to the YDB cosmic impact layer at the onset of the Younger Dryas climate episode in the Abu Hureyra archeological site, thus verifying this as a cosmic impact layer. Using multiple high-resolution analyses, we observed that some quartz grains in the YDB layer are similar to those that Hermes et al. [10] reported for nuclear airbursts and Meteor Crater. These grains display fractures that:
Are either open or filled with amorphous silica glass;
Are commonly oriented in the same approximate direction;
Typically cross the entire quartz grain or sub-grain;
Do not cross sub-grain boundaries;
Range from near-planar to curvilinear;
Are commonly sub-parallel in orientation;
Are often spaced less than a few microns apart;
Usually range from less than one micron thick down to a few nm, and
Are typically closely aligned with any Dauphiné twins.
Most of these quartz grains appear to have been exposed to temperatures high enough to partially melt the entire grain, after which some portions remained amorphous while others recrystallized, sometimes as Dauphiné twins in alignment with the fractures. This evidence implies formation temperatures of >1713°C, quartz’s melting point of quartz, and most likely at >2200°C, its boiling point. Multiple previous investigations have concluded that when amorphous silica is present within shock fractures or shock lamellae, its presence allows for the unequivocal differentiation between impact-related shock fractures and the glass-free lamellae that mark slow-strain tectonic deformation.
We conclude that glass-filled fractures support the hypothesis that a near-surface airburst occurred near the Abu Hureyra village. The shockwave from the low-altitude airburst coupled with the Earth’s surface, thus producing extreme temperatures and pressures that fractured and melted quartz grains, melted or vaporized surficial sediments, and introduced molten silica into the fractures.