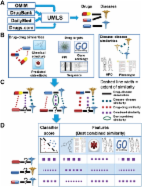
Introduction Associating accurate indications with new molecules or alternative indications for approved drugs is a key step in drug development. High drug development costs (DiMasi et al, 2003) call for computational solutions that would minimize production time and ultimately development costs (Terstappen and Reggiani, 2001). Current computational methods for indication prediction mainly focus on small-scale applications, where drugs that target proteins in disease-specific molecular networks are sought (Kinnings et al, 2009; Li et al, 2009; Kotelnikova et al, 2010), while large-scale attempts are still scarce. Previous attempts for large-scale identification of novel drug indications include: (i) matching of gene expression profiles proposed by the Connectivity Map (CMap) consortium (Lamb et al, 2006; see also Hu and Agarwal (2009)) and (ii) the ‘Guilt by Association' (GBA) approach (Chiang and Butte, 2009). CMap is a database containing ranked drug response gene expression profiles. Querying the database with a disease-specific genetic signature, CMap identifies drug response profiles that either correlate (i.e., upregulated signature genes tend to appear at the top of the profile while downregulated signature genes tend to appear at the bottom of the profile) or anti-correlate with it. A similar approach was proposed by Hu and Agarwal (2009), using gene expression measurements downloaded from the Gene Expression Omnibus (GEO; Edgar et al, 2002). While the CMap approach can be applied to any potential drug, its prediction power has not been assessed at large scale to date. As discussed in Hu and Agarwal (2009), the gene expression approach currently suffers both from low precision due to profiles generated under different conditions and from incapability to capture drug–disease associations that are not manifested at the gene expression level. GBA (Chiang and Butte, 2009) attempts to predict novel associations between drugs and diseases by assuming that if two diseases are treated by the same drug, alternative drugs treating only one of them might treat also the other. It is thus applicable only in the drug repositioning setting, where some indication for the drug in question is already known. A related work combined drug–drug similarities and drug indications for the inference of drug–gene associations (Hansen et al, 2009). Here, we present an approach for predicting novel associations between drugs and diseases that can operate on both drugs with approved indications and on novel molecules with no indication information. Given a query association, we measure the similarity of the pertaining drug and disease to drug–disease pairs that are known to be associated, and rank the accumulative evidence for association using a logistic regression scheme. The prediction process is aided by a comprehensive drug–disease association data set that we have compiled and a collection of novel drug–drug similarity measures. Importantly, we show the potential utility of our approach also in a personalized medicine setting, in which a disease name is replaced by a gene expression signature; and consequently, disease–disease similarity is measured via the similarity of the corresponding signatures. Results and discussion PREDICT—an algorithm for predicting drug indications We designed a novel algorithm for PREdicting Drug IndiCaTions (PREDICT). Given a gold standard set of drug–disease associations (known associations), the algorithm ranks additional drug–disease associations based on their similarity to the known associations. The algorithm works in three phases (Figure 1): (i) construction of drug–drug and disease–disease similarity measures; (ii) exploiting these similarity measures to construct classification features and subsequent learning of a classification rule that distinguishes true from false drug–disease associations; and (iii) application of the classifier to predict new associations. The gold standard of drug–disease associations used for training was constructed from multiple sources, matching drugs, drug indications and disease names using the Unified Medical Language System (UMLS), as described in Materials and methods. In brief, the gold standard data set spans 1933 associations between 593 drugs taken from DrugBank (Wishart et al, 2008) and 313 diseases listed in the Online Mendelian Inheritance in Man (OMIM) database (Hamosh et al, 2002; Supplementary Table S1). OMIM holds a comprehensive set of phenotypic descriptions of diseases and disorders, including complex multiple-gene disorders, allowing for the construction of phenotypic similarity measures. Hard to treat congenital anomalies were removed using the International Classification of Diseases (ICD-10) (see Materials and methods). We provide an overview of the algorithmic steps below; full details are given in Materials and methods. For the first algorithmic phase, we assembled five drug–drug similarity measures between the 593 drugs in our gold standard and two disease–disease similarity measures between the 313 associated diseases. The drug–drug similarity measures include chemical similarity, similarities based on registered and predicted side effects (Kuhn et al, 2010; Atias and Sharan, 2011) and similarities between drug targets, including sequence similarity, distance on a protein–protein interaction (PPI) network and gene ontology (GO) (Ashburner et al, 2000) semantic similarity. The disease–disease similarity measures are based on semantic similarity of disease phenotypes according to the van Driel et al (2006) text mining scheme and the human phenotype ontology (HPO; Robinson and Mundlos, 2010). The second algorithmic phase integrates the drug–drug similarities and disease–disease similarities to construct classification features and subsequently learns a classification rule that distinguishes between true and false drug–disease associations. For each query drug–disease association, we constructed features expressing its similarity to the closest known drug–disease association, using the scoring scheme of Perlman et al (2011). Each feature is based on one drug–drug similarity measure and one disease–disease similarity measure, resulting in 10 features overall. Once the features were constructed, we learned a logistic regression classifier that automatically weighs the different features to yield a classification score. Performance evaluation and comparison with other methods To evaluate our classification scheme, we applied it in a 10-fold cross-validation setting. To avoid easy prediction cases, we hid all the associations involved with 10% of the drugs in each iteration, rather than hiding 10% of the associations. Our method obtained an area under the Receiver-Operating Characteristic Curve (AUC) of 0.9±0.01 (see Materials and methods). In order to validate that the prediction accuracy is not biased by redundant drugs, such as chemically similar drugs or drugs with similar targets, we created three types of non-redundant drug sets by filtering for (i) chemically similar drugs (Tanimoto coefficient >0.7); (ii) drugs with sequence similar drug targets (normalized sequence similarity >0.7); and (iii) drugs sharing at least one target (see Materials and methods). The obtained AUCs remained high: 0.89±0.02 for 427±3 chemically dissimilar drugs, 0.88±0.02 for 290±4 drugs with sequence dissimilar targets and 0.85±0.03 for 99±3 drugs sharing no target. The AUC scores obtained by the algorithm for different Tanimoto coefficient cutoffs are plotted in Supplementary Figure S1, showing comparable performance even at a cutoff of 0.4. We compared our classification results with two previous methods: (i) the GBA method of Chiang and Butte (2009) and (ii) the CMap approach (Lamb, 2007). Since the GBA method cannot handle drugs for which no associations are known, we compared with it using a modified 10-fold cross-validation setting, in which associations (rather than drugs) are hidden in each iteration. Under this setting, the GBA method obtained false positive rate (FPR) and true positive rate (TPR) scores of 0.13 (±0.006) and 0.77 (±0.005), respectively, corresponding to a single point in the Receiver-Operating Characteristic (ROC) space (as GBA does not rank its predictions, a full curve could not be constructed). Supplementary Figure S2 displays the ROC curve of our method in this scenario (AUC=0.913±0.002) and the FPR–TPR point of the GBA method, which falls below our curve. CMap predicts drug–disease associations by looking for drug response gene expression profiles that anti-correlate with a disease signature. In order to compare with CMap, we downloaded 171 disease genetic signatures from ArrayExpress (Parkinson et al, 2009) and mapped them to 239 OMIM diseases by matching a selected set of common UMLS concepts (see Materials and methods). We filtered signature genes with inconclusive regulation direction (i.e., genes that were both upregulated and downregulated across various experiments for the same disease, allowing up to 10% errors; see Materials and methods) and disregarded signatures that did not comply with the restrictions of CMap, including signatures having only upregulated or downregulated genes and signatures with >1000 genes. Overall, 36 signatures survived this filtering, 19 of which mapped to OMIM diseases included in our data set. The intersection of CMap drugs with our set of 593 drugs yielded 69 drugs spanning 149 known associations. The resulting CMap AUC score was small (AUC=0.45; no standard deviation included due to the deterministic nature of the method). Quite strikingly, using our method on this set, we obtain an AUC of 0.92±0.02. In order to compare our performance with CMap over the entire set of 36 signatures, we replaced the phenotypic disease similarity with a signature-based similarity (see Materials and methods). The latter similarity enables comparing CMap predictions for 37 diseases (corresponding to the 36 signatures, with several signatures mapping to more than one OMIM entry) and 71 drugs, spanning 266 associations. The CMap AUC score for this enlarged set, however, remains small (AUC=0.42). In contrast, employing our method replacing the phenotypic disease similarity with the signature-based similarity, we obtained an AUC score of 0.93±0.02. These sets of 19 diseases (using the phenotypic similarity measures) and 37 diseases (using the signature-based similarity measures) were used solely for comparison purpose and are not used in the sequel. We note that Hu and Agarwal (2009) suggested a similar method to CMap, whereby they compared disease and drug expression profiles downloaded from GEO in a similar manner. The authors published a set of predictions, which contains 43 diseases and 45 agents, but the latter could be mapped to merely five diseases and five drugs from our collection (see Materials and methods), preventing a proper comparison. Analysis of novel predictions After evaluating our method, we turned to employ it for predicting new drug–disease associations (see Materials and methods). Our first set of predictions consists of new associations for known drugs (i.e., drug repositioning) (Figure 2). To prune and validate our predictions, we first used a set of 752 low-confidence associations that were retrieved from only one source of descriptive drug indication and thus were not part of the drug indication gold standard (see Materials and methods). Supplementary Figure S3 displays the hypergeometric enrichment P-value of the low-confidence set in our ranked list of predictions, obtained at different score thresholds (the ranked list contains 183 676 possible associations between the 593 drugs and 313 diseases, excluding known associations). The threshold yielding the lowest P-value results in a set of 9476 novel drug–disease associations, representing putative drug repositionings for 580 drugs (out of 593 drugs). These associations cover 39% of the low-confidence associations in the data (hypergeometric P<2 × 10−177). In order to test whether our predictions are in accordance with current experimental knowledge, we checked the extent to which they appear in current clinical trials. We downloaded drug–disease data from the registry of federally and privately supported clinical trials conducted around the world (http://clinicaltrials.gov/). Overall, we acquired 16 506 unique drug–disease associations that are being investigated in clinical trials (phases I–IV). In all, 2552 of these associations involve drugs and diseases that are present in our data set, spanning 1943 associations that are not part of our gold standard. Using the P-value threshold found independently above, we cover 27% of the clinical trial associations (hypergeometric P<2 × 10−220). The percentage of phase III clinical trial associations predicted by our method is markedly high, covering 38% of the tested associations (hypergeometric P<6 × 10−128). Table I summarizes the coverage of the predicted associations with respect to the clinical trial associations across the different phases. To further validate our predictions, we used tissue-specific expression data, motivated by the assumption that if a disease is manifested in a certain tissue then for a drug treating it to have an effect, its targets should be expressed in that tissue. We compared two means of associating a drug with a set of tissues: (i) tissues where the drug target is expressed and (ii) tissues affected by diseases that the drug is treating. Using tissue-specific gene expression data by Su et al (2004) and literature-based disease–tissue associations of Lage et al (2008), we could show that indeed, drug targets are significantly expressed in the same tissues that the indicated diseases affect, supporting our assumption (hypergeometric P<0.003; see Materials and methods). Notably, we observed a similar result for our set of predicted associations (P<0.006). The distribution of our predictions across different classes of drugs (according to the Anatomical, Therapeutic and Chemical (ATC) classification system; Skrbo et al, 2004) is shown in Figure 3. Notably, we predict significantly more indications for drugs belonging to ATC classes of Dermatologicals and Genito urinary system and sex hormones, which is the result of multiple predictions made for glucocorticoids receptors (e.g., desoximetasone and methylprednisolone) and for sex hormones (testosterone and progesterone), suggesting that these drugs should be further studied for broader indications. The full list of predictions is provided in Supplementary Table S2; and here, we highlight a few interesting examples. For instance, Cabergoline, indicated for Hyperprolactinemia is predicted to treat Migrane. Supporting this prediction, Verhelst et al (1999) found in a large study of Cabergoline treatment in Hyperprolactinemia that symptoms of migraine significantly improved in 72% of the patients ; in another smaller scale study, treatment by the drug reduced the number of days of headache per month (Cavestro et al, 2006). As another example, Progesterone is predicted to treat renal cell cancer, non-papillary (npRCC). Indeed, Medroxyprogesterone acetate, a synthetic derivative of progesterone, was suggested as a possible treatment for treating advanced RCC (Izumi et al, 2007). Finally, Azathioprine, an immunosuppressive agent, is predicted to treat familial Mediterranean fever, a hereditary inflammatory disorder. A small study has found it successful in completely stopping fever attacks in this disorder (Sayarlioglu et al, 2006). In addition to repositioning current drugs, we examined the utility of our method in predicting indications for ‘new' drugs, by inferring disease indications for drugs for which we have no disease indications in our databases. The training was done in the same manner as in the drug repositioning scheme, and the same prediction cutoff value was used. Overall, we attained 3108 predictions which we validated using the same tissue specificity approach described above (P<0.02, see Supplementary Figure S4). The full list of predicted indications for new drugs is listed in Supplementary Table S3. In the following, we highlight some of these predictions. The top five predictions for Paget's disease of bone are presented in Supplementary Table S4. We observe that while the two top ranking drugs are chemically similar to drugs indicated for Paget's disease (Risedronate and Alendronate, respectively), the other three bear only moderate chemical similarity to known drugs for Paget's disease (e.g., Salmon Calcitonin) but share a target with another drug for Paget's disease (Tiludronate, targeting tyrosine-protein phosphatase non-receptor type 1). Another interesting finding is the prediction of Cycloleucine for the treatment of Alzheimer's disease (AD). We found that Cycloleucine inhibits methionine adenosyltransferase (MAT) activity, where MAT was abnormally high in brains from patients with AD (Gomes Trolin et al, 1998). Furthermore, it was found that Cycloleucine is a potent and selective antagonist of NMDA receptor-mediated responses (Hershkowitz and Rogawski, 1989), a new promising class of chemicals for the treatment of AD (Farlow, 2004). Finally, Hyperforin, St John's wort extract, is predicted to treat hyperthermia. Interestingly, St John's wort extract was found to have anxiolytic effects on stress-induced hyperthermia in mice (Grundmann et al, 2006). Toward personalized medicine—representing diseases by their gene expression profiles Having shown that our method succeeds in predicting drug–disease associations based on phenotypic descriptions of diseases, we wished to test its application in a personalized medicine scenario, where a patient may be characterized by his/her gene expression signature. To this end, we substituted the disease–disease phenotypic similarity measures with similarity measures based on disease-specific gene signatures. This was done to simulate a scenario where we are given a patient's expression profile and directly query the database with this signature to suggest the best fitting drug for this signature. Using 171 disease signatures from ArrayExpress, we constructed four disease–disease similarity measures (see Materials and methods). Using the same five drug–drug similarities described above and the signature-based disease–disease similarity measures, we were able to predict drug–disease associations for 261 drugs and 114 diseases with an AUC score of 0.92±0.01. The intersection between these 114 diseases and the 313 diseases represented in the phenotypic similarities includes 47 diseases. Comparing the AUC scores obtained on these 47 diseases using both types of similarities, it was encouraging to observe that the signature-based similarities performed identically to the phenotypic ones, while combining the two types of similarities only slightly improved the results (AUC increase of 0.01). We further used the signatures to provide drug repositioning predictions. Using the same low-confidence associations (i.e., drug–disease associations that were retrieved from only one source of descriptive drug indication) to determine a cutoff, as described for the phenotypic similarity measure, we obtained a list of 2103 novel predictions. These predictions significantly matched low-confidence associations (see Supplementary Figure S5 for the resulting P-values, best P-value <1.4 × 10−101) and associations that are currently in clinical trials (P<1.4 × 10⁻³⁰, see Supplementary Table S5). They also exhibited significant agreement with the tissue-specific gene expression information (P<4.1 × 10⁻¹⁶). Importantly, the high predictive power of the gene expression signatures serves as an initial proof-of-concept for the possible future utility of our method also in this personalized medicine setting. Conclusions We presented PREDICT—a scheme for similarity-based inference of novel drug indications, capable of handling both approved and novel drugs. Our method attained high rates of specificity and sensitivity in cross-validation (AUC=0.9), surpassing existing methods. Furthermore, our predictions attained significant coverage of drug–disease associations tested in clinical trials and are in good agreement with tissue-specific expression information on the targets of the corresponding drugs, suggesting that they can be regarded as valuable leads for further research. An important property of our method is that it allows easy integration of additional similarity measures among diseases and drugs. We exploited this property to broaden the applicability of our method by incorporating disease-specific genetic signatures as similarity measures. This will likely to be of significance in the near future, with the accumulation of patient-specific genetic information, such as expression profiles or genotypes, in conjunction with detailed medical records. Our approach may then serve as a basis for patient tailored predictions. Materials and methods Data sets Drug targets, drug indications and canonical simplified molecular input line entry specification (SMILES) (Weininger, 1988) of the drugs were extracted from DrugBank (Wishart et al, 2008). Additional drug targets were obtained from the DCDB (Liu et al, 2010), Matador (Gunther et al, 2008) and KEGG DRUG (Kanehisa and Goto, 2000) databases. FDA drug labels and additional drug indications were downloaded from the DailyMed site (http://dailymed.nlm.nih.gov) and from http://drugs.com. Drug side effects were obtained from SIDER (Kuhn et al, 2010). Human PPIs were compiled from experimental and literature curated data (Xenarios et al, 2002; Rual et al, 2005; Stelzl et al, 2005; Ewing et al, 2007; Breitkreutz et al, 2008). Protein sequences and GO annotations (Ashburner et al, 2000) were downloaded from UniProt (Jain et al, 2009). Clinical trials data were downloaded from a registry of federally and privately supported clinical trials (http://clinicaltrials.gov/). Disease signatures were downloaded from the Gene Expression Atlas of ArrayExpress (Parkinson et al, 2009). Assembling drug–disease associations We assembled associations between diseases listed in the OMIM (Hamosh et al, 2002) and their indicated drugs, registered in DrugBank (Wishart et al, 2008). OMIM is a comprehensive disease phenotype database, encompassing thousands of phenotypic descriptions of diseases and disorders, including single-gene as well as complex multiple-gene disorders, allowing for the construction of phenotypic similarity measures. In order to handle variations in disease names between OMIM and drug indication sources, we mapped disease names to UMLS concepts (Bodenreider, 2004), serving as a standardized terminology. We began by mapping OMIM disease names to UMLS concepts, exploiting the integrated curated mapping between OMIM and UMLS concepts and augmented the mapping by using the MetaMap tool (Aronson, 2001). The MetaMap tool uses symbolic, natural language processing and computational linguistic techniques to map biomedical text to the UMLS metathesaurus, and was previously reported to exceed human mapping (to UMLS concepts) capabilities (Pratt and Yetisgen-Yildiz, 2003). We permitted only disease-related UMLS concept types (e.g., ‘Disease or Syndrome', ‘Anatomical Abnormality' or ‘Neoplastic Process') and filtered ambiguous or generic UMLS concepts (e.g., ‘Infections' or ‘Syndrome'). We further augmented the MetaMap mapped UMLS concepts with the rich synonymy relationships embedded in the UMLS. Supplementary Table S6 lists the mapping between OMIM disease names and UMLS concepts. The associations between drugs and UMLS disease concepts were integrated from four different sources using three different methods: (i) direct mapping to drugs, exploiting embedded UMLS links between concepts and drugs; (ii) drug–condition associations downloaded from http://drugs.com, where conditions were mapped to UMLS concepts using MetaMap; and (iii) indication-based mapping. For the latter, we extracted UMLS concepts using the MetaMap tool from textual drug indications downloaded from FDA package inserts (available in the DailyMed website, http://dailymed.nlm.nih.gov) and DrugBank. In addition, we manually added 44 associations occurring in phase IV (post-marketing) clinical trials. In order to deal with variations in drug names, we used generic and synonymous drug names; if no match was found, we used also brand names retrieved from DrugBank. We removed UMLS concepts matching hard to treat congenital anomalies such as congenital malformations, chromosomal abnormalities and inborn errors of metabolism using the ICD-10. We filtered disease names classified under the ICD-10 chapter XVII (Congenital malformations, deformations and chromosomal abnormalities (Q00–Q99)) and metabolic disorders (E70–E90) by mapping them to UMLS concepts using MetaMap followed by manual curation of the list, resulting in the removal of 263 OMIM diseases. Finally, performing a manual curation of the extracted UMLS concepts from textual description of drug indications, we observed that they are more prone to false positives. We thus required that associations extracted from drug indications appear also in at least one more source. Similarity measures We defined and computed five drug–drug similarity measures and two disease–disease similarity measures. Three of the drug–drug similarities (3–5) are gene related, based on the drug targets downloaded from DrugBank. For drugs associated with more than one gene, maximal similarities between the associated genes were averaged (averaging over the contribution of each member in a drug pair for symmetry). All similarity measures were normalized to be in the range (0, 1). We used the following drug–drug similarity measures: (1) Chemical based: Canonical SMILES (Weininger, 1988) of the drug molecules were downloaded from DrugBank (Wishart et al, 2008). Hashed fingerprints were computed using the Chemical Development Kit with default parameters (Steinbeck et al, 2006). The similarity score between two drugs is computed based on their fingerprints according to the two-dimensional Tanimoto score (Tanimoto, 1957), which is equivalent to the Jaccard score (Jaccard, 1908) of their fingerprints, that is, the size of the intersection over the union when viewing each fingerprint as specifying a set of elements. (2) Side effect based: Drug side effects were obtained from SIDER (Kuhn et al, 2010), an online database containing drug side effects associations extracted from package inserts using text mining methods. We augmented this list by side effect predictions for drugs that are not included in SIDER based on their chemical properties (Atias and Sharan, 2011). Following this latter work, we defined the similarity between drugs according to the Jaccard score between either their known side effects or top 10 predicted side effects in case they are unknown. (3) Sequence based: Based on a Smith–Waterman sequence alignment score (Smith et al, 1985) between the corresponding drug-related genes. Following the normalization suggested in Bleakley and Yamanishi (2009), we divide the Smith–Waterman score by the geometric mean of the scores obtained from aligning each sequence against itself. (4) Closeness in a PPI network: The distances between each pair of drug-related genes were calculated on their corresponding proteins using an all-pairs shortest paths algorithm on the Human PPI network. Distances were transformed to similarity values using the formula described in Perlman et al (2011): where S(p,p′) is the computed similarity value between two proteins, D(p,p′) is the shortest path between these proteins in the PPI network and A, b were chosen according to Perlman et al (2011) to be 0.9 × e and 1, respectively. Self similarity was assigned a value of 1. (5) GO based: Semantic similarity scores between drug-related genes were calculated according to Resnik (1999), using the csbl.go R package (Ovaska et al, 2008) selecting the option to use all three ontologies. For diseases, we employed two sets of measures, depending on whether we wished to exploit phenotypic (1–2) or gene signature information (3–6). As in drugs similarities, maximal values between the two lists of associated genes were averaged (taking into account both sides for symmetry). The disease–disease similarity measures we used include: (1) Phenotype based: We used the phenotypic similarity constructed by van Driel et al (2006). The phenotypic similarity was constructed by identifying similarity between MeSH terms (Lipscomb, 2000) appearing in the medical description of diseases from the OMIM database (Hamosh et al, 2002). (2) Semantic phenotypic similarity: We used the hierarchical structure of the HPO (Robinson and Mundlos, 2010) together with the mapping provided by HPO between ontology nodes and OMIM diseases to construct a semantic similarity score based on Resnik (1999). Applying this semantic similarity on the HPO data was previously shown to provide consistent clustering of diseases (Robinson et al, 2008). (3) Genetic based: Given genetic signatures of diseases obtained from gene expression experiments, we used a Jaccard score between every pair of signatures, taking into account the direction of the response of each gene. That is, the total number of mutual upregulated genes and mutual downregulated genes over the unified list of all genes. Signature genes with inconsistent regulation directionality for the same disease across various experiments (i.e., registered as both upregulated and downregulated across various experiments for the same disease) were filtered, allowing for up to 10% expression measurement errors. (4–6) Signature sequence based, signature PPI based and signature GO based: Similar to the drug–drug sequence-, PPI- and GO-based similarity, respectively, we used these similarities between genes participating in the two signatures. Combining measures to classification features The classification features that we used were constructed from association scores calculated on pairs of drug–drug and disease–disease similarity measures, resulting in 10 features when using the phenotypic disease similarities and 20 features when using the signature-based similarities. For a given similarity measure pair (i.e., feature), the score of a given drug–disease association (d r , d i ) is calculated by considering the similarity, according to the given pair, of all known drug–disease associations to this association. The computation is done as follows: First, for each known associations (d r ′, d i ′) we compute the drug–drug similarity S(d r , d r ′) and the disease–disease similarity S(d i , d i ′). Next, we follow the method of Perlman et al (2011) to combine the two similarities to a single score by computing their weighted geometric mean. Here, we chose to use a simple (unweighted) geometric mean as the resulting AUC score was robust to the weighting parameter under a wide range (AUC difference<0.01, data not shown). Thus: Prediction assessment We used a 10-fold cross-validation scheme to evaluate the accuracy of our prediction algorithm. To concentrate on ‘hard' cases, we hid 10% of the drugs in each iteration rather than 10% of the associations. The training set used for the cross-validation included 1933 true drug–disease associations and a randomly generated set of drug–disease pairs (not part of the positive set), twice as large as the positive set. To obtain robust AUC score estimates, we performed 100 independent cross-validation runs, in each of which a different random partition of the training set to 10 parts was used; we then averaged the resulting AUC scores. We note that taking a negative set of the same size as the positive set, three-fold larger or even 50 times as large had a negilible effect on the resulting AUC score (<0.01). In order to test the effect of redundant drugs on prediction accuracy, we created non-redundant sets of drugs filtered by three different methods: (i) chemical similarity above a Tanimoto coefficient ranging from 0.85 to 0.4; (ii) normalized sequence similarity between their targets ranging from 1 to 0.7; and (iii) target sharing. To this end, we iteratively selected the most similar pair and randomly removed one of the pair's drugs. We repeated this procedure 50 times for each similarity threshold to construct different non-redundant sets and averaged over the resulting AUC score (reporting also the AUC standard deviation). To evaluate the benefit of using a feature selection scheme, we employed both forward feature selection and backward feature elimination in a cross-validation setting to select the best-performing features. We found that the difference between the best feature set according to each feature selection method and using all the features was negligible (AUC difference <0.005). We thus retained the entire set of features. We used the MATLAB implementation of the logistic regression classifier (glmfit function with binomial distribution and logit linkage) for the prediction task. Comparison with other methods We implemented the GBA method of Chiang and Butte (2009) and applied it to the set of drugs and diseases appearing in our data. Since it cannot be tested using a cross-validation scheme that involves the removal of entire drugs, we tested it by removing associations instead. In order to compare our results with the CMap, we obtained disease gene signatures from the Gene Expression Atlas of ArrayExpress (Parkinson et al, 2009). We mapped the ArrayExpress disease titles to UMLS concepts using the same filtering procedures described above. These concepts were then matched to OMIM disease mapped UMLS concepts. We queried the online web tool of CMap with the signatures and followed CMap suggestion to select drugs obtaining negative enrichment (the signature has opposite effect to the drug expression profile) and non-null P-value. An ROC curve was obtained by choosing different P-values as cutoffs. Hu and Agarwal (2009) suggested a similar method to CMap, whereby they predicted drug–disease associations based on disease and drug profiles downloaded from GEO. The authors' published set of predictions contain 43 profiles tagged as diseases or infections and 45 profiles tagged as agents. We mapped disease names to OMIM identifiers using the same procedure used for constructing the gold standard, resulting in 17 mapped OMIM diseases. Mapping drug names, we matched generic, synonymous and brand names from DrugBank followed by additional manual mapping of unmapped names, obtaining 13 drugs successfully mapped to DrugBank entries. However, only five diseases and five drugs, connected by 10 predicted associations (out of the 17 diseases and 13 drugs) intersected our collection, preventing a proper comparison with this method. Novel predictions To predict novel indications for drugs, we used a training set that included all the known associations and a two-fold larger randomly generated set of drug–disease pairs that are not known to be associated (i.e., associations that do not appear in our drug indication gold standard). We applied the trained classifier to all remaining drug–disease pairs to form our prediction set. We repeated the analysis with another randomly picked negative set, distinct from the first one, to assign prediction scores also to the random negative set that we initially used for training. Overall, we obtained classification scores for all 183 676 unknown drug–disease pairs. We validated the predictions in two ways: (i) by comparing predicted drug–disease associations with drug–disease associations being investigated in clinical trials (phases I–IV) and (ii) by testing their agreement with tissue-specific gene expression information—that is, by comparing the tissues where the drug targets are expressed with tissues associated with the diseases predicted to be treated by the drug. All P-values were computed using a hypergeometric test. For the clinical trial validation, we downloaded phases I–IV clinical trials from http://clinicaltrials.gov/ and mapped the disease names to UMLS concepts using the MetaMap tool and drug names to DrugBank using the same procedures described above. For the tissue-related validation, we assembled two drug–tissue association matrices. The first matrix was constructed based on the tissue-specific gene expression of Su et al (2004). A drug was declared to affect a tissue if at least one of its targets is expressed in that tissue over a certain tunable threshold (see below). The second drug–tissue matrix was assembled by exploiting the disease–tissue associations computed by Lage et al (2008). Lage et al scored disease–tissue associations according to co-mentioning of diseases and tissues across PubMed (Korbel et al, 2005).Thus, a drug was associated with a tissue if at least one of its indicated diseases was associated with that tissue. We manually matched the tissue names specified by Su et al, to tissue names specified by Lage et al, resulting in 67 common tissues. Both the gene expression–tissue associations and the disease–tissue associations require thresholds to define true associations. In order to decouple the prediction task from tuning these thresholds, we randomly split the gold standard set of drugs into two disjoint groups (two thirds and a third), where we provide predictions only based on the larger group and use the smaller group for tuning the thresholds. We used the Wilcoxon rank sum test to test whether the drug targets are significantly expressed in tissues related to the diseases these drugs are predicted to treat. By the learned thresholds, genes with an expression value <380 were declared unassociated with a certain tissue, interestingly corresponding to the average expression in the entire data, and diseases with co-occurrence score <18 in a certain tissue were declared unrelated to that tissue. During learning, the Wilcoxon rank sum test yielded a P-value of 0.003 on the smaller group of known drug indications. Using the same tuned thresholds on the predictions made using the second group, we obtained a significant P-value of 0.006. Supplementary Material Table S1 Drug indications gold standard Table S2 Predicted repositioning of drug indications Table S3 Predicted drug indications for experimental drugs Table S6 Mapping between OMIM diseases and UMLS concepts Supplementary Material Review Process File